


1. Introduction
With escalating global climate change and continued advancement of the Paris Agreement’s emission targets, a green and low-carbon transition has become a common goal of the international community. As the world’s largest developing country and carbon emitter, China faces the formidable challenge of achieving "carbon peaking and carbon neutrality" while maintaining stable economic growth.
To address this, since 2016 China has implemented several major reform initiatives. In August 2016, the People’s Bank of China and six other ministries jointly issued the Guidelines for Establishing a Green Financial System, marking the first national-level framework for green finance policy. In June 2017, the State Council approved the establishment of the first batch of green finance reform and innovation pilot zones in five provinces—Zhejiang, Jiangxi, Guangdong, Guizhou, and Xinjiang—signaling the transition to substantive policy implementation. The pilot scope was later expanded in 2019 and 2022 to include more central and western regions, forming a three-phase, gradual rollout.
As a technology-intensive and innovation-driven sector, the NEV industry provides an ideal case to assess the effectiveness of green finance policies. China has been the world’s largest NEV market for nine consecutive years, with a market penetration rate of 31.6% in 2023, reflecting its strong momentum. However, current research has notable limitations: most studies focus on single policy tools and overlook synergies among policies; they insufficiently explore the dynamic impact of policy batches; and they rarely account for heterogeneity in firm technological characteristics. These gaps restrict policy precision and effectiveness.
To address this, we employ panel data on listed NEV firms in China from 2012 to 2022 and construct a novel staggered DID model to systematically evaluate the green finance pilot policy’s impact on technological innovation. We focus on three key questions: (1) Whether and how the policy promotes green technological innovation; (2) The mediating and moderating roles of R&D investment and financing constraints; (3) Heterogeneity of policy effects across ownership types and regions. This study deepens our understanding of the policy mechanisms of green finance and offers scientific support for policy optimization, contributing to the high-quality development of China’s NEV industry and its "dual carbon" goals.
2. Literature review and research hypotheses
Existing studies have confirmed that green finance policies can promote corporate innovation[1–3]. However, important research gaps remain. First, most studies focus on single policy tools[1–2], lacking a systematic analysis of synergistic effects among tools. Second, there is limited discussion on the alignment between industry-specific technological characteristics and policy design [3]. This study focuses on China’s green finance reform and innovation pilot zone policy, which utilizes diversified financial instruments such as green credit and green bonds, along with fiscal support to reduce financing costs [1], and leverages institutional incentives like tax breaks to encourage R&D investment [3]. Implemented in three progressive phases (2017, 2019, and 2022), the policy forms a compound mechanism involving "financial tools – institutional incentives – market synergy" [4]. Accordingly, this paper investigates the mechanisms through which the policy affects green technological innovation in NEV firms, aiming to fill the gaps in understanding policy synergy and industry fit.
H1: The green finance reform and innovation pilot zone policy significantly promotes green technological innovation in NEV firms.
Prior studies have explored how green finance policies promote green innovation through R&D investment. Li and Zhou [5]found that dedicated funding and tax incentives substantially reduce innovation costs and directly stimulate R&D investment. Chen et al [6].showed that pilot zone policies enhance R&D efficiency by fostering industry-university-research cooperation networks, especially benefiting breakthrough innovations. Wang et al [7].argued that policy-guided social capital provides long-term funding support for R&D. Nonetheless, two critical limitations persist in current research: (1) insufficient analysis of the synergistic effects of various policy tools such as subsidies and tax incentives; (2) lack of systematic evaluation of differences in R&D conversion efficiency among firms with distinct technological traits. In response, this study emphasizes the mediating role of R&D investment. The policy reduces R&D costs through direct financial support and tax deductions, enhances R&D efficiency via innovation clusters such as industry-university platforms, and ensures long-term capital through mechanisms like green industry funds. This “cost reduction – efficiency improvement – capital assurance” chain effectively transforms R&D input into innovation outputs, such as new technologies and improved processes.
H2: The green finance reform and innovation pilot zone policy promotes green technological innovation in NEV firms by increasing R&D investment.
Existing literature also examines how green finance policies alleviate financing constraints. Zhang and Wang [8]highlight that innovative tools such as environmental rights pledges expand financing channels. Liu et al [9].demonstrate that green certification improves credit conditions by reducing information asymmetry. Chen and Li [10]found that risk-sharing mechanisms can reduce financing costs by 15%–20%. International comparisons further suggest this effect is particularly strong in technology-intensive firms [11]. However, important gaps remain: (1) few studies systematically evaluate policy fit for firms of different sizes; (2) the threshold effect of financing constraints is underexplored. Given the characteristics of the NEV sector, this paper constructs a transmission chain of “channel expansion – cost reduction – innovation release”: the policy broadens financing access via professional financial service platforms and innovative pledge mechanisms, enhances credit status through green ratings, and ultimately eases financing constraints to unlock R&D resources. This mechanism exhibits a strong amplification effect in technology-intensive firms and offers a new perspective on the differential impacts of green finance policy.
H3: The green finance reform and innovation pilot zone policy enhances green technological innovation in NEV firms by alleviating financing constraints.
3. Variable description and model specification
3.1. Variable description
(1) Dependent Variable: Green Technological Innovation (Inva)Measured by the natural logarithm of the number of green invention patents filed by a firm in a given year plus one, i.e., ln(green patents + 1). This follows the log transformation method proposed by Hall et al [12].and the +1 adjustment by Cohen et al [13].to account for zero values.
(2) Core Explanatory Variable: Policy Implementation Effect (Treat × Post)Constructed based on a staggered difference-in-differences (DID) model:
Treat (Treatment Group Dummy): Equals 1 if the firm is registered in a province covered by any of the three batches of green finance reform and innovation pilot zones, and 0 otherwise.
Post (Policy Timing Dummy): Equals 1 from the year of policy implementation onward: 2017 for the first batch, 2019 for the second, and 2022 for the third batch.
Interaction Term (Treat × Post): Captures the average treatment effect of the pilot zone policy on firms in the treatment group.
(3) Control Variables:Include firm-level financial and governance characteristics: Leverage (Lev): total liabilities / total assets; Profitability (Roa): net profit / total assets; Firm Size (LnSize): natural logarithm of total assets; Ownership Concentration (Top1): shareholding ratio of the largest shareholder (%); Firm Age (LnAge): natural logarithm of firm age + 1; Executive/Shareholder Compensation (Pay): natural logarithm of executive compensation; ESG Rating (ESG): Huazheng ESG score, following You Liqun’s approach [14]
(4) Mediating Variable: R&D Investment (LnRD1)Defined as the natural logarithm of the ratio of R&D expenditure to total assets, used to measure the intensity of R&D activity while mitigating data skewness.
(5) Moderating Variable: Financing Constraints (KZ)Calculated using the Kaplan and Zingales Index (KZ Index), based on investment–cash flow sensitivity [15].
|
Variable Type |
Variable Name |
Symbol |
Definition |
|
Dependent Variable |
Green Tech Innovation |
Inva |
ln(number of green invention patents filed + 1) |
|
Treatment Group |
Treat |
Equals 1 if firm is in a pilot zone province, 0 otherwise |
|
|
Independent Variable |
Policy Implementation |
Post |
Equals 1 from the policy year onward, 0 before |
|
Policy Interaction |
Treat×Post |
Interaction term of Treat and Post |
|
|
Control Variables |
Leverage Ratio |
Lev |
Total liabilities / total assets |
|
Profitability |
Roa |
Net profit / total assets |
|
|
Firm Size |
LnSize |
Natural logarithm of total assets |
|
|
Ownership Concentration |
Top1 |
Shareholding ratio of the largest shareholder (%) |
|
|
Firm Age |
LnAge |
ln(Age + 1) |
|
|
Executive Pay |
Pay |
Natural logarithm of executive compensation |
|
|
ESG Rating |
ESG |
ESG rating from Huazheng Index |
|
|
Mediating Variable |
R&D Investment |
LnRD1 |
ln(R&D expenditure / total assets) |
|
Moderating Variable |
Financing Constraint |
KZ |
KZ=-β1*CF/A+β2*Q+β3*D/A+β4*DIV/A −β5*C/A |
3.2. Data sources and processing
Data were obtained from the CNRDS and CSMAR databases, covering A-share listed companies in the NEV industry from 2012 to 2022, yielding 4,240 valid observations. The study excludes ST/PT firms, financial industry samples, and those with missing data. Continuous variables are winsorized at the 1st and 99th percentiles to control for outliers. Financial data come from CSMAR; green patents and executive compensation data are from CNRDS.
3.3. Model specification
Given the staggered implementation of the pilot zone policy in three phases (2017, 2019, and 2022), a multi-period difference-in-differences (DID) model is used to capture dynamic effects, following the methodologies of Beck et al [16].and Callaway & Sant’Anna [17]. The model is specified as:
Where: dependent variable Invai,t represents the level of green technological innovation of firm i in year t. α1 is the constant term, and β1 is the coefficient of the core explanatory variable Treat Posti,t, a dummy variable indicating whether new energy firm i is subject to the green finance reform and innovation pilot zone policy in year t. This interaction term is constructed by multiplying the treatment group dummy variable Treati with the policy timing dummy variable Postt. λj denotes the coefficients of the control variables; μi and γt represent firm fixed effects and year fixed effects, respectively; and ϵi,t is the random error term.
3.4. Descriptive statistics
Descriptive statistics (Table 2) show substantial variation in firm-level green innovation (mean = 0.3695, SD = 0.8528). The mean of the policy interaction term (Treat × Post) is 0.0116, suggesting that only a small portion of firms were affected by the policy.
|
Variable |
Description |
Obs. |
Mean |
Std. Dev. |
Max |
Min |
|
Inva |
Green Technological Innovation |
4240 |
0.3695 |
0.8528 |
4.1589 |
0 |
|
Treat×Post |
Green Finance Reform and Innovation Policy |
4240 |
0.0116 |
0.1069 |
1 |
0 |
|
lev |
Leverage Ratio |
4240 |
0.4305 |
0.1822 |
0.8540 |
0.0701 |
|
size |
Firm Size (log of total assets) |
4240 |
22.2016 |
1.2158 |
25.8591 |
19.9893 |
|
roa |
Return on Assets |
4240 |
0.0345 |
0.0562 |
0.1545 |
-0.2238 |
|
top |
Ownership Concentration |
4240 |
0.3255 |
0.1415 |
0.6962 |
0.0784 |
|
age |
Firm Age (log of years since establishment) |
4240 |
2.8550 |
0.3362 |
3.4657 |
1.7918 |
|
pay |
Executive Compensation (log) |
4240 |
15.3936 |
0.7054 |
17.3709 |
13.7418 |
|
esg |
ESG Rating |
4240 |
4.1072 |
0.9185 |
6.0000 |
1.5000 |
4. Empirical results analysis
4.1. Baseline regression results
Table 3 presents the baseline regression results. Column (1) shows that without any control variables, the coefficient of the policy interaction term Treat × Post is 0.2612 and statistically significant at the 1% level, indicating that the policy significantly improves green innovation performance. When control variables are included (column 2), the coefficient increases slightly to 0.2669 (still significant at the 1% level), suggesting that firms in the treatment group increased their green patent applications by approximately 26.69% due to the policy. This supports Hypothesis 1, confirming that the pilot zone policy, through funding support and policy signaling effects, has effectively incentivized firms to engage in green technological innovation.
|
Inva |
||
|
(1) |
(2) |
|
|
Treat×Post |
0.2612*** |
0.2669*** |
|
(0.0911) |
(0.0911) |
|
|
Control |
NO |
YES |
|
Constant |
0.3665*** |
0.1349 |
|
(0.0065) |
(0.5832) |
|
|
Firm |
YES |
YES |
|
Year |
YES |
YES |
|
N |
4240 |
4240 |
|
0.7964 |
0.7973 |
|
Note: Standard errors in parentheses. *** p < 0.01, ** p < 0.05, * p < 0.1
4.2. Parallel trend assumption
To test the parallel trend assumption, this paper adopts an event study approach following Jacobson et al [18].. As shown in Figure 1, coefficients βt for the years prior to policy implementation fluctuate around zero and are statistically insignificant, indicating that treatment and control groups followed similar pre-policy trends. Post-implementation coefficients βt show a significant upward trend, particularly in years 4 and 5 after the policy (p < 0.05), suggesting a 1–2 year lag in policy effect. These findings validate the model’s specification and support the causal interpretation of the results.

4.3. Robustness checks
4.3.1. Placebo test
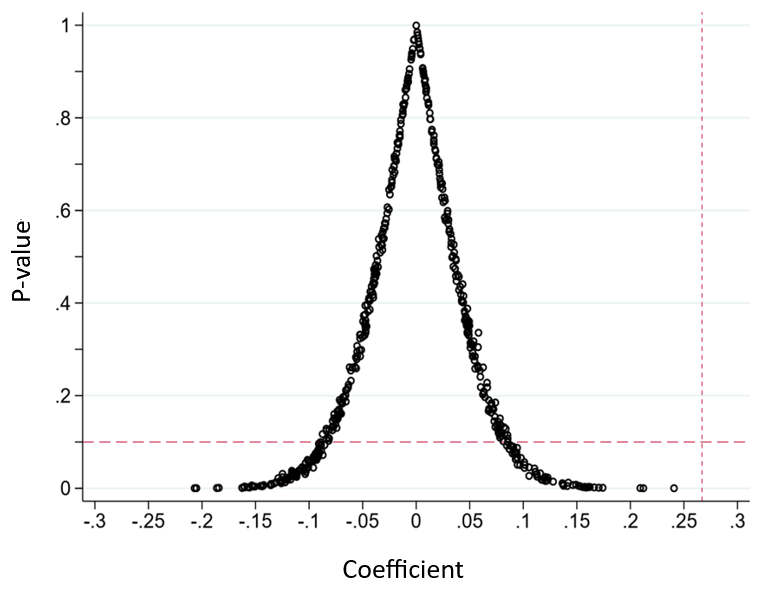
Following the methodology of Chen et al [19]. and Yang et al [20]., a placebo test was conducted by randomly assigning firms to the treatment group 500 times. Figure 2 shows that the distribution of estimated placebo effects centers around zero (mean = -0.003, SD = 0.102), with over 90% of placebo coefficients being statistically insignificant (p > 0.1). The actual policy coefficient from the baseline model (0.2669, p < 0.01) is greater than 99.6% of the placebo estimates and clearly falls outside the simulation interval. This confirms that: (1) The baseline results are not driven by unobserved confounding factors. (2) The effect of the green finance policy on green innovation is robust and causal.
4.3.2. Propensity score matching – DID (PSM-DID)
To address potential sample selection bias, the paper employs PSM-DID using two matching strategies: kernel matching and 1:10 nearest neighbor matching, using firm financial and governance characteristics as covariates. The policy coefficients under kernel and nearest-neighbor matching are 0.2696 and 0.3127 respectively (both significant at the 1% level), closely aligned with the baseline estimate (0.2669). The balance test shows standardized differences below 10%, confirming effective matching.
|
Variable |
PSM-DID |
|
|
Kernel Matching |
1:10 Nearest Neighbor |
|
|
(1) |
(2) |
|
|
Treat×post |
0.2696*** |
0.3127*** |
|
(0.0918) |
(0.1071) |
|
|
Constant |
0.2342 |
4.2308*** |
|
(0.6690) |
(1.3850) |
|
|
Controls |
YES |
YES |
|
Firm |
YES |
YES |
|
Year |
YES |
YES |
|
Industry |
NO |
NO |
|
N |
3540 |
1242 |
|
0.8081 |
0.8621 |
|
Note: *** p < 0.01, ** p < 0.05, * p < 0.1
5. Mechanism analysis and heterogeneity discussion
5.1. Mediation effect analysis
Using the mediation effect testing method proposed by Baron & Kenny [21], this section examines the mediating role of R&D investment (LnRD). The results are as follows: (1) The policy variable Treat × Post significantly promotes R&D investment (β = 0.2359, p < 0.05). After including the mediating variable, the direct effect of the policy on green patent applications drops to 0.2907 (p < 0.01), while the coefficient of LnRD is 0.0463 (p < 0.01). The Sobel test confirms the significance of the mediation effect (z = 2.32, p = 0.02), with the mediating path accounting for 15.7% of the total effect. This indicates that green finance policies enhance green innovation through a transmission mechanism of “policy incentive → R&D investment increase → green innovation.”
|
Variable |
LnRD |
Inva |
|
(1) |
(2) |
|
|
Treat×post |
0.2359** |
0.2907*** |
|
(0.0922) |
(0.0956) |
|
|
LnRD |
0.0463*** |
|
|
(0.0175) |
||
|
Constant |
-0.2091 |
0.2281 |
|
(0.5788) |
(0.6000) |
|
|
Controls |
YES |
YES |
|
Firm |
YES |
YES |
|
Year |
YES |
YES |
|
N |
4112 |
4112 |
|
0.9313 |
0.7975 |
Note: *** p < 0.01, ** p < 0.05, * p < 0.1
5.2. Moderation effect analysis
Table 6 tests the moderating role of financing constraints (KZ index). Results show: For firms with low financing constraints, the policy effect reaches 0.4785 (p < 0.01), nearly 1.8 times the baseline estimate. For firms with high financing constraints, the policy effect is insignificant (−0.2431). This suggests that financing constraints suppress the effectiveness of the policy. Firms must first alleviate funding pressures to fully benefit from green innovation incentives. Policymakers are therefore advised to supplement the policy with differentiated financial support tools to enhance overall effectiveness.
|
Variable |
High KZ (High Constraint) |
Low KZ (Low Constraint) |
|
(1) |
(2) |
|
|
Treat×post |
-0.2431 |
0.4785*** |
|
(0.1600) |
(0.1253) |
|
|
Constant |
0.7222 |
-0.7519 |
|
(0.8699) |
(1.0036) |
|
|
Controls |
YES |
YES |
|
Industry |
YES |
YES |
|
Year |
YES |
YES |
|
N |
2086 |
2082 |
|
0.8446 |
0.8090 |
Note: *** p < 0.01, ** p < 0.05, * p < 0.1
5.3. Heterogeneity analysis
Table 7 shows that the policy has significantly heterogeneous effects: For state-owned enterprises (SOEs), the policy effect is large and significant (coefficient = 1.6933, p < 0.01). For non-state-owned enterprises, the effect is not significant (−0.1188). Regionally, central and western enterprises benefit significantly (0.4429, p < 0.01), while eastern enterprises show no significant effect (−0.2734). These findings indicate that the current policy framework favors SOEs and firms in central/western regions, while offering limited support for non-SOEs and firms in more developed areas. The results suggest a need for targeted policy differentiation and improved market-based mechanisms to ensure inclusive policy effectiveness.
|
Variable |
State-Owned |
Non-State-Owned |
Eastern Region |
Central/Western Region |
|
(1) |
(2) |
(1) |
(2) |
|
|
Treat×post |
1.6933*** |
-0.1188 |
-0.2734 |
0.4429*** |
|
(0.2191) |
(0.1036) |
(0.2078) |
(0.1303) |
|
|
Constant |
3.9762** |
-1.7847*** |
-1.3893** |
3.0294** |
|
(1.6204) |
(0.6482) |
(0.6524) |
(1.3385) |
|
|
Controls |
YES |
YES |
YES |
YES |
|
Industry |
YES |
YES |
YES |
YES |
|
Year |
YES |
YES |
YES |
YES |
|
N |
925 |
3315 |
3178 |
1062 |
|
0.8446 |
0.8090 |
0.8087 |
0.7779 |
6. Conclusion and policy implications
Based on panel data from A-share listed new energy vehicle (NEV) firms in China from 2012 to 2022, this study employs a multi-period difference-in-differences (DID) model to evaluate the effect of green finance reform and innovation pilot zone policies. The results indicate that the policy significantly increases the number of green invention patent applications by 26.12%, and the findings remain robust after conducting parallel trend tests, placebo tests, and PSM-DID matching. The mechanism analysis reveals that R&D investment plays a significant mediating role in the policy’s effect on green innovation, while financing constraints have a negative moderating effect—firms with stronger financing capabilities are better able to translate policy incentives into innovation outcomes. The heterogeneity analysis further indicates that state-owned enterprises and enterprises in central and western regions benefit more from the policy, whereas the effects on non-state-owned and eastern region enterprises are limited.
Based on these findings, this study puts forward the following policy recommendations: (1) Optimize Green Finance Policy Tools: Develop more targeted financial instruments—such as dedicated green credit lines and green bonds—for non-state-owned enterprises, which often face financing difficulties. These tools can help lower financing costs and stimulate green innovation among these firms. (2) Improve the Financial Market Support System: Establish mechanisms such as policy-based loan guarantees and green finance risk compensation systems to alleviate financing constraints and enhance the overall effectiveness of green finance policies. (3) Implement Regionally Differentiated Support Strategies: Tailor policy implementation to regional economic, industrial, and financial characteristics. Special attention should be given to increasing financial support for central and western regions to promote more balanced regional development in green technological innovation.
The limitation of the study is that the sample only covers listed companies, which may underestimate the policy universality. Future research should be extended to non-listed firms and dynamic game models should be introduced to analyze the technology diffusion effect.
References
[1]. Chen, X., et al. (2023). The impact of green finance reform and innovation pilot zones on green innovation of new energy enterprises. Journal of Sustainable Finance & Investment, 13(2), 123-145.
[2]. Zhang, L. (2022). Green finance policy and financing constraints of new energy enterprises. Energy Policy, 168, 112789.
[3]. International Energy Agency (IEA). (2023). Green Finance and Innovation in the Energy Sector. Paris: IEA. pp. 45-67.
[4]. Liu, Y., et al. (2024). Policy signal effect and green innovation: Evidence from China's new energy sector. Journal of Cleaner Production, 367, 122678.
[5]. Li, H., & Zhou, L. (2022). Policy tools and green innovation: The role of R&D investment. Environmental Science & Policy, 135, 111-125.
[6]. Chen, X., et al. (2024). The role of collaborative innovation networks in green technology breakthroughs. Research Policy, 53(4), 789-805.
[7]. Wang, S., et al. (2023). Social capital and green innovation: The mediating role of R&D investment. Technological Forecasting and Social Change, 185, 1-15.
[8]. Zhang, L., & Wang, S. (2023). Innovative financing tools for green projects. Journal of Environmental Economics and Management, 112, 102567.
[9]. Liu, Y., et al. (2022). Green certification and financing conditions of new energy enterprises. Journal of Cleaner Production, 346, 131045.
[10]. Chen, X., & Li, H. (2024). Risk-sharing mechanisms in green finance. Energy Economics, 101, 105789.
[11]. Organisation for Economic Co-operation and Development (OECD). (2023). Green Finance and Innovation in Technology-Intensive Industries. Paris: OECD. pp. 78-90.
[12]. Hall, B. H., Jaffe, A. B., & Tratjman, M. (2005). Exploring the patent-value relationship. RAND Journal of Economics, 36(4), 757-788.
[13]. Cohen, W. M., Goto, A., Nagata, A., & Nishimura, J. (2020). R&D Capital, Stock Market Valuation and the 2008-2009 Financial Crisis. Journal of Financial and Quantitative Analysis, 55(2), 597-621.
[14]. You, L. (2022). Green finance and corporate green technological innovation: Empirical evidence from the Green Finance Reform and Innovation Pilot Zone. Finance and Economy, (10), 73–83.
[15]. Kaplan, S. N., & Zingales, L. (1997). Do investment-cash flow sensitivities provide useful measures of financing constraints? The Quarterly Journal of Economics, 112(2), 169-215.
[16]. Beck, S., Fiedler, M., & Gassebner, M. (2010). Who benefits from democratic institutions? Estimating the impact of regime type on growth and development. Journal of Development Economics, 93(1), 121-130.
[17]. Callaway, B., & Sant’Anna, P. H. C. (2021). Difference-in-differences with multiple time periods. Journal of Econometrics, 225(2), 254-277.
[18]. Jacobson, Louis S., et al. Earnings Losses of Displaced Workers. American Economic Review, vol. 83, no. 4, 1993, pp. 685-709.
[19]. Chen, Zheng, et al. Do Carbon Emission Trading Schemes Stimulate Green Innovation in Enterprises? Evidence from China. Technological Forecasting and Social Change, vol. 168, 2021, p. 120744.
[20]. Yang, Q., Gao, D., Song, D., et al. Environmental Regulation, Pollution Reduction and Green Innovation: The Case of the Chinese Water Ecological Civilization City Pilot Policy. Economic Systems, 2021, 45(4): 100911.
[21]. Baron, R. M., & Kenny, D. A. (1986). The moderator-mediator variable distinction in social psychological research: Conceptual, strategic, and statistical considerations. Journal of Personality and Social Psychology, 51(6), 1173-1182.
Cite this article
Liu,X. (2025). The Impact of Green Finance Reform and Innovation Pilot Zone Policies on Green Technological Innovation in the New Energy Vehicle Industry. Advances in Economics, Management and Political Sciences,197,15-26.
Data availability
The datasets used and/or analyzed during the current study will be available from the authors upon reasonable request.
Disclaimer/Publisher's Note
The statements, opinions and data contained in all publications are solely those of the individual author(s) and contributor(s) and not of EWA Publishing and/or the editor(s). EWA Publishing and/or the editor(s) disclaim responsibility for any injury to people or property resulting from any ideas, methods, instructions or products referred to in the content.
About volume
Volume title: Proceedings of the 9th International Conference on Economic Management and Green Development
© 2024 by the author(s). Licensee EWA Publishing, Oxford, UK. This article is an open access article distributed under the terms and
conditions of the Creative Commons Attribution (CC BY) license. Authors who
publish this series agree to the following terms:
1. Authors retain copyright and grant the series right of first publication with the work simultaneously licensed under a Creative Commons
Attribution License that allows others to share the work with an acknowledgment of the work's authorship and initial publication in this
series.
2. Authors are able to enter into separate, additional contractual arrangements for the non-exclusive distribution of the series's published
version of the work (e.g., post it to an institutional repository or publish it in a book), with an acknowledgment of its initial
publication in this series.
3. Authors are permitted and encouraged to post their work online (e.g., in institutional repositories or on their website) prior to and
during the submission process, as it can lead to productive exchanges, as well as earlier and greater citation of published work (See
Open access policy for details).
References
[1]. Chen, X., et al. (2023). The impact of green finance reform and innovation pilot zones on green innovation of new energy enterprises. Journal of Sustainable Finance & Investment, 13(2), 123-145.
[2]. Zhang, L. (2022). Green finance policy and financing constraints of new energy enterprises. Energy Policy, 168, 112789.
[3]. International Energy Agency (IEA). (2023). Green Finance and Innovation in the Energy Sector. Paris: IEA. pp. 45-67.
[4]. Liu, Y., et al. (2024). Policy signal effect and green innovation: Evidence from China's new energy sector. Journal of Cleaner Production, 367, 122678.
[5]. Li, H., & Zhou, L. (2022). Policy tools and green innovation: The role of R&D investment. Environmental Science & Policy, 135, 111-125.
[6]. Chen, X., et al. (2024). The role of collaborative innovation networks in green technology breakthroughs. Research Policy, 53(4), 789-805.
[7]. Wang, S., et al. (2023). Social capital and green innovation: The mediating role of R&D investment. Technological Forecasting and Social Change, 185, 1-15.
[8]. Zhang, L., & Wang, S. (2023). Innovative financing tools for green projects. Journal of Environmental Economics and Management, 112, 102567.
[9]. Liu, Y., et al. (2022). Green certification and financing conditions of new energy enterprises. Journal of Cleaner Production, 346, 131045.
[10]. Chen, X., & Li, H. (2024). Risk-sharing mechanisms in green finance. Energy Economics, 101, 105789.
[11]. Organisation for Economic Co-operation and Development (OECD). (2023). Green Finance and Innovation in Technology-Intensive Industries. Paris: OECD. pp. 78-90.
[12]. Hall, B. H., Jaffe, A. B., & Tratjman, M. (2005). Exploring the patent-value relationship. RAND Journal of Economics, 36(4), 757-788.
[13]. Cohen, W. M., Goto, A., Nagata, A., & Nishimura, J. (2020). R&D Capital, Stock Market Valuation and the 2008-2009 Financial Crisis. Journal of Financial and Quantitative Analysis, 55(2), 597-621.
[14]. You, L. (2022). Green finance and corporate green technological innovation: Empirical evidence from the Green Finance Reform and Innovation Pilot Zone. Finance and Economy, (10), 73–83.
[15]. Kaplan, S. N., & Zingales, L. (1997). Do investment-cash flow sensitivities provide useful measures of financing constraints? The Quarterly Journal of Economics, 112(2), 169-215.
[16]. Beck, S., Fiedler, M., & Gassebner, M. (2010). Who benefits from democratic institutions? Estimating the impact of regime type on growth and development. Journal of Development Economics, 93(1), 121-130.
[17]. Callaway, B., & Sant’Anna, P. H. C. (2021). Difference-in-differences with multiple time periods. Journal of Econometrics, 225(2), 254-277.
[18]. Jacobson, Louis S., et al. Earnings Losses of Displaced Workers. American Economic Review, vol. 83, no. 4, 1993, pp. 685-709.
[19]. Chen, Zheng, et al. Do Carbon Emission Trading Schemes Stimulate Green Innovation in Enterprises? Evidence from China. Technological Forecasting and Social Change, vol. 168, 2021, p. 120744.
[20]. Yang, Q., Gao, D., Song, D., et al. Environmental Regulation, Pollution Reduction and Green Innovation: The Case of the Chinese Water Ecological Civilization City Pilot Policy. Economic Systems, 2021, 45(4): 100911.
[21]. Baron, R. M., & Kenny, D. A. (1986). The moderator-mediator variable distinction in social psychological research: Conceptual, strategic, and statistical considerations. Journal of Personality and Social Psychology, 51(6), 1173-1182.