


1. Introduction
In recent years, air pollution is one of China's most pressing public health issues. According to World Health Organization (WHO), air pollution causes about 2 million deaths per year in China. But China contributes as much as possible to the fight against air pollution. According to China Environmental News, major breakthroughs have been achieved in the control of sulfur dioxide and PM2.5 pollution, while the overall emissions of particulate matter are effectively managed.
However, according to Ying Zhu, some policies that promote economic development may have negative influences on air quality. Environmental pollution may arise from the significant land development and mineral resource extraction associated with large-scale infrastructure development. Thus, China appears to be primarily focused on promoting economic development while looking for economic forms that have less of an influence on air quality.
The digital economy will be the main economic form for future economic development. The big data sector has progressively become a new growth point in the national economy. The demand for digital transformation and applications in different sectors has expanded greatly with the evolution of digital technology, and digital centres have become an important new type of infrastructure. The big data industry with high value-added helps to change the industrial structure of the market, which helps to mitigate the issue of air pollution caused by economic growth. The Big Data Pilot Zone was established on October 8, 2016, with the aim of this reason.
This paper focuses on NOx emissions from the Big Data Pilot Zone (BDPZ). It is exactly to build data centers to satisfy the needs of sustainable development, thereby balancing supply and demand. Meanwhile, the BDPZ policy operates as a catalyst for the growth of the digital economy. Its building emphasizes digital industrialization and industrial digitization together with technical upgrades [1]. With these considerations, this paper uses the BDPZ to represent the expansion of the digital economy. Previous research has shown a link between it and air quality [2]. According to Zhang & Ran [1], it has been found that there is a beneficial effect. But they did not consider NOX. Recent years have seen a sharp increase in NOx emissions due to China's rapidly increasing energy consumption and motor vehicle ownership. Consequently, the purpose of this article is to focus research on NOx emissions.
2. Background
Various metrics have been employed to define the digital economy as a burgeoning economy in the last decade or so. There are generally two categories for the digital economy: First, The Information Technology (IT) sector, which offers essential digital services and products, theoretical framework and hypothesis is the cornerstone of the digital economy [3]. Second, the information and communication sector is vital for enhancing the organization and effectiveness of the tangible economy through its contributions to industry, agriculture, and services. However, the most important goal is to facilitate the development of society, regardless of the specific metrics used to quantify its impact [4].
On October 8, 2016, the Chinese government pledged to support seven zones to build BDPZ. The construction of this experimental zone has directly or indirectly pulled high-end information industry investment of more than 50 billion yuan. The first phase of the Beijing-Tianjin-Hebei Big Data Industry Cooperative Development Investment Fund plans to raise 10 billion yuan to boost industries in the Beijing-Tianjin-Hebei region by supporting mergers and acquisitions of listed companies and equity investments in big data and related fields. The fund also works with industrial capital and financial institutions on green innovation at the project end, driving 40 billion yuan in social investment and encouraging the improvement of air quality.
3. Literature review
Although the findings of earlier studies by academics on the effect are usually negative, the indicators and the degrees of data collecting define the differences. (1) According to Zhou, J., Lan, H., Zhao, C’s study [5], analysing province-level data in China, it found that there is a beneficial effect in reducing smog. They also found that by altering the energy composition and enhancing innovation, it is possible to effectively mitigate the deterioration of haze pollution, particularly by decreasing the levels of particulate matter concentration. (2) Research conducted by Che and Wang [6] reveals that the development of the digital economy has a notable and adverse impact on haze pollution, specifically in terms of reducing PM2.5 emissions in Chinese cities. (3) Using city-level data, Zhang and Ran [1] conducted a study that revealed the notable passive effects of the digital economy on CO2, SO2 and industrial dust.
While numerous academic studies have concluded a negative effect, only a limited number of scholars have specifically considered NOx emissions as a relevant indicator for assessing air pollution. Therefore, this research specifically focuses on the emission of NOx.
4. Hypothesis
Considering the aforementioned arguments, assumptions are as follows:
H1: The digital economy has a negative impact on NOx emissions.
H2: The detrimental impact of the digital economy on air pollution differs depending on the location.
5. Data
5.1. Variable description
5.1.1. Explained variable
Annual NOx emissions are explained as variable. Since considering that not many previous studies have used NOx emissions as a measure of air pollution, and more often PM2.5 [5] [6] and sulphur dioxide as well as industrial dust [1] are used as air indicators, we then used NOx emissions as a measure of air pollution. We collected data on annual NOx emissions for each province from 2010 to 2022, in units of 10,000 tons per.
5.1.2. Explanatory variable
(1) Treat = 1 signifies the provinces and cities that implemented the Big Data Pilot Zone(BDPZ), including Beijing, Guangdong, Guizhou, Hebei, Henan, Liaoning, Inner Mongolia, Shanghai, Tianjin, and Chongqing. With the exception of Tibet, Hong Kong, and Taiwan, treat = 0 denotes the provinces and cities that did not apply the Big Data Pilot Zone.
(2) Time virtual variable: the time before and after the implementation of the BDPZ: Post = 1 refers to the Big Data Pilot Zone from 2016 to 2022. Post = 0 refers to the absence of the BDPZ from 2010 to 2015.
(3) The BDPZ's effect on lowering NOx emissions can be determined by using the Difference-in-Differences estimator (did=treat*post).
5.1.3. Control variable
In addition to the above variables, the following control variables were rigorously selected because other factors may interfere with the experimental results, especially the industrial emission factor:
(1) NOx emissions per unit of industrial added value (X1, measured in units of one ton)
(2) Number of patents for green manufacturing inventions (X2, referring to Hsu et al [7].)
(3) Actual utilization of foreign investment (X3, referring to Jiang et al [8]., measured in units of one billion yuan)
(4) Investment in industrial pollution control (X4, measured in units of one million yuan)
5.2. Data collection
|
VarName |
Obs |
Mean |
SD |
Median |
Max |
Min |
|
|
NE |
372 |
51.5196 |
38.6080 |
41.9900 |
180.1100 |
3.4100 |
|
|
X1 |
NOx emissions per unit of industrial added value |
341 |
153.4673 |
230.5826 |
88.2980 |
2040.5056 |
6.3061 |
|
X2 |
patents for green manufacturing inventions |
341 |
8499.3607 |
1.57e+04 |
3131.0000 |
1.27e+05 |
1.0000 |
|
X3 |
Actual utilization of foreign investment (billion) |
341 |
6446.3422 |
9543.3746 |
2788.8300 |
4.89e+04 |
7.8500 |
|
X4 |
Investment in industrial pollution control (million yuan) |
339 |
2.03e+05 |
1.97e+05 |
1.47e+05 |
1.33e+06 |
476.0000 |
Source: China Science and Technology Statistical Yearbook, China Environmental Statistical Yearbook, China Energy Statistical Yearbook, China Industrial Statistical Yearbook, China Statistical Yearbook and Provincial Statistical Yearbooks
Table 1 shows provincial-level data, selects 2010-2022 as the observation period, and empirically analyses the data of 31 provinces as well as Beijing, Tianjin, Chongqing and Shanghai.
6. Methodology
The research will use the DID model, because it is used to more accurately analyse the effects of the Zone, as well as the distinct impacts of the Zone on different regions.
This paper will use the following formula to analyse the data.
Where
7. Result
|
VAR |
Without control variables |
With control variables |
|
did |
-11.0449*** |
-9.8167*** |
|
(2.9078) |
(2.8547) |
|
|
X1 |
-0.0022 |
|
|
(0.0036) |
||
|
X2 |
-0.0001 |
|
|
(0.0002) |
||
|
X3 |
-0.0025** |
|
|
(0.0010) |
||
|
X4 |
0.0000 |
|
|
(0.0000) |
||
|
Constant |
53.5979*** |
74.5758*** |
|
(0.8650) |
(5.6380) |
|
|
Observations |
309 |
309 |
|
R-squared |
0.901 |
0.929 |
|
Code |
Yes |
Yes |
|
Year |
Yes |
Yes |
Standard errors in parentheses
*** p<0.01, ** p<0.05, * p<0.1
Table 2 shows the regression results of the DID model, the second column shows the case without control variables and the third column shows the case with control variables.
Base on the third column, a negative coefficient of -9.8167 indicates that after controlling for the other variables, the mean outcome for the treatment group (implement the Big Data Pilot Zone) relative to the control group (no implement the Big Data Pilot Zone) decreased by 9.8167 units.
In addition, comparing with the second column, observing the coefficients of did and R-squared, the result shows that adding control variables is rigorous.
The table indicates that the fixed effects of code and year are included, which means that the model controls for the fixed effects of code and year, thus reducing bias due to omitted variables.
In summary, the did variable has a strictly negative effect on the NOX emissions, while some other variables in the model (e.g., X4) also have a strong effect on the NOX emissions. The model fit is high and the results have strong explanatory power. This also shows that the hypothesis H1 holds.
8. Robustness check
8.1. Parallel trend hypothesis test
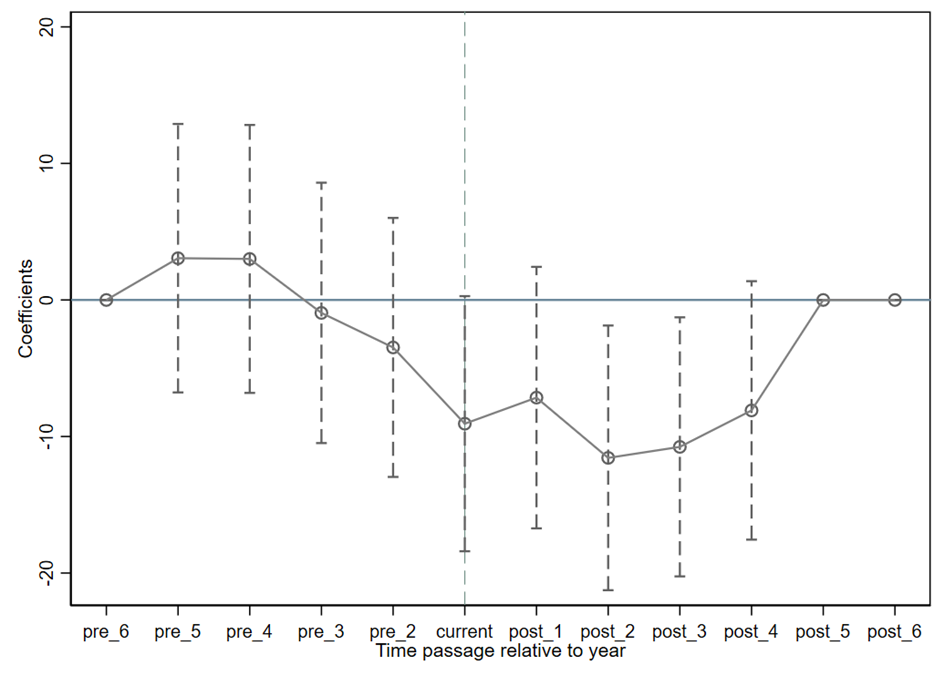
To more accurately assess how NOx emissions are affected by the digital economy, we removed the previous period's data (2015) to improve the accuracy of the parallel trend test.
Figure 1 shows that from "pre_6" to "pre_2", the estimated coefficients are mostly close to zero and the confidence intervals cross the zero line. This suggests that prior to the intervention, the trends for the group that adopted the BDPZ and the group that did not adopt the BDPZ were relatively parallel and not significantly different. At the "current" point, the estimated coefficient is zero, which is consistent with the assumption of a parallel trend, i.e., there is no notable disparity between the two groups at the time of the intervention.
From "post_1" to "post_6", the estimated coefficients are significantly negative, especially from "post_1" to "post_3". From "post_1" to "post_6", the estimated coefficients are significantly negative, especially from "post_1" to "post_3", showing that, in comparison to the control group, the post-intervention treatment group has undergone a markedly negative shift. After "post_4", the trend gradually picks up and converges to zero.
Overall, the graph supports the validity of using the DID model through the parallel trend test, and the intervention had a significant effect on the treatment group.
8.2. Placebo test
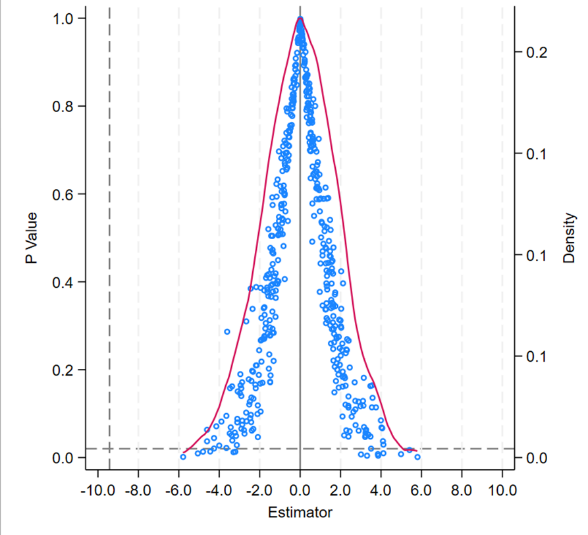
Figure 2 shows that the estimates are mostly concentrated around zero and show a symmetrical bell-shaped distribution. This indicates that in the absence of actual treatment effects, the distribution of estimates is uniform.
Figure 2 shows that most of the estimates have confidence intervals that span the zero line, further demonstrating that in the absence of an actual treatment effect, the estimates are mostly insignificant.
In order to provide a sufficient sample size to assess the distribution of the estimates. This placebo test was repeated 500 times and when compared to the actual regression results (coefficient of -9.8167 for the did variable), it can be seen that the actual results are significantly off from zero and at a high level of significance, which suggests that the actual treatment effect is real and not due to chance or due to other factors.
8.3. Heterogeneity analysis
To determine whether the outcomes of the benchmarking analysis are varied among areas in China. We employ grouped regression methods to perform relevant checks against the benchmark model. The regional distribution is usually subdivided into West (Chongqing, Shanxi, Shaanxi, Sichuan, Gansu, Guizhou, Ningxia, Qinghai, Tibet, Xinjiang and Yunnan), Central (Hunan, Liaoning, Jilin, Anhui, Henan, Heilongjiang, Mongolia Dalam, Hubei and Jiangxi) and East (Hainan, Shandong, Fujian, Tianjin, Guangdong, Guangxi, Zhejiang, Hebei, Jiangsu, Beijing and Shanghai).
|
West |
Central |
East |
|
|
VARIABLES |
NE |
NE |
NE |
|
did |
4.9949 |
-35.4473*** |
0.7143 |
|
(4.5868) |
(4.8784) |
(4.6945) |
|
|
X1 |
-0.0010 |
-0.0020 |
-0.0028 |
|
(0.0054) |
(0.0054) |
(0.0081) |
|
|
X2 |
0.0032* |
0.0003 |
-0.0004 |
|
(0.0017) |
(0.0005) |
(0.0002) |
|
|
X3 |
-0.0119** |
-0.0033 |
-0.0016 |
|
(0.0046) |
(0.0026) |
(0.0013) |
|
|
X4 |
0.0000 |
0.0000 |
0.0000 |
|
(0.0000) |
(0.0000) |
(0.0000) |
|
|
Constant |
46.2602*** |
82.6269*** |
91.5014*** |
|
(3.9056) |
(8.2543) |
(16.2528) |
|
|
Observations |
109 |
90 |
110 |
|
R-squared |
0.9115 |
0.929 |
0.955 |
|
Code |
Yes |
Yes |
Yes |
|
Year |
Yes |
Yes |
Yes |
Standard errors in parentheses
*** p<0.01, ** p<0.05, * p<0.1
Research needs to focus on the coefficients and significance of did variables. Table 3 shows that the did coefficient for the western and eastern regions is positive but not noteworthy, reflecting the fact that NOx emissions have been exacerbated, which may be due to the variations in the degree of economic development, the effectiveness of policy execution, or other external factors. The did coefficients for the central regions are negative and significant, indicating that NOx emissions can be reduce. This also proves that hypothesis H2 holds.
9. Conclusion
9.1. Summary
With the continuous growth of China's NOX emissions, the research studied the impact of China's digital economy development on NOX emissions through the BDPZ. Aimed to provide some inspiration for China on how to balance economic development with pollution control.
This study builds a difference-in-difference model, using provincial data of China from 2010 to 2022 and derives the following findings: First, the development of the digital economy can effectively cut NOx emissions, hence improving air quality. Secondly, through the heterogeneity analysis, this paper found that the policy had no significant impact on the emission of NOX in western and eastern China, while the impact was significant in central China.
9.2. Possible limitations
This study only collected interannual data in China and did not include more countries in the sample. Therefore, it is not possible to generalize the empirical conclusions to a global scale, and it is not clear whether similar policies would apply to other countries with similar macroeconomic characteristics to China. In addition, this study did not incorporate the spatial spillover effect into the empirical process.
9.3. Research implications
This paper provides some policy implications for air quality in China. The coordination between the digital economy and environmental governance should be promoted to improve air quality along with economic development. The government ought to enact pertinent legislation to promote the growth of the digital economy and expedite the digitization process in order to lower air pollution emissions.
Acknowledgments
Pei Wang and Yi Zhou contributed equally to this work and should be considered co-first authors.
References
[1]. Zhang, Y., & Ran, C. (2023). Effect of digital economy on air pollution in China? New evidence from the “National Big Data Comprehensive Pilot Area” policy. Economic Analysis and Policy, 79, 986-1004.2
[2]. Wu, L., Wan, X., Jahangir, A., Li, M., Murshed, M., & Balsalobre-Lorente, D. (2023). Does the digital economy reduce air pollution in China? A perspective from industrial agglomeration. Energy Reports, 9, 3625-3641.
[3]. Williams, L. D. (2021). Concepts of Digital Economy and Industry 4.0 in Intelligent and Information Systems. International Journal of Intelligent Networks, 2, 122-129.
[4]. Peña-López, I. (2015). OECD Digital Economy Outlook 2015.
[5]. Zhou, J., Lan, H., Zhao, C., & Zhou, J. (2021). Haze pollution levels, spatial spillover influence, and impacts of the digital economy: empirical evidence from China. Sustainability, 13(16), 9076.
[6]. Che, S., & Wang, J. (2022). Digital economy development and haze pollution: Evidence from China. Environmental Science and Pollution Research, 29(48), 73210-73226.
[7]. Hsu, P. H., Tian, X., & Xu, Y. (2014). Financial development and innovation: Cross-country evidence. Journal of financial economics, 112(1), 116-135.
[8]. Jiang, L., Zhou, H., & Bai, L. (2018). Spatial heterogeneity analysis of impacts of foreign direct investment on air pollution: Empirical evidence from 150 cities in China based on AQI. Sci. Geogr. Sin, 38, 351-360.
Cite this article
Wang,P.;Zhou,Y. (2025). Can the Growth of the Digital Economy Reduce Nox Emissions? Evidence from the Big Data Pilot Zone. Advances in Economics, Management and Political Sciences,198,108-116.
Data availability
The datasets used and/or analyzed during the current study will be available from the authors upon reasonable request.
Disclaimer/Publisher's Note
The statements, opinions and data contained in all publications are solely those of the individual author(s) and contributor(s) and not of EWA Publishing and/or the editor(s). EWA Publishing and/or the editor(s) disclaim responsibility for any injury to people or property resulting from any ideas, methods, instructions or products referred to in the content.
About volume
Volume title: Proceedings of the 3rd International Conference on Financial Technology and Business Analysis
© 2024 by the author(s). Licensee EWA Publishing, Oxford, UK. This article is an open access article distributed under the terms and
conditions of the Creative Commons Attribution (CC BY) license. Authors who
publish this series agree to the following terms:
1. Authors retain copyright and grant the series right of first publication with the work simultaneously licensed under a Creative Commons
Attribution License that allows others to share the work with an acknowledgment of the work's authorship and initial publication in this
series.
2. Authors are able to enter into separate, additional contractual arrangements for the non-exclusive distribution of the series's published
version of the work (e.g., post it to an institutional repository or publish it in a book), with an acknowledgment of its initial
publication in this series.
3. Authors are permitted and encouraged to post their work online (e.g., in institutional repositories or on their website) prior to and
during the submission process, as it can lead to productive exchanges, as well as earlier and greater citation of published work (See
Open access policy for details).
References
[1]. Zhang, Y., & Ran, C. (2023). Effect of digital economy on air pollution in China? New evidence from the “National Big Data Comprehensive Pilot Area” policy. Economic Analysis and Policy, 79, 986-1004.2
[2]. Wu, L., Wan, X., Jahangir, A., Li, M., Murshed, M., & Balsalobre-Lorente, D. (2023). Does the digital economy reduce air pollution in China? A perspective from industrial agglomeration. Energy Reports, 9, 3625-3641.
[3]. Williams, L. D. (2021). Concepts of Digital Economy and Industry 4.0 in Intelligent and Information Systems. International Journal of Intelligent Networks, 2, 122-129.
[4]. Peña-López, I. (2015). OECD Digital Economy Outlook 2015.
[5]. Zhou, J., Lan, H., Zhao, C., & Zhou, J. (2021). Haze pollution levels, spatial spillover influence, and impacts of the digital economy: empirical evidence from China. Sustainability, 13(16), 9076.
[6]. Che, S., & Wang, J. (2022). Digital economy development and haze pollution: Evidence from China. Environmental Science and Pollution Research, 29(48), 73210-73226.
[7]. Hsu, P. H., Tian, X., & Xu, Y. (2014). Financial development and innovation: Cross-country evidence. Journal of financial economics, 112(1), 116-135.
[8]. Jiang, L., Zhou, H., & Bai, L. (2018). Spatial heterogeneity analysis of impacts of foreign direct investment on air pollution: Empirical evidence from 150 cities in China based on AQI. Sci. Geogr. Sin, 38, 351-360.