


1. Introduction
During the 1997 financial crisis, all Asian macroeconomic decisions revolved around three elements — independent monetary policy, exchange rate stability and capital mobility. The theory of impossible trinity shows that a country may choose to focus only on two of totally independent monetary policy, fixed exchange rate and perfect capital mobility, or simultaneously adopt a combination of intermediate degrees of all three policy goals. An increase in one trilemma variable should be balanced out by a decrease in the weighted total of the other two [1]. Countries’ policy choices before and during the financial crisis varied widely, and each country’s approach to economic recovery was different. Which of them was the most beneficial to economic recovery during the crisis? This paper argues that the policies that helped the economy recover in 1997 crisis may also have been applied to the subsequent financial crisis.
This study compares the effects of the three impossible trinity policies on GDP growth in six Asian economies from 1998 to 2007, analyzing their effects on the economic recovery following the 1997 Asian financial crisis.
In early 1990s, Asian countries have liberalized their capital accounts and reduced capital controls to attract foreign investment. Hong Kong even allowed free movement of capital and foreign exchange [2]. All the countries in the sample selected chose to peg to the U.S. dollar before crisis except Japan. This implies that most of the countries in the sample opted for free capital flows and fixed exchange rates before the 1997 financial crisis, largely abandoning independent monetary policy. Some scholars have pointed out the significant risks and instability of such a combination [3]. Aizeman and Chinn also accentuated that “greater financial openness with a low level of financial development can be volatility-increasing” [1].
After financial crisis in 1997, Asia’s policy choices had shifted markedly. Thailand, South Korea and Indonesia have abandoned their currency pegs and fixed exchange rate systems, adopting the same floating exchange rate system as Japan. This suggests that currency pegs and fixed exchange rates (perfectly stable exchange rates) appeared to be a disadvantage during 1997 Asian financial crisis. However, according to the IMF economic recovery report, exchange rate stability under floating exchange rate played a significant role in economic recovery [4]. After the three countries abandoned fixed exchange rate regimes, they all made it a priority to stabilize exchange rate fluctuations based on floating exchange rate regimes to prevent the depreciation-inflation spiral [4]. Malaysia, by contrast, has stringent capital controls, which have achieved the objective of securing monetary independence under a fixed exchange rate, allowing interest rates to decline substantially during a period of output contraction [5]. Monetary independence is seen as the key for Malaysia to overcome this difficult time. Hong Kong is the only country that has maintained absolute open capitalization and currency peg after the crisis. Traditional thoughts believed the effectiveness of capital controls which introduced on outflows at a time of crisis is limited [5]. The government is committed to maintaining the peg, which it viewed as the cornerstone of Hong Kong's financial and monetary system, and it believed has a long-run stabilizing effect on the economy [6].
In this paper, we set the three policies in the impossible trinity as three independent variables, quantize them with the relevant formula, and calculate the coefficients with dependent variable, GDP growth, separately. Related data for formulas are collected from 1998 to 2007. Thailand, Malaysia, Indonesia, South Korea, Japan, Hong Kong (China), who experienced an obvious decline on GDP during 1997-1998 are selected as sample economies. By comparing three coefficients, which policy benefited the recovery the greatest may be determined.
Out of the three, the key outcome is that exchange rate stability under a floating exchange rate regime has the strongest positive correlation with GDP growth throughout an economic recovery. In terms of time, the correlation will be significantly greater in 1998-2000 (during crisis) than in 2001-2007 (after crisis).
Section 2 describes the methodology, section 3 shows the outcomes of this paper detailedly, and section 4 interprets the results, discusses the empirical evidence on the effect of exchange rate stability on economic recovery, and suggests the implications.
2. Methodology
2.1. Samples
This study examines the impact of policy responses on economic recovery post-Asian financial crisis within the 1998-2007 timeframe, focusing on Thailand, Hong Kong, Japan, South Korea, Indonesia, and Malaysia. Each economy, uniquely positioned—Thailand as the initial crisis epicenter, Hong Kong with its currency defense, Japan's emergency banking measures, South Korea's IMF-backed reforms, Indonesia's political-economic restructuring, and Malaysia's capital controls-offers a diverse set for comparative policy analysis.
The methodology leverages GDP growth rates from the IMF to quantify recovery, applying the trilemma elements' quantification method by Aizenman, Chinn, and Ito [1], as utilized by the IMF. We incorporate control variables such as IMF aid status from the IMF reports, net exports from IMF data, and indicators from the Economic Freedom Index by Heritage Foundation/Wall Street Journal.
The 1998 trough in GDP across these economies demarcates the study's inception, with a ten-year span mitigating the 2008 crisis's influence and emphasizing the Asian financial crisis's recovery phase.
|
GDP(billion) constant 2015 USD |
Thailand |
HongKong |
Japan |
Korea, Rep. |
Indonesia |
Malaysia |
|
1997 |
219.5 |
172.82 |
3940 |
692.73 |
429.98 |
138.52 |
|
1998 |
202.74 |
162.66 |
3890 |
657.19 |
373.53 |
128.33 |
|
1999 |
212.01 |
166.73 |
3880 |
732.55 |
376.49 |
136.21 |
|
2000 |
221.45 |
179.51 |
3990 |
798.93 |
395.01 |
148.27 |
|
2001 |
229.08 |
180.52 |
4000 |
837.7 |
409.4 |
149.04 |
|
2002 |
243.17 |
183.51 |
4000 |
902.41 |
427.83 |
157.07 |
|
2003 |
260.65 |
189.12 |
4070 |
930.81 |
448.28 |
166.17 |
|
2004 |
277.04 |
205.57 |
4150 |
979.19 |
470.83 |
177.44 |
|
2005 |
288.65 |
220.76 |
4230 |
1020 |
497.63 |
186.9 |
|
2006 |
302.98 |
236.28 |
4290 |
1080 |
525.01 |
197.34 |
|
2007 |
319.45 |
251.56 |
4350 |
1140 |
558.32 |
209.77 |
2.2. Variables
2.2.1. Independent variables
(1) Monetary Policy Independence
Monetary independence, measured as the inverse of the annual correlation between a country's monthly interest rates and benchmark rates using money market data, is gauged with all calculations derived from IMF data. The index for the extent of monetary independence is defined as:
where i refers to home countries and j to the base country (USA). By construction, the maximum and minimum values are 1 and 0, respectively. Higher values of the index mean more monetary policy independence [1].
(2) Capital Mobility
We collected KAOPEN index data from 1998 to 2007 for six economies to quantify capital mobility, an indicator first presented by Chinn and Ito in 2006, which assesses capital flow openness using binary indicators from IMF reports [7].
(3) Exchange Rate Stability
Exchange rate stability is quantified by computing the annual standard deviation of the monthly exchange rate fluctuations between the home and base countries, then normalizing this measure within a zero to one range using a specific formula:
The author pointed out that an exchange rate is classified as "fixed" if its monthly fluctuation remains within a ±0.33 percent range, assigning a value of one to the index. Following this criterion, the X3 variable for Hong Kong from 1998 to 2007 and Malaysia from 1999 to 2007 is assigned a value of one [1].
2.2.2. Control variables
We identified five control variables, divided into International Factors, including IMF aid and Trade Freedom, and Net Export; and Domestic Factors, comprising Government Spending and Tax Burden.
(1) IMF aid
In examining the recovery of East Asian nations post-Asian financial crisis, the role of IMF assistance can’t be ignored. Lane noted that the IMF provided "emergency official liquidity support" to "cushion the blow of rapid capital outflows" [8]. This support aimed to stabilize financial markets and foster economic recovery through not only financial aid but also policy reforms designed to bolster macroeconomic resilience. So we determine whether an economy has accepted financial aid from the IMF by consulting the IMF's annual reports, using a dummy variable to represent this, with 1 indicating acceptance and 0 otherwise.
(2) Net Exports(GDP%)
Net exports, one of the three key drivers of economic growth along with consumption and investment, are included as a control variable in our study for their significant role. As a recovery strategy, increasing net exports can boost production and employment by expanding market share internationally. We express net exports as a percentage of GDP for a standardized comparison, adjusting for economy size. Accordingly, we've obtained GDP and net export data from the IMF and World Bank for six East Asian economies to compute this percentage.
(3) Government Spending
As demonstrated by Abrams and Wang, government spending significantly influences economic growth [9]. Therefore, we have included the government spending index from the Economic Freedom Index—a component that reflects the burden of state consumption and transfer payments—as a control variable [10]. This selection is due to its established impact on economic activity, particularly in stimulating demand during recessions and shaping aggregate demand via policy interventions.
(4) Trade Freedom
Hussain and Haque investigate the role of unconventional factors in economic growth using data from the Heritage Foundation/Wall Street Journal Economic Freedom Index. Their research uncovers a strong, positive link between trade freedom and economic growth [11]. Guided by these findings, we have selected the Trade Freedom Index, which quantifies tariff and non-tariff barriers affecting international trade, as a control variable in our study [10].
(5) Tax Burden
Tax burden is a pivotal measure of economic activity, indicating the proportion of GDP collected as tax revenue and reflecting the government's fiscal health and spending power. Given its direct influence on economic operations, we've included the tax burden indicator from the Economic Freedom Index as a control variable. This composite measure captures both personal and corporate marginal tax rates and the total tax burden as a percentage of GDP, encompassing all direct and indirect taxes levied by the government [10].
2.3. Method
To explore the relationships between the dependent variable and the independent variables, scatter plots were initially created for each pair of variables. This visualization helped to identify potential linear relationships and detect any outliers.
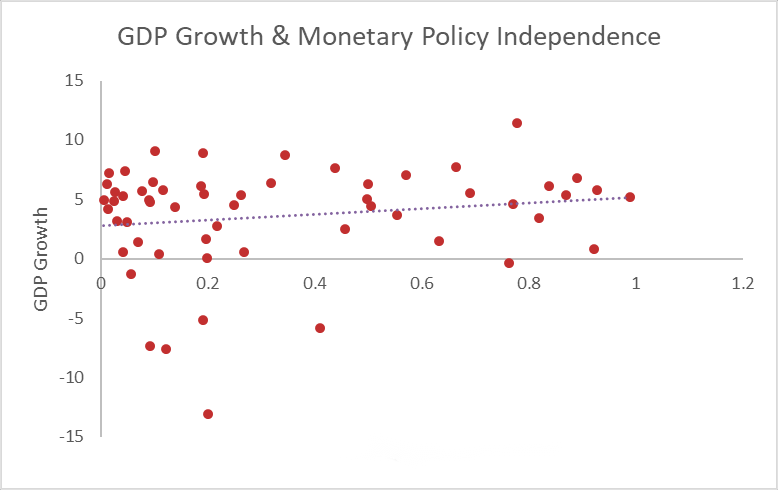


The scatter plot shows that GDP growth is most likely related to exchange rate stability among three components of the trilemma, with less correlation observed with the other two variables. We will use regression analysis to further verify the relationship between GDP growth and the three independent variables. We've also identified outliers in Figure3 with an Exchange Rate Stability value of 1. To enhance model fit, we plan to perform a regression excluding these cases.
The regression equation is specified as:
β0 is the intercept, ϵi is the error term. The explanation of the main variables is as follows.
|
Variable |
Coefficient |
Name |
Source |
|
|
dependent variable |
Y |
- |
GDP Growth |
IMF data |
|
independent variables |
X1 |
β1 |
Monetary Policy Independence |
formula(1) |
|
X2 |
β2 |
Capital Mobility |
Chinn-Ito index (KAOPEN) |
|
|
X3 |
β3 |
Exchange Rate Stability |
formula(2) |
|
|
control variables |
Z1 |
γ1 |
IMF Aid |
dummy |
|
Z2 |
γ2 |
Trade Freedom |
from Economic Freedom Index |
|
|
Z3 |
γ3 |
Net Exports (GDP%) |
(exports-imports)/GDP |
|
|
Z4 |
γ4 |
Government Spending |
from Economic Freedom Index |
|
|
Z5 |
γ5 |
Tax Burden |
from Economic Freedom Index |
3. Results
The results of the regression analysis conducted separately between GDP growth and the three elements of the Impossible Trinity—Monetary Policy Independence, Capital Mobility, and Exchange Rate Stability—are as follows:
|
Variable |
no control |
with external controls |
with domestic controls |
with all controls |
|
Exchange rate stability |
2.378 (1.948) |
3.028 (1.816) |
2.495 (1.975) |
2.957 (1.855) |
|
IMF aid |
-4.621 |
-4.332 |
||
|
Trade freedom index |
-0.027 |
0.010 |
||
|
Net export (GDP%) |
-0.091 |
-0.128 |
||
|
Government spending index |
0.005 |
-0.038 |
||
|
Tax burden index |
0.057 |
-0.027 |
||
|
R-squared |
0.026 |
0.217 |
0.041 |
0.221 |
|
P-value |
0.227 |
0.102 |
0.212 |
0.117 |
|
Observation |
60 |
60 |
60 |
60 |
Note: *, **, *** represent significance at the 10%, 5%, and 1% levels, respectively, and standard errors are in parentheses.
|
Variable |
no control |
with external controls |
with domestic controls |
with all controls |
|
Exchange rate stability |
-3.283 (2.028) |
-4.172 (3.600) |
-6.220** (2.712) |
-5.063 (4.034) |
|
IMF aid |
-4.155 |
-3.773 |
||
|
Trade freedom index |
0.064 |
0.070 |
||
|
Net export (GDP%) |
-0.054 |
-0.072 |
||
|
Government spending index |
-0.096 |
-0.066 |
||
|
Tax burden index |
0.186 |
0.046 |
||
|
R-squared |
0.043 |
0.198 |
0.102 |
0.208 |
|
P-value |
0.111 |
0.252 |
0.026 |
0.215 |
|
Observation |
60 |
60 |
60 |
60 |
Note: *, **, *** represent significance at the 10%, 5%, and 1% levels, respectively, and standard errors are in parentheses.
|
Variable |
no control |
with external controls |
with domestic controls |
with all controls |
|
Exchange rate stability |
7.484*** (2.028) |
8.508*** (3.082) |
12.286*** (2.734) |
11.166*** (3.489) |
|
IMF aid |
-1.578 |
-0.348 |
||
|
Trade freedom index |
-0.162 |
0.010 |
||
|
Net export (GDP%) |
-0.010 |
-0.102 |
||
|
Government spending index |
0.100 |
0.004 |
||
|
Tax burden index |
-0.248 |
-0.252 |
||
|
R-squared |
0.190 |
0.279 |
0.278 |
0.316 |
|
P-value |
0.0005 |
0.0078 |
0.0000 |
0.0023 |
|
Observation |
60 |
60 |
60 |
60 |
Note: *, **, *** represent significance at the 10%, 5%, and 1% levels, respectively, and standard errors are in parentheses.
The above tables summarize the 1998-2007 regression analysis between the Impossible Trinity's elements and GDP growth, revealing a significant positive link solely between Exchange Rate Stability and economic growth. This finding underscores the potential economic benefits of maintaining exchange rate stability for spurring GDP growth.
We focus on the p-value for statistical significance and the R-squared for variance predictability in our regression results. Noting the low R-squared, we aim to refine model fit by closely examining the years, which should better reflect economic recovery nuances and boost accuracy.
|
GDP(billion) constant 2015 USD |
Thailand |
HongKong |
Japan |
Korea, Rep. |
Indonesia |
Malaysia |
|
1997 |
219.5 |
172.82 |
3940 |
692.73 |
429.98 |
138.52 |
|
1998 |
202.74 |
162.66 |
3890 |
657.19 |
373.53 |
128.33 |
|
1999 |
212.01 |
166.73 |
3880 |
732.55 |
376.49 |
136.21 |
|
2000 |
221.45 |
179.51 |
3990 |
798.93 |
395.01 |
148.27 |
|
2001 |
229.08 |
180.52 |
4000 |
837.7 |
409.4 |
149.04 |
|
2002 |
243.17 |
183.51 |
4000 |
902.41 |
427.83 |
157.07 |
|
2003 |
260.65 |
189.12 |
4070 |
930.81 |
448.28 |
166.17 |
|
2004 |
277.04 |
205.57 |
4150 |
979.19 |
470.83 |
177.44 |
|
2005 |
288.65 |
220.76 |
4230 |
1020 |
497.63 |
186.9 |
|
2006 |
302.98 |
236.28 |
4290 |
1080 |
525.01 |
197.34 |
|
2007 |
319.45 |
251.56 |
4350 |
1140 |
558.32 |
209.77 |
By examining the aggregate GDP data of the six economies from 1998 to 2007, we have categorized the period into two distinct phases. The first phase, from 1998 to 2000, is a group that primarily reflects the impact of the Asian financial crisis. The primary consideration is that by the year 2000, the total GDP of the six economies had largely returned to the levels of 1997. The second phase, spanning from 2001 to 2007, represents another group, during which we believe these six economies have largely emerged from the turmoil of the crisis. This bifurcation allows for a more focused analysis of the economic consequences immediately following the crisis and the subsequent recovery period.
|
Variable |
1998-2007 |
1998-2000 |
2001-2007 |
|
Monetary Independence |
2.957 (1.855) |
8.942 (6.191) |
1.624 (1.060) |
|
R-squared |
0.221 |
0.394 |
0.350 |
|
Capital Mobility |
-5.063 (4.034) |
-15.175 (12.150) |
-2.833 (2.499) |
|
R-squared |
0.208 |
0.208 |
0.384 |
|
Exchange Rate Stability |
11.166*** (3.490) |
21.487** (9.218) |
3.045 (3.060) |
|
R-squared |
0.316 |
0.517 |
0.379 |
Note: *, **, *** represent significance at the 10%, 5%, and 1% levels, respectively, and standard errors are in parentheses.
The segmented regression data provided clearer results, showing a more significant positive correlation between Exchange Rate Stability and GDP growth during the 1998-2000 Asian financial crisis, with a higher R-squared value. Since the previous scatter plot identified outliers due to some economies with a fixed exchange rate regime, where X3 was assigned a value of 1, we considered excluding these economies from the regression analysis of Y with X3 to further enhance the model's fit and persuasiveness.
|
1998-2007 |
1998-2000 |
2001-2007 |
|
|
Include |
11.166*** (3.490) |
21.487** (9.218) |
3.045 (3.060) |
|
R-squared |
0.316 |
0.517 |
0.379 |
|
Exclude |
29.373*** (5.396) |
37.507** (11.306) |
0.397 (3.523) |
|
R-squared |
0.584 |
0.786 |
0.789 |
Note: *, **, *** represent significance at the 10%, 5%, and 1% levels, respectively, and standard errors are in parentheses.
After excluding the outliers, it is evident that during the period of the Asian financial crisis from 1998 to 2000, based on the Impossible Trinity, exchange rate stability made the most significant contribution to GDP growth.
4. Discussion
In this study, we have investigated which of the three elements in the impossible trinity – exchange rate stability, monetary policy independence, and capital mobility – most effectively contributed to the economic recovery of East Asian countries following the 1997 financial crisis. By employing a quantitative analysis of data from six East Asian economies (namely, South Korea, Thailand, Indonesia, Malaysia, Japan, and Hong Kong) over a ten-year period from 1998 to 2007.
Through a variety of data research and regression model analysis. Our analysis shows that only exchange rate stability has a strong correlation with economic growth, the other variables have almost no correlation with economic growth. Meanwhile, through the integration of data and tables, we conclude that a fixed exchange rate policy is more conducive to economic development.
Most of the previous reports written by researchers mainly focused on the case analysis of some countries (such as Southeast Asian countries) in Asian financial crisis and analyzed its influencing factors. However, it rarely involves studying the impact of several factors on the economic and other practical effects of the financial crisis through a specific system or context, and thus providing enlightenment for various countries. For example, Tsangarides showed the impact of exchange rate stability on market economy and focused on different economies around the world [12]. Many researchers tend to frame the research object in a specific factor, instead of comparing the factors in a variety of factors or in a certain background, which will greatly reduce the accuracy. At the same time, the differences of national economies are not considered, and there is a lack of applicability. Our study fills a research gap well, as we examine the macro Asian financial crisis through the lens of the triad and provide robust recommendations for countries. A paper from the China Financial News shows that exchange rate stability was a stabilizer for economic growth during the Asian financial crisis [13]. Malaysia's insistence on fixed exchange rates and China's stabilization of exchange rates strongly support the effect of exchange rate stability on economic recovery. An article from cover story [14] also makes it clear that exchange rate instability has laid the potential for financial crises in Southeast Asian countries. This would also prove our hypothesis. All of these studies have a strong comparison to our final conclusions, and all show the advantages of a more stable exchange rate.
Our research clarifies the critical role of exchange rate stability in the recovery from the Asian financial crisis, particularly for trade-dependent economies. We suggest that policymakers should focus on maintaining a stable currency within a managed float regime. Future studies can extend our analysis by modeling the optimal exchange rate stability range for economic recovery.
5. Conclusion
According to the theory of impossible trinity, totally independent monetary policy, perfect capital mobility and exchange rate stability cannot be satisfied at the same time. As three essential macroeconomic policies, national choices and trade-offs have become crucial, especially in the context of the economic recovery. Based on the background of the 1997 financial crisis, Asian economies made diverse policy decisions during the economic recovery stage, which also resulted in varying recovery rates and outcomes. This paper aims to find out which of the three policies had the greatest positive impact on GDP growth during the economic recovery in 1997 and propose that this policy may be the most effective during the economic recovery.
In this paper, we quantize three policies into index and calculate the coefficients between each index and GDP growth during 1998-2007 using regression line. Five control variables are collected, including IMF aid, trade freedom index, net export (GDP %), tax burden index and government spending index. The main result is exchange rate stability under a floating exchange rate regime, which plays the biggest role during economic recovery.
There’re also questions emerging from this paper. Hong Kong (China) implemented fixed exchange rate and perfectly capital mobility throughout the ten years. Based on the theory of impossible trinity, independent monetary policy should be totally given up. However, according to the monetary independence indexes calculated, they fluctuated for ten years, some of them even above the average value among six economies. Is this because of the special constitutional nature of Hong Kong? Or is the algorithm itself limited in the selection of base countries? We leave these questions to further research.
Acknowledgement
Linling Wu and Yan Deng contributed equally to this work and should be considered co-first authors.
References
[1]. Aizenman, J., Chinn, M. D., & Ito, H. (2008). Assessing the emerging global financial architecture: Measuring the trilemma's configurations over time. National bureau of economic research.
[2]. Tsang, S. K., Sin, C. Y., & Cheng, Y. S. (1999, August). The robustness of Hong Kong's linked exchange rate system as a currency board arrangement. In 54th European Meeting of the Econometric Society, Santiago de Compostela, Spain (Vol. 29).
[3]. Aizenman, J., Ito, H. (September, 2014). The More Divergent, the Better? Lessons on Trilemma Policies and Crises for Asia. https: //direct.mit.edu/adev/article/31/2/21/9886/The-More-Divergent-the-Better-Lessons-on-Trilemma
[4]. IMF Staff. (2000) Recovery from the Asian Crisis and the Role of the IMF. https: //www.imf.org/external/np/exr/ib/2000/062300.HTM#box1
[5]. Kawai, M., & Takagi, S. (2003). Rethinking capital controls: the Malaysian experience. Macroeconomics working papers, 473.
[6]. WTO Staff. (1998). Hong Kong, China: December 1998. https: //www.wto.org/english/tratop_e/tpr_e/tp095_e.htm#top
[7]. Chinn, M. D., & Ito, H. (2023). The Chinn-Ito index: A de jure measure of financial openness. Retrieved from https: //web.pdx.edu/~ito/Chinn-Ito_website.htm
[8]. Lane, T., Ghosh, A., Hamann, A., Phillips, S., Schulze-Ghattas, M., & Tsikata, T. (1999). IMF-supported programs in Indonesia, Korea, and Thailand: A preliminary assessment. International Monetary Fund. Retrieved from https: //www.imf.org/external/pubs/ft/wp/1999/wp99138.pdf
[9]. Abrams, B. A., & Wang, S. (2007). Government Outlays, Economic Growth and Unemployment: A VAR Model. https: //www.semanticscholar.org/paper/Government-Outlays%2C-Economic-Growth-and-A-VAR-Model-Abrams-Wang/becc8462a6b1dcc2dbc866d2b82c4c15d418b845
[10]. The Heritage Foundation. (2024). Index of Economic Freedom2024. https: //www.heritage.org/index/pages/about
[11]. Hussain, M. E., & Haque, M. (2016). Impact of economic freedom on the growth rate: A panel data analysis. Economies, 4(2), 5.
[12]. Tsangarides, C. G. (2012). Crisis and recovery: Role of the exchange rate regime in emerging market economies. Journal of Macroeconomics, 34(2), 470-488.
[13]. Zuo Xiaolei.(2010-10-12). Exchange rate stability is the stabilizer of trade and economic growth. China Financial News, 008. (in Chinese)
[14]. Wen J D. (2022). Foreign exchange management to help withstand the impact of Asian Financial Crisis. China's foreign exchange (18), 26-28. Doi: 10.13539 / j.carol carroll nki. 11-5475 / f 2022.18.025. (in Chinese)
Cite this article
Wu,L.;Deng,Y.;Cheng,Z. (2025). Which Sail of the Trilemma Steered East Asian Countries Through the Storm of the Asian Financial Crisis?. Advances in Economics, Management and Political Sciences,198,97-107.
Data availability
The datasets used and/or analyzed during the current study will be available from the authors upon reasonable request.
Disclaimer/Publisher's Note
The statements, opinions and data contained in all publications are solely those of the individual author(s) and contributor(s) and not of EWA Publishing and/or the editor(s). EWA Publishing and/or the editor(s) disclaim responsibility for any injury to people or property resulting from any ideas, methods, instructions or products referred to in the content.
About volume
Volume title: Proceedings of the 3rd International Conference on Financial Technology and Business Analysis
© 2024 by the author(s). Licensee EWA Publishing, Oxford, UK. This article is an open access article distributed under the terms and
conditions of the Creative Commons Attribution (CC BY) license. Authors who
publish this series agree to the following terms:
1. Authors retain copyright and grant the series right of first publication with the work simultaneously licensed under a Creative Commons
Attribution License that allows others to share the work with an acknowledgment of the work's authorship and initial publication in this
series.
2. Authors are able to enter into separate, additional contractual arrangements for the non-exclusive distribution of the series's published
version of the work (e.g., post it to an institutional repository or publish it in a book), with an acknowledgment of its initial
publication in this series.
3. Authors are permitted and encouraged to post their work online (e.g., in institutional repositories or on their website) prior to and
during the submission process, as it can lead to productive exchanges, as well as earlier and greater citation of published work (See
Open access policy for details).
References
[1]. Aizenman, J., Chinn, M. D., & Ito, H. (2008). Assessing the emerging global financial architecture: Measuring the trilemma's configurations over time. National bureau of economic research.
[2]. Tsang, S. K., Sin, C. Y., & Cheng, Y. S. (1999, August). The robustness of Hong Kong's linked exchange rate system as a currency board arrangement. In 54th European Meeting of the Econometric Society, Santiago de Compostela, Spain (Vol. 29).
[3]. Aizenman, J., Ito, H. (September, 2014). The More Divergent, the Better? Lessons on Trilemma Policies and Crises for Asia. https: //direct.mit.edu/adev/article/31/2/21/9886/The-More-Divergent-the-Better-Lessons-on-Trilemma
[4]. IMF Staff. (2000) Recovery from the Asian Crisis and the Role of the IMF. https: //www.imf.org/external/np/exr/ib/2000/062300.HTM#box1
[5]. Kawai, M., & Takagi, S. (2003). Rethinking capital controls: the Malaysian experience. Macroeconomics working papers, 473.
[6]. WTO Staff. (1998). Hong Kong, China: December 1998. https: //www.wto.org/english/tratop_e/tpr_e/tp095_e.htm#top
[7]. Chinn, M. D., & Ito, H. (2023). The Chinn-Ito index: A de jure measure of financial openness. Retrieved from https: //web.pdx.edu/~ito/Chinn-Ito_website.htm
[8]. Lane, T., Ghosh, A., Hamann, A., Phillips, S., Schulze-Ghattas, M., & Tsikata, T. (1999). IMF-supported programs in Indonesia, Korea, and Thailand: A preliminary assessment. International Monetary Fund. Retrieved from https: //www.imf.org/external/pubs/ft/wp/1999/wp99138.pdf
[9]. Abrams, B. A., & Wang, S. (2007). Government Outlays, Economic Growth and Unemployment: A VAR Model. https: //www.semanticscholar.org/paper/Government-Outlays%2C-Economic-Growth-and-A-VAR-Model-Abrams-Wang/becc8462a6b1dcc2dbc866d2b82c4c15d418b845
[10]. The Heritage Foundation. (2024). Index of Economic Freedom2024. https: //www.heritage.org/index/pages/about
[11]. Hussain, M. E., & Haque, M. (2016). Impact of economic freedom on the growth rate: A panel data analysis. Economies, 4(2), 5.
[12]. Tsangarides, C. G. (2012). Crisis and recovery: Role of the exchange rate regime in emerging market economies. Journal of Macroeconomics, 34(2), 470-488.
[13]. Zuo Xiaolei.(2010-10-12). Exchange rate stability is the stabilizer of trade and economic growth. China Financial News, 008. (in Chinese)
[14]. Wen J D. (2022). Foreign exchange management to help withstand the impact of Asian Financial Crisis. China's foreign exchange (18), 26-28. Doi: 10.13539 / j.carol carroll nki. 11-5475 / f 2022.18.025. (in Chinese)