


1. Introduction
The "Made in China 2025" (MIC) initiative, proposed in 2015, aims to position China as a global leader in manufacturing by shifting towards innovation-based production, prioritizing quality over quantity, adopting environmentally friendly practices, and promoting sustainability. This aligns with China's economic transition, characterized by a shift towards higher-quality development and reduced dependence on traditional driving forces. Instead, the focus is on new driving forces that are directly linked to technological advancement and environmental sustainability in the process of economic growth. This strategy is specifically aimed at advancing technology in areas such as advanced information technology, robotics, aircraft, and green vehicles. It places a strong emphasis on maintaining a balance with the environment [1].
Unemployment is a significant metric that may accurately demonstrate the socio-economic consequences of industrial policies, such as MIC 2025. The employment level is an indicator of economic well-being and the effectiveness of policies in generating long-lasting work opportunities. This article examines the fluctuations in unemployment rates prior to and following the implementation of the MIC 2025 strategy in certain pilot cities. It is through a comparison of the tendencies that a picture of the ability of this strategy to bring jobs into being can be painted and its wider socio-economic effects.
Advanced econometrics techniques applied for robust analyses include a Double Machine Learning (Double ML) model and a Difference-in-Differences (DID) model. The Double ML model incorporates the Lasso algorithm for its primary and auxiliary regression, which assists in the elucidation of the causal relationships between MIC 2025 policies and the unemployment rate. Regarding high-dimensional control variables, it keeps estimation accuracy, a capability that a classic linear model cannot possess [1,2]. Additionally, the DID model enables comparing pilot and non-pilot cities, and therefore, changes in the unemployment rate can be directly associated with policies rather than external factors. The government will identify three pilot cities for MIC 2025 from its 12 cities and four city clusters list.
This study selected three non-pilot cities with similar development levels in the same province as the control group to comprehensively understand the impact of MIC 2025 on employment. This comparison will provide further evidence to support the success of the strategy in boosting employment and emphasize the varying effects in different regions.
2. Literature review
The "Made in China 2025" strategy is a significant policy initiative designed to enhance China's manufacturing industry and establish it as a global manufacturing leader. This paper uses mathematical models to determine causality and validate the findings, as well as to help readers review existing research relevant to understanding the impact of MIC 2025 on unemployment rates in pilot cities.
2.1. The impact of industrial policy on employment
Industrial policies, such as MIC 2025, aim to stimulate economic growth and the transformation of economic structures, which often have a significant impact on the labor market. At the same time, a large number of studies have explored the relationship between industrial policy and employment. For example, Li compared Germany's "Industry 4.0" with China's MIC 2025, highlighting the potential of these policies to promote innovation and increase industrial capacity, which can translate into job creation and shifts in employment patterns [3].
2.2. MIC 2025 and technology and innovation
"MIC 2025" is a strategy for technological innovation promoting manufacturing development. Technological progress usually either creates or destroys employment opportunities, depending on the nature of the technological advance and the capacity of the labor force to adapt. Xu also argued that the "MIC 2025" strategy probably helps greatly increase the green innovation capability of manufacturing enterprises. Yet, simultaneously, when industries modernize, and firms in the industry start taking up the new technology, it further leads to changes in employment [4].
2.3. Causal interpretation of dual machine learning models
Double machine learning models combined with multiple linear regression equations serve as a strong tool model useful in judging whether there is a causal relationship between policies and dependent variables. Within the Double ML framework, Chernozhukov et al. developed a formulation in blending machine learning techniques with classical econometrics in drawing conclusions about high-dimensional data while making inferences about causal effects. This allows researchers to take into account more control variables, reducing bias and increasing the strength of reliability [2].
2.4. Differences in Differences (DID) model application
The Differences-in-Differences (DID) model is widely recognized as one of the prevalent models. Cheng et al. have effectively utilized the DID model to assess the impacts of policies on urban development and economic growth, among other things. Running differences over time in the results from the treatment and control groups, it evaluates to what extent a policy affects the variable in question [5]. Consider this study. For example, the sample involves the pilot cities and the non-pilot cities located in the same province and, to a certain extent, at a similar development level with the pilot city. It will further validate the impact of the MIC 2025 strategy on unemployment. This way, an appropriate conclusion is derived by the researchers, which is highly reliable and of importance as a reference for policymakers. More widely, DID models can also be used for evaluating policies in other areas of socioeconomic policy, such as health, education, and environmental policies.
2.5. An empirical study of MIC 2025
The empirical studies on the MIC 2025 strategy have been focused on its effect in increasing innovation capacity, productivity, and green economic growth. Yuan et al. have taken in-depth strides through exploring the influence of MIC 2025 on the green economy, and as the policy is conducive towards green economic growth, still literature has not taken account of the case of the unemployment rate being affected directly by MIC Country 2025 [1]. Thus, this study provides a gap in the literature because it identifies different economic indicators and data with which to provide further elaboration of the possible influence of MIC 2025 on the unemployment rate. This will add not only a recognition of the full extent of the influence that the MIC 2025 strategy might bring but also new perspectives and evidence support for the policymakers.
2.6. Conclusion
This review underscores the necessity of a thorough empirical investigation to investigate the influence of MIC 2025 on the unemployment rate in pilot cities. By utilizing sophisticated econometric methodologies such as dual machine learning (ML), difference-in-differences (DID) models, and multiple regression equations. We can only give compelling evidence for the causal relationship between the MIC 2025 strategy and the unemployment rate if we rely solely on this foundation. This study will contribute to a deeper understanding of the employment impact of industrial policies and guide future policymaking for sustainable economic development.
3. Policy background and theoretical analysis
3.1. Policy background
The "Made in China 2025" strategy, implemented by the Chinese government in 2015, is a detailed plan aimed at propelling China to become a dominant force in manufacturing by 2025. The objective of this policy is to redirect attention from conventional manufacturing toward high-tech industries, with a particular emphasis on innovation, quality, and sustainability. The strategy focuses on ten critical sectors: advanced information technology, robotics, aerospace equipment, ocean engineering equipment, advanced rail transportation, energy-saving and new energy vehicles, power equipment, agricultural machinery, new materials, biopharmaceuticals, and high-performance medical devices [6].
Some of the challenges that have faced the manufacturing industry in China and initiated the formulation of the MIC 2025 strategy include low value-added production, dependence on foreign technology, and environmental degradation. The policy is meant to help in enhancing global competitiveness for China through technological advancement and industrial upgrades, while at the same time realizing a low level of dependency on foreign technology. Furthermore, the strategy aims to promote a more equitable and enduring economic expansion that takes into account environmental concerns and the efficient use of resources.
Pilot cities were selected to implement the MIC 2025 strategy based on their industrial bases, innovation potential, and readiness to adopt advanced technologies. These cities were provided with focused assistance in the form of subsidies, tax incentives, and infrastructure expenditures to promote innovation and facilitate economic change. The policy also demanded strong cooperation among governments, industries, and academia in a collective pursuit of technological breakthroughs and findings commercialization through research.
3.2. Theoretical analysis
Several key concepts of industrial policies and labor economics take the ground stage in deriving the theoretical framework supporting the consequence of the MIC 2025 strategy for the unemployment rate in pilot cities. The policy of MIC 2025 is based on innovation and technological advancement; It relies on exceptional human resources, leading in scientific and technological innovation.
It has given impetus to the pilot cities for cultivating and attracting human resources to build a stable workforce that supports technological innovation, transforms and upgrades manufacturing industries, and promotes urban development. In this way, innovation could stimulate the rise of new sectors along with the increase in the size and scale of existing ones, which might be in the form of providing employment or new job market formation. Technological advancement boosts productivity and competitiveness, leading to an increase in employment and, consequently, a demand for labor. Yet, it could have a different effect on jobs across sectors. In other words, job creation might occur in high-tech sectors, while job destruction could occur in low-tech industries due to automation and upgrading.
Any industries or areas entering new technologies and production methods under the MIC 2025 plan may just reconfigure the skill mismatch within the labor market in a new way. That means jobs workers were doing in traditional manufacturing industries won't really have high-tech equivalents being created for them in new areas, thus leading to structural unemployment. This strategy addresses this issue by placing more weight on education and training programs that will raise the general level of community education and help the workforce in this community transition to new industries. Effective labor market policy and retraining programs are supposed to make the effects of skill mismatch less harsh and ensure a smooth adjustment in labor markets.
However, employment growth and economic benefits will be much better in those cities implementing the MIC 2025 strategy than in the non-pilot cities. The positive spillover effects, according to this strategy, are that technological and industrial upgrading will spread to neighboring regions.
Its goal is to promote inter-regional collaboration and build regional infrastructure in order to achieve a more balanced development across regions and mitigate any negative effects that may arise from their differences. One of the key components of the MIC 2025 plan is a focus on advancing environmentally friendly and sustainable development. Undoubtedly, the emphasis in this process would be on generating employment opportunities for the population. It would promote the development of a green economy that prioritizes energy efficiency, pollution reduction, and the advancement of green technologies. Sustainable development would necessarily boost such sectors as renewable energy, electric vehicles, and environmental protection since the strategy regards them positively: it reflects the growth of businesses in these directions and provides additional jobs for many people. With this increase, these green jobs would help the country meet its environment goals by providing long-term employment to workers.
Based on the above analysis, we therefore propose to see how an MIC 2025 strategy is in a position to help society reduce youth unemployment. The following hypothesis is thus proposed:
Hypothesis 1: The MIC 2025 policy helps to achieve a decrease in the rate of unemployment.
4. Methodology
4.1. Empirical strategy
This section lays out the study approach that was utilized to gather empirical data and answer the following question: how does "Made in China 2025" affect the unemployment rate in the several pilot cities?
The analysis is conducted in two main parts: first, the Double Machine Learning model with the Lasso algorithm will be used to establish causal links between the MIC 2025 policy and the unemployment rates; second, the DID and SDID models will verify the findings. The data cover three pilot cities and three non-pilot cities from 2006 to 2021.
4.2. Double machine learning model with lasso regression
In doing so, the Double ML model assists in finding causal effects that the MIC 2025 strategy would have on the rate of unemployment. This model employs advanced machine learning techniques to effectively manage data with a large number of dimensions and account for confounding variables, hence ensuring accurate estimation of causal effects [7].
The Double ML model proceeds by the following steps:
1. First Stage: Estimate the nuisance parameters using Lasso regression to model the relationship between the MIC 2025 policy and the control variables.
2. Second Stage: Estimate the causal effect of the MIC 2025 policy on the unemployment rate based on the residuals obtained from the first stage.
The key equation of the Double ML model is:
Where
4.3. Difference-in-Differences (DID) and Synthetic Difference-in-Differences (SDID) models
To further confirm the robustness of the estimated causal effects using the Double ML model, we use the DID and SDID models. The models analyze the differences in unemployment rates between pilot cities (treatment group) and non-pilot cities (control group) before and after the implementation of the MIC 2025 strategy [8].
4.3.1. Difference-in-Differences (DID) model
The Difference-in-Differences (DID) model helps to account for unchanging and unmeasured differences between the two groups, as well as shared patterns that may impact them over time. The specification of the model used is as follows:
Where:
4.3.2. Synthetic Difference-in-Differences (SDID) model
The SDID method combines synthetic control methods with the DID approach to generate a composite control group that closely resembles the treatment group's pre-treatment characteristics [9]. Consequently, it is more resilient by guaranteeing comparability between the treatment and control groups before treatment.
4.4. Variable selection
4.4.1. Made in China 2025 pilot policy
After analyzing the "Made in China 2025" pilot cities list provided by the Ministry of Industry and Information Technology in 2016 and 2017, we compared it with local data and identified three pilot cities through our screening process. The policy dummy variable for "Made in China 2025" is generated by aggregating the implementation time of each pilot policy.
4.4.2. Control variables
Regularization algorithms can be employed to effectively adapt dual machine learning to the case of high-dimensional control variables. To control for other city characteristics on unemployment rates. GDP growth, industry value added, education investment, technology investment, household computation, financial loans, deposit, infrastructure investment, net mobility, and the rate at which people are actively engaged in the workforce. The labor force participation rate is calculated by subtracting the number of jobless individuals from the number of employed individuals, dividing it by the total number of residents over 16 years old, and then multiplying the result by 100%. The household computation is determined by multiplying the per capita consumption expenditure by the total population. Ultimately, the regression analysis incorporates quadratic terms of control variables to enhance the precision of the model's fit. To account for missing information in the city and time dimensions, we incorporate city and time-fixed effects as dummy variables for persons and years.
4.5. Data sources
Data for this analysis come from several authoritative databases to ensure comprehensiveness and reliability, including the China City Statistical Yearbook for city-level economic and social statistics, the China Economic and Social Development Statistics Database for detailed annual economic indicators, Provincial Statistical Yearbooks for provincial information, Statista for additional economic statistics, and the National Bureau of Statistics of China, the official online source for a wide range of socio-economic indicators.
This empirical strategy attempts to offer robust evidence on the causal influence of the MIC 2025 strategy on unemployment rates in pilot cities. It employs the Double ML model with Lasso regression and validates the findings using DID and SDID models. This strategy guarantees thorough analysis by including sophisticated econometric tools and verifying outcomes through rigorous comparison procedures. In addition, this experiment will also offer other testing methodologies in the future.
4.6. Empirical result
The empirical findings regarding the implementation of the DML, DID, and SDID models, in addition to other regression models including Random Forest, Ridge Regression, and Linear Regression, are discussed in the following sub-sections, with the results pertaining to how the MIC 2025 strategy affects the unemployment rates in the pilot cities.
4.7. Baseline result
The initial division ratio of the two-ML model was established at 1:4. The Lasso method was employed to forecast and address the primary regression and ancillary regression, and the results are shown in Table 1.
|
Variable |
Baseline |
Year |
City |
Both |
|
Policy(SE=0.001) |
-0.0054*** |
-0.0054*** |
0.0045*** |
0.0054*** |
|
Control variable (linear) |
No |
Yes |
Yes |
Yes |
|
Control variable (quadratic) |
No |
Yes |
Yes |
Yes |
|
City FE |
No |
No |
Yes |
Yes |
|
Year FE |
No |
Yes |
No |
Yes |
|
N |
96 |
96 |
96 |
96 |
***, **, and * indicate statistical significance at 1%, 5%, and 10% levels, respectively.
Summary of the test results for the Double Machine Learning model: The inclusion of fixed effects in the implementation of MIC 2025 policy has resulted in a varying impact on the rate of unemployment.
Baseline Model: The coefficient of the policy variable is -0.0054 and has a standard error equal to 0.001; the one that reduces unemployment significantly.
Year-Fixed Effects: The policy variable registers a significantly negative effect, resulting in the same results as with year-fixed effects.
City Fixed Effects: The policy variable has a positive coefficient value of 0.0045 when controlling for city fixed effects, indicating that the unemployment rate may increase.
Including both year and city fixed effects in this specification, the policy variable under consideration yields a positive effect-implying that the MIC 2025 policy may be correlated with an increase in the unemployment rates. This ambiguity in the results can have occurred because of other confounding factors affecting the research.
Mixed results in the DML model indicate complexity in isolating the effects of MIC 2025 on unemployment rates, which would tend to suggest some other factors at play in these trends.
4.8. Robustness test
4.8.1. Results of DID and SDID models
Empirical Results: The outcomes of the Difference-in-Differences (DID) and Synthetic Difference-in-Differences (SDID) models are succinctly presented in Table 2. Given that the coefficient for the policy variable in the Difference-in-Differences (DID) model is positive, we might expect to see an increase in the unemployment rate. This was contrasted by a highly significant negative coefficient in the SDID model, indicating, after establishing the appropriate synthetic controls, that the MIC 2025 strategy succeeded in reducing unemployment.
|
Variables |
(1) Traditional DID |
(2) SDID |
|
policy |
0.0048* (0.0025) |
-0.0106*** (0.0015) |
|
Control variable (linear) |
Yes |
Yes |
|
City FE |
Yes |
Yes |
|
Year FE |
Yes |
Yes |
|
N |
96 |
96 |
***, **, and * indicates statistical significance at 1%, 5%, and 10% levels, respectively. Robust standard errors are in parentheses.
Traditional Difference-in-Differences (DID) Model: The coefficient of the policy variable is precisely 0.0048, indicating a positive association with the unemployment rate. This result is not so reliable by virtue of the small sample size and some other limitations.
SDID Model: The coefficient of the policy variable is -0.0106 and, when examined, proves statistically significant. Therefore, it can be implied that MIC 2025 is negative for unemployment. It is possible that the SDID model has more sensitivity for reducing large numbers of confounders than the DID model because a larger number of confounding variables are controlled in the SDID model.
These opposing findings for DID and SDID models highlight the necessity of adopting approaches that are more robust, similar to SDID, for detecting results with small sample sizes and possible biases.
4.9. Random Forest model output
The Random Forest model produced outcomes as shown in Figures 1-3. The salient elements depicted in Figure 1 include the significance of investing in technology and infrastructure., and net mobility ranks most important in predicting unemployment rates.
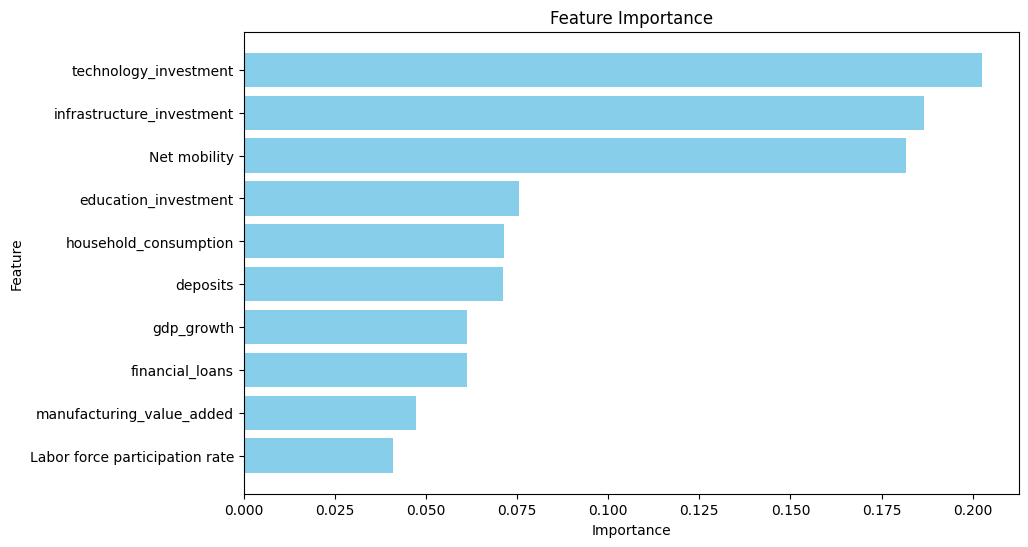
These features indicate their importance to the prediction of unemployment rates, with investment in technology, infrastructure, and net mobility having the highest contributions.
The Random Forest model produced nice results in the forecasting of unemployment rates. It can be seen in the accuracy plots for the predictions, namely, Figures 2 and 3, in which actual values relate very well to predicted values. Figure 2 shows the accuracy of random forest prediction of the unemployment rate in the form of dot fitting.
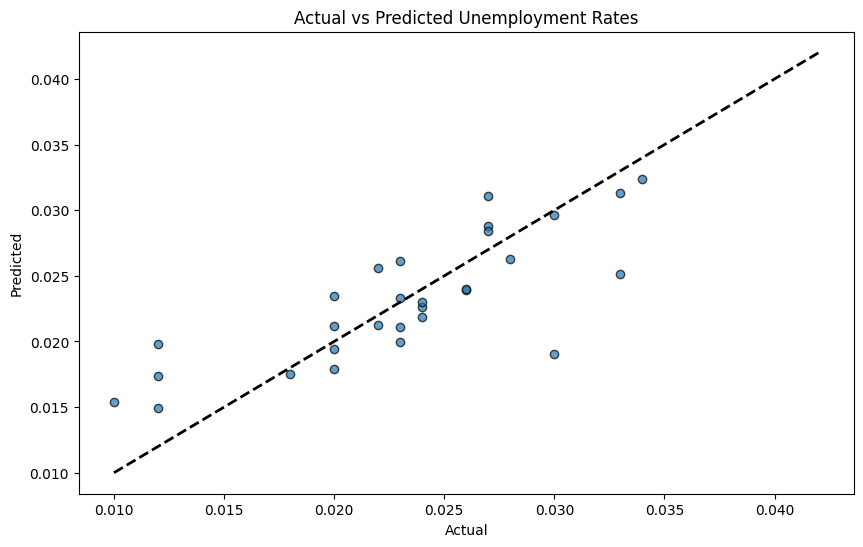
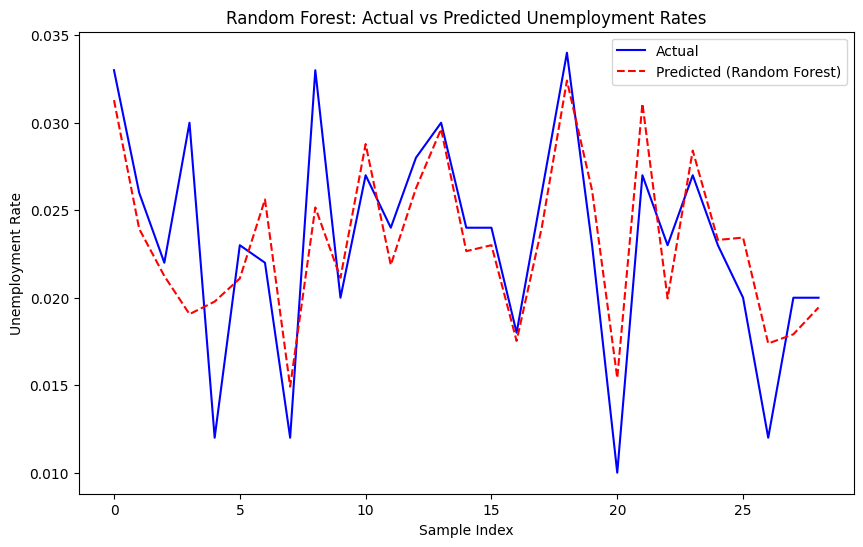
Figure 3 shows the accuracy of random forest prediction of the unemployment rate in the form of line fitting. The high fitting accuracy of the Random Forest model further affirms the robustness of DML results based on its high capacity to effectively represent the connection between policy and unemployment rates. Also, the stability for the result of random forest can be shown in several data in Table 3.
|
Training set MSE |
4.3983 |
|
Training Set RMSE |
0.002097 |
|
Training Set |
0.9237 |
|
Test Set MSE |
1.40996 |
|
Test Set RMSE |
0.003755 |
|
Test Set |
0.6306 |
MSE (Mean Squared Error): This represents the average squared difference between predictive and actual responses. Lower values can explain better performance by the model and are good to use for gauging the overall model accuracy [10-12].
RMSE (Root Mean Squared Error): The square root of MSE, which yields the measure of the average magnitude of errors. Smaller values reflect better predictive accuracy. RMSE is often useful when error magnitudes are of importance [10-12].
The Random Forest model has done splendidly well on the training set, which states that
4.10. Results from linear model and ridge model
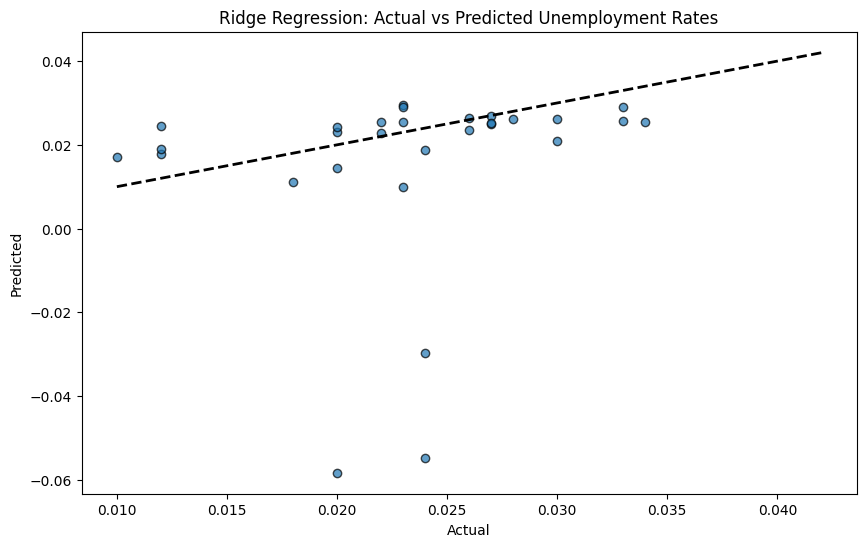
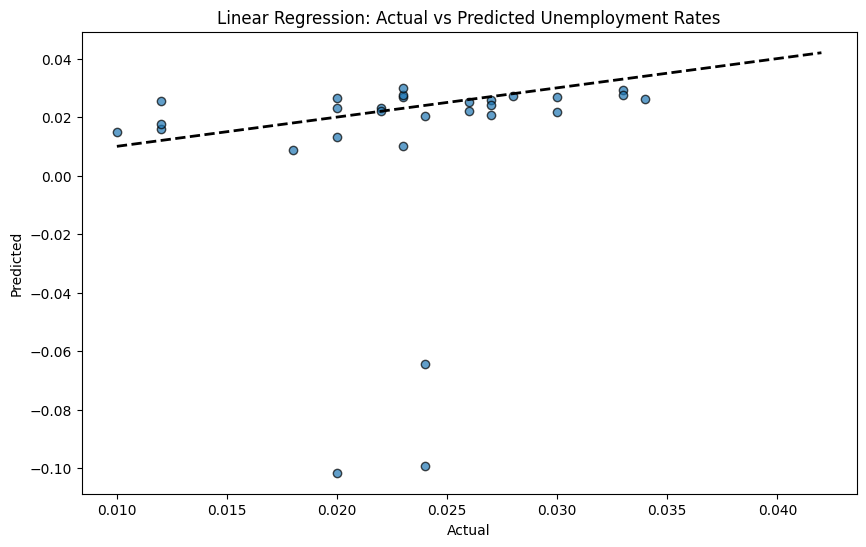
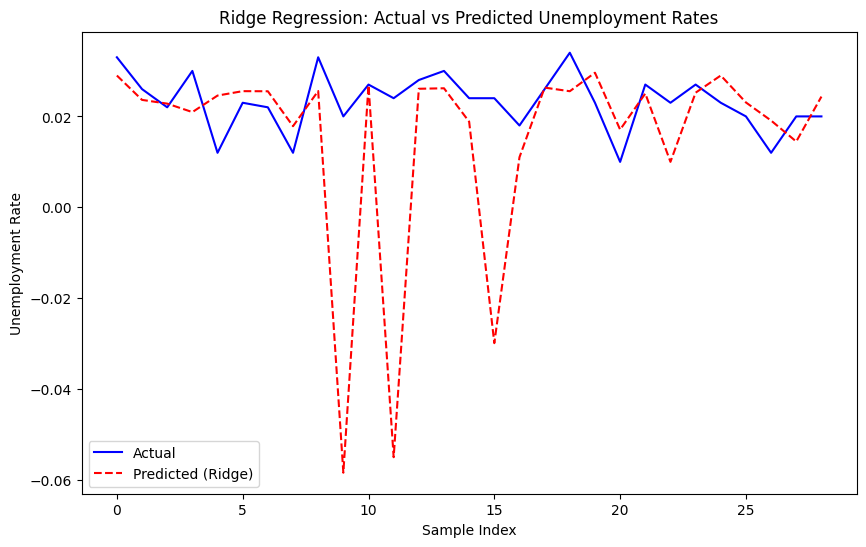
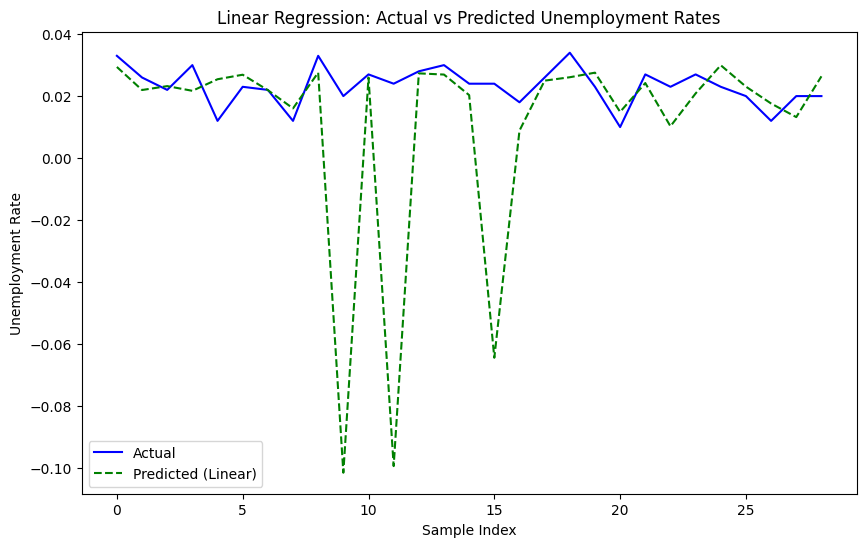
The output of both Ridge Regression and Linear Regression models has been shown in Figures 4-7. Figure 4 shows the accuracy of the Ridge regression prediction of the unemployment rate in the form of dot fitting. Figure 5 shows the accuracy of Linear regression prediction of the unemployment rate in the form of dot fitting. Figure 6 shows the accuracy of the Ridge regression prediction of the unemployment rate in the form of line fitting. Figure 7 shows the accuracy of the Linear regression prediction of the unemployment rate in the form of line fitting. All these models, along with the present findings shown in Fig., do provide some ideas, but they are not all too potent because a few very extreme data points have a big influence on the fitting curves.
The stability of Ridge regression and Linear regression is shown in Table 4 and Table 5.
|
Training set MSE |
3.7654 |
|
Training Set RMSE |
0.0061 |
|
Training Set |
0.3467 |
|
Test Set MSE |
0.0005591 |
|
Test Set RMSE |
0.0236 |
|
Test Set |
-13.6505 |
Because the model clearly overfits to training data and hence generalizes poorly for unknown data, most probably this would be because of a small sample size with extreme points driving the fit.
|
Training set MSE |
3.6246 |
|
Training Set RMSE |
0.0060 |
|
Training Set |
0.3711 |
|
Test Set MSE |
0.001337 |
|
Test Set RMSE |
0.0366 |
|
Test Set |
-34.0417 |
The linear regression model performs well on the training set, as evidenced by its high R² value, which implies that a significant percentage of the variability in the training data is accounted for. However, it performs poorly on the test set: R² is negative, and RMSE is high. The poor performance on the test set could be related to a small sample size and the presence of significant outliers, greatly affecting the model's accuracy and reliability.
The low performance of such Ridge and Linear Regression models—as can be seen, R² being negative—along with more RMSE found in test sets may be due to the low size of the sample and the existence of outliers. These factors significantly influence the precision and dependability of these models. This means that the architectures embody some variance in the training data, although they generalize poorly on unknown data—practically disappointing in this particular context.
5. Conclusion
This study aims to quantify the effect of the "Made in China 2025" (MIC 2025) plan on the unemployment rate in selected cities. The empirical application of the Double Machine Learning (DML) approach utilized for this model yields inconclusive findings about the impact of the unemployment rate on policy. Baseline and year fixed effects models imply a significant decrease in the unemployment rate, but city fixed effects, as well as combined year and city fixed effect models, reveal the potential for an increase. These inconclusive outcomes once again demonstrate the intricate nature of isolating the influence of the MIC 2025 approach. This suggests that other complicating factors may be at play in influencing the results.
This is so despite indicating an increase in unemployment rates, the weakness in reliability being due to small sample sizes and other limitations. The Synthetic Difference-in-Differences (SDID) model does better than that and provides more robust evidence by showing a considerable reduction in unemployment rates when synthetic controls are accounted for. This only reaffirms the truth when complex methods such as SDID are employed to test facts, especially when the samples of data are low and biases have been accounted for.
These results further conformed to the robustness of the DML, with the Random Forest model coming up with high predictive accuracy and technologies invested in, infrastructure investment, and net mobility cited as highly significant predictors of unemployment rates. The model demonstrated strong performance and predictive ability, as indicated by high R² values for both the training and test sets, along with low RMSE values.
However, both the Ridge Regression and Linear Regression models demonstrate inadequate performance in the test set. This is represented by the negative R² values and the comparatively higher RMSE. These results suggest poor generalization to unseen data, which is probably due to a small sample size and the existence of outliers that have a high leverage in the determination of model performance.
5.1. Policy recommendations and future improvements
Based on the findings from this work, various policy recommendations and areas that need to be addressed come up for improving the effectiveness of the MIC 2025 strategy and reducing further the level of unemployment. It is essential to enhance training and education programs by implementing comprehensive training initiatives that equip the workforce with the skills needed for high-tech industries, addressing structural unemployment caused by advanced technology. Additionally, promoting lifelong learning and continuous education will enable the workforce to adapt to technological advancements and industry changes.
Increasing investments in technology and infrastructure in pilot cities is crucial to fostering innovation and creating new jobs, which includes boosting R&D funding and improving industrial facilities. Supporting small- and medium-sized enterprises (SMEs) through financial and technical aid will help them adopt new technologies and improve productivity, further contributing to economic performance and job creation.
Promoting balanced regional development by implementing policies that extend the benefits of technological advancements and industrial upgrades to non-pilot cities and surrounding regions is vital. This can be achieved through regional cooperation and infrastructure projects that connect urban and rural areas. Offering incentives for businesses to relocate or expand into less developed regions will help boost local economies and reduce regional unemployment disparities.
Improving environmental and sustainable practices by focusing on creating green jobs through investments in renewable energy, electric vehicles, and environmental protection industries is also important. Encouraging sustainable development practices across all sectors will ensure that economic growth does not compromise environmental health.
Finally, enhancing data collection and analysis is necessary by improving the quality and granularity of data to better understand the impacts of the MIC 2025 strategy. Expanding the sample size and diversifying data will increase the reliability and generalizability of empirical analyses, aiding in model refinement and achieving more accurate results.
5.2. Future research directions
More studies should be conducted in a wider spectrum of cities and industries. Longitudinal studies tracking the changes over longer periods will help gain deeper insights into the long-term impacts of the MIC 2025 strategy. Further research on the relationship between technological progress, labor market dynamics, and regional development policy may help in the devising of more effective policies in unemployment reduction and sustainable economic growth.
Conclusion: Even though the MIC 2025 could be a successful strategy to reduce unemployment and promote economic growth, supportive policies should minimize skill mismatch, regional disparity, and sustainable development. Policies must also be frequently evaluated and adapted according to empirical evidence.
Acknowledgement
Juntao Zhang and Yufu Chen contributed equally to this work and should be considered co-first authors.
References
[1]. Yuan, J., & Liu, S. (2024). A double machine learning model for measuring the impact of the Made in China 2025 strategy on green economic growth. Scientific Reports, 14, 12026. https: //doi.org/10.1038/s41598-024-62916-0
[2]. Chernozhukov, V., Chetverikov, D., Demirer, M., Duflo, E., Hansen, C., Newey, W., & Robins, J. (2018). Double/debiased machine learning for treatment and structural parameters. Econometrics Journal, 21(1), C1-C68. https: //doi.org/10.1111/ectj.12097
[3]. Li, L. (2018). China’s manufacturing locus in 2025: With a comparison of “Made-in-China 2025” and “Industry 4.0”. Technological Forecasting and Social Change, 135, 66-74. https: //doi.org/10.1016/j.techfore.2017.05.028
[4]. Xu, L. (2022). Towards green innovation by China’s industrial policy: Evidence from Made in China 2025. Frontiers in Environmental Science, 10, 924250. https: //doi.org/10.3389/fenvs.2022.924250
[5]. Cheng, J., Yi, J., Dai, S., & Xiong, Y. (2019). Can low-carbon city construction facilitate green growth? Evidence from China’s pilot low-carbon city initiative. Journal of Cleaner Production, 231(10), 1158-1170. https: //doi.org/10.1016/j.jclepro.2019.05.327
[6]. Kennedy, S. (2015). Made in China 2025. Center for Strategic and International Studies. https: //www.csis.org/analysis/made-china-2025
[7]. Farbmacher, H., Huber, M., Lafférs, L., Langen, H., & Spindler, M. (2022). Causal mediation analysis with double machine learning. Econometrics Journal, 25(2), 277–300. https: //doi.org/10.1093/ectj/utac003
[8]. Arkhangelsky, D., Athey, S., Hirshberg, D. A., Imbens, G. W., & Wager, S. (2021). Synthetic difference in-differences. American Economic Review, 111(12), 4088–4118. https: //doi.org/10.1257/aer.20190159
[9]. Abadie, A., Diamond, A., & Hainmueller, J. (2010). Synthetic control methods for comparative case studies: Estimating the effect of California’s tobacco control program. Journal of the American Statistical Association, 105(490), 493–505. https: //doi.org/10.1198/jasa.2009.ap08746
[10]. James, G., Witten, D., Hastie, T., & Tibshirani, R. (2013). An Introduction to Statistical Learning: with Applications in R. New York: Springer. https: //doi.org/10.1007/978-1-4614-7138-7
[11]. Friedman, J., Hastie, T., & Tibshirani, R. (2001). The Elements of Statistical Learning: Data Mining, Inference, and Prediction. New York: Springer. https: //doi.org/10.1007/978-0-387-21606-5
[12]. Montgomery, D. C., Peck, E. A., & Vining, G. G. (2012). Introduction to Linear Regression Analysis. John Wiley & Sons. https: //doi.org/10.1002/9781118204468
Cite this article
Zhang,J.;Chen,Y. (2025). "Made in China 2025" Strategy on Unemployment Rates in Several Pilot Cities. Advances in Economics, Management and Political Sciences,198,117-131.
Data availability
The datasets used and/or analyzed during the current study will be available from the authors upon reasonable request.
Disclaimer/Publisher's Note
The statements, opinions and data contained in all publications are solely those of the individual author(s) and contributor(s) and not of EWA Publishing and/or the editor(s). EWA Publishing and/or the editor(s) disclaim responsibility for any injury to people or property resulting from any ideas, methods, instructions or products referred to in the content.
About volume
Volume title: Proceedings of the 3rd International Conference on Financial Technology and Business Analysis
© 2024 by the author(s). Licensee EWA Publishing, Oxford, UK. This article is an open access article distributed under the terms and
conditions of the Creative Commons Attribution (CC BY) license. Authors who
publish this series agree to the following terms:
1. Authors retain copyright and grant the series right of first publication with the work simultaneously licensed under a Creative Commons
Attribution License that allows others to share the work with an acknowledgment of the work's authorship and initial publication in this
series.
2. Authors are able to enter into separate, additional contractual arrangements for the non-exclusive distribution of the series's published
version of the work (e.g., post it to an institutional repository or publish it in a book), with an acknowledgment of its initial
publication in this series.
3. Authors are permitted and encouraged to post their work online (e.g., in institutional repositories or on their website) prior to and
during the submission process, as it can lead to productive exchanges, as well as earlier and greater citation of published work (See
Open access policy for details).
References
[1]. Yuan, J., & Liu, S. (2024). A double machine learning model for measuring the impact of the Made in China 2025 strategy on green economic growth. Scientific Reports, 14, 12026. https: //doi.org/10.1038/s41598-024-62916-0
[2]. Chernozhukov, V., Chetverikov, D., Demirer, M., Duflo, E., Hansen, C., Newey, W., & Robins, J. (2018). Double/debiased machine learning for treatment and structural parameters. Econometrics Journal, 21(1), C1-C68. https: //doi.org/10.1111/ectj.12097
[3]. Li, L. (2018). China’s manufacturing locus in 2025: With a comparison of “Made-in-China 2025” and “Industry 4.0”. Technological Forecasting and Social Change, 135, 66-74. https: //doi.org/10.1016/j.techfore.2017.05.028
[4]. Xu, L. (2022). Towards green innovation by China’s industrial policy: Evidence from Made in China 2025. Frontiers in Environmental Science, 10, 924250. https: //doi.org/10.3389/fenvs.2022.924250
[5]. Cheng, J., Yi, J., Dai, S., & Xiong, Y. (2019). Can low-carbon city construction facilitate green growth? Evidence from China’s pilot low-carbon city initiative. Journal of Cleaner Production, 231(10), 1158-1170. https: //doi.org/10.1016/j.jclepro.2019.05.327
[6]. Kennedy, S. (2015). Made in China 2025. Center for Strategic and International Studies. https: //www.csis.org/analysis/made-china-2025
[7]. Farbmacher, H., Huber, M., Lafférs, L., Langen, H., & Spindler, M. (2022). Causal mediation analysis with double machine learning. Econometrics Journal, 25(2), 277–300. https: //doi.org/10.1093/ectj/utac003
[8]. Arkhangelsky, D., Athey, S., Hirshberg, D. A., Imbens, G. W., & Wager, S. (2021). Synthetic difference in-differences. American Economic Review, 111(12), 4088–4118. https: //doi.org/10.1257/aer.20190159
[9]. Abadie, A., Diamond, A., & Hainmueller, J. (2010). Synthetic control methods for comparative case studies: Estimating the effect of California’s tobacco control program. Journal of the American Statistical Association, 105(490), 493–505. https: //doi.org/10.1198/jasa.2009.ap08746
[10]. James, G., Witten, D., Hastie, T., & Tibshirani, R. (2013). An Introduction to Statistical Learning: with Applications in R. New York: Springer. https: //doi.org/10.1007/978-1-4614-7138-7
[11]. Friedman, J., Hastie, T., & Tibshirani, R. (2001). The Elements of Statistical Learning: Data Mining, Inference, and Prediction. New York: Springer. https: //doi.org/10.1007/978-0-387-21606-5
[12]. Montgomery, D. C., Peck, E. A., & Vining, G. G. (2012). Introduction to Linear Regression Analysis. John Wiley & Sons. https: //doi.org/10.1002/9781118204468