


1. Introduction
The process of worldwide integration has significantly strengthened the interdependence and interconnectedness. Global markets can be viewed as a complex financial system constituted of interacting units [1], where risk shocks originating in one market can trigger multidimensional fluctuations. The numerous uncertainties, introduced by persistent economic frictions [2] and geopolitical conflicts [3,4], not only broaden the scope but also render it more contagious [5]. This, in turn, promotes rapid spillovers on the global scale, spreading these two systemic risks across interconnected areas beyond their original sectors.
While most of the existing research focuses on energy markets [6-10], further investigation is necessary into the significance of gold as a precious metal. In addition to its commodity properties, gold provides risk hedging, portfolio diversification in a risky market environment, accompanied by high volatility and stock market disengagement [11-14]. Its role as a “safe haven” makes it an attractive investment for investors seeking to preserve and expand their assets.
Typically, the gold market can be affected through various channels. At the macro level, countries may sell gold reserves during periods of global turbulence to influence supply levels, leading to short-term price surges and increased volatility. At the micro level, investors often withdraw from the stock market to safer assets like gold, which also impacts its price. Further at the market level, the spillover effect occurs as the interconnectedness of financial system allows economic and geopolitical risks to spread more rapidly, amplifying their impact on the gold market [15,16]. As the result of these factors. the volatility of gold market becomes a crucial indicator. It not only reflects underlying trend risks and sentiment changes, but also serves as a key metric for making investment decisions and risk management [17]. Thus, analyzing the spillover effects of uncertainty risks and the gold market, as well as their interactions, has significant theoretical and practical implications. Such analysis provides valuable insights for optimizing asset portfolio management for investors, and developing economic policies aimed at sustaining financial stability for policymaker.
Since earlier studies have failed to comprehensively investigate the relationship between uncertainty risks and the gold market, this paper addresses the gap by examining spillover effects and analyzing topological features within a three-layer multiplex network. It contributes to existing research in three ways: First, by broadening the analysis to encompass economic uncertainty risks, geopolitical risks, and gold market volatility, incorporating a broader array of risk and market factors. Second, by applying time-varying method, capturing the dynamic interactions and impact. Third, by investigating the topological features in a multiplex network, providing insights into their systemic linkages and characteristic.
The remainder of this paper is organized as follows. The next section is the review of existing literature, Section 3 introduce the data and methodology. The paper presents the empirical results in Section 4 and draw conclusions in Section 5.
2. Literature review
Due to the increase in risks, existing literature has explored various factors, channels, and predictors of gold price volatility. The impact of non-financial market factors, such as economic and geopolitical uncertainty, alongside traditional financial market factors, such as exchange rates, interest rates, equities and commodities, has drawn significant attention, particularly during periods of global economic downturn and geopolitical turmoil [18-20]
Regarding economic uncertainty policy, Baker et al [2]. first introduced the Economic Policy Uncertainty (EPU) index, constructed utilizing official news articles' relevant keywords correlated to finance and economic operations. Research employing this index indicates that economic uncertainty risk causes gold prices to rise, especially at lower quantiles [21], and improves the accuracy of short-term gold futures price fluctuations prediction [22]. Regarding geopolitical risks, Caldara and Iacoviello [4] developed the Geopolitical Risk (GPR) index based on newspaper articles, to capture risks associated with war, terrorism, and interstate tensions. Related studies find a significant positive effect on gold market volatility high-tension periods [15], and a time-varying correlation with stock markets, highlight gold's role as a good diversifier and safe haven. While much of aforementioned studies focuses on the function of uncertainty risks as a fitting factor, it often uses models like GARCH-MIDAS for mixed-frequency tracking and forecasting, without fully exploring their interconnectedness with the gold market.
Spillovers, a critical phenomenon in financial markets, have been extensively examined and quantified, particularly since the introduction of coefficients by Diebold and Yilmaz [23]. The method combines TVP-VAR models and generalized variance decomposition methods to depict spillovers and directional connectedness, and it turns out that connectedness measures are closely related to aspects of network connectedness [24]. Various studies have used the spillover matrices (taking variables as nodes and pairwise connection as edges to build the complex network) to analyze the topological aspects of the stock, carbon, and energy markets [25-28]. Studies related to volatility or uncertainty risk spillovers, though studies on the mechanisms of spillover that are often limited to a single dimension. For instance, Li et al [29].examined geopolitical and gold price dynamics of 18 emerging gold markets by using the global GPR index instead of country-specific variables to build a network, while Zhu et al [16]. explored relationship between gold market and extreme climatic change by testing causality-in-quantities to the gold market spillover network. These studies often overlook the external characteristics of risk, because they retain their independence even when discussing interconnectivity. Rather, a multilayer approach that charts each social group into a different laver of interactions and operates the spreading process separately on each layer [30], can lead actually to a series of significant and impactful insights.
To address these gaps, this paper introduces the method of complex multilayer networks to more comprehensively investigate the interactions between global economic, geopolitical uncertainty risks and gold market volatility. Although multilayer networks have been extensively discussed in the fields of medicine and social sciences, their application in finance has primarily focused on systemic stability [31-33], stock market risk contagion [34-36], investor sentiment [37], and trading networks [38]. By constructing a multiplex network on the basis of spillover effect measures, this paper aims to better capture both intra- and inter-layer interactions, providing theoretical and practical guidance for global investment and policy strategies.
3. Methodology
3.1. Spillover measurement
Traditional multivariate GARCH models, such as BEKK-GARCH and DCC-GARCH, have limitations in capturing the directionality and dynamics of spillovers. To overcome these limitations, Diebold and Yilmaz [39] used Cholesky decomposition to construct the index. They later enhanced their approach by adopting the generalized VAR framework of Koop et al [40]. and Pesaran and Shin [41], which allowed for variance decompositions independent of variable order [23]. Given that static models cannot fully represent dynamic interactions, this paper, following Antonakakis et al [6]., uses the TVP-VAR approach to provide time-varying spillover index characteristics. This approach reduces sample loss and smoothes estimation results, making it valuable to financial market spillover research.
To begin, the TVP-VAR model is developed. The H-step generalized variance decomposition matrix can be described as
where
Further, the grand total of the off-diagonal entries measures total connectedness in the whole system be calculated as follow.
3.2. Network measurement
Based on the pairwise spillover connectedness of economic uncertainty risk (EPU), geopolitical uncertainty risk (GPR) and gold market volatility (GOLD), this paper construct a 3-layer multiplex networks
The discussion of multiplex network measurement indicators in the financial domain now focuses on the node, edge, and layer measurements [29]. Following Wang et al [37]., Gong et al [1]., and Xiang et al [36]., the paper illustrates the topological features with measures below.
3.2.1. Spillover strength measures
The spillover effect strength of a single layer can be roughly measured by three indicators: in-strength (IS), out-strength (OS), and net-strength (NS) of node
where,
3.2.2. Centrality measures
The problem of identifying the nodes that play a central structural role is one of the main topics in the traditional analysis of complex networks. There are many well-known parameters that measure the structural relevance and importance of each node [30], including the node degree, the closeness (facilitates efficient communication), the betweenness (controls information flow) and PageRank (determines node influence) centrality.
where,
3.2.3. Dependence measures
In order to examine the layer-layer correlations, the paper apply the following methods to analyze the similarity. Spearman rank correlation measures the strength of monotonic relationships between the ranks of two layers. Kendall rank correlation assesses the ordinal association between layers, reflecting the consistency of rank ordering.
where
3.3. Data and description
In order to capture the interaction between uncertainty risks and the gold market on the global scale, 9 economies are mainly focused across Asia-Pacific (Australia, China, Japan, India, Russia), Europe (the Eurozone and the UK), and Americas (the USA and Canada). Utilizing monthly data spanning from January 2000 to May 2024, the paper examines the spillover effects and their topological features among these regions.
Uncertainty risks are quantified using two prominent indices derived from text analysis: the Economic Policy Uncertainty (EPU) Index, developed by Baker et al [2]., which measures policy-related economic uncertainties through the frequency of newspaper coverage, and the Geopolitical Risk (GPR) Index, developed by Caldara and Iacoviello [4], which gauges adverse geopolitical events by analyzing articles from ten major newspapers. The gold market price trends, based on local currencies, are derived from public data from the World Gold Council (WGC). The gold volatility is calculated using the GARCH (1,1) model applied to the first log-differenced series of the gold price, which represents the return.
As shown in the table below, all three panels of data display the risk characteristics of high peaks and fat tails, and pass the ADF test at 1% level.
|
Mean |
Max |
Min |
Std.Dev. |
Skew |
Kurt |
ADF |
|
|
Panel A: EPU |
|||||||
|
Australia |
109.350 |
337.044 |
25.662 |
59.784 |
1.244 |
4.533 |
-7.745*** |
|
China |
148.867 |
661.828 |
10.111 |
119.164 |
1.456 |
4.962 |
-4.839*** |
|
India |
106.830 |
239.024 |
48.399 |
31.153 |
1.057 |
4.993 |
-7.396*** |
|
Japan |
89.571 |
283.689 |
23.353 |
45.484 |
1.476 |
5.763 |
-6.957*** |
|
Russia |
190.486 |
964.141 |
12.399 |
159.449 |
1.755 |
6.403 |
-6.310*** |
|
Eurozone |
144.819 |
344.613 |
53.851 |
58.900 |
0.745 |
3.161 |
-4.234*** |
|
UK |
216.541 |
1141.796 |
29.027 |
149.794 |
1.645 |
8.374 |
-4.938*** |
|
USA |
188.282 |
678.817 |
39.323 |
115.734 |
0.961 |
3.870 |
-5.067*** |
|
Canada |
139.226 |
503.963 |
44.783 |
64.443 |
1.882 |
8.984 |
-6.403*** |
|
Panel B: GPR |
|||||||
|
Australia |
0.107 |
0.515 |
0.013 |
0.075 |
1.993 |
8.527 |
-8.844*** |
|
China |
0.561 |
2.475 |
0.161 |
0.307 |
1.657 |
7.839 |
-6.720*** |
|
India |
0.240 |
1.237 |
0.059 |
0.166 |
2.248 |
9.828 |
-9.063*** |
|
Japan |
0.220 |
0.946 |
0.064 |
0.130 |
2.985 |
15.284 |
-9.292*** |
|
Russia |
0.864 |
8.801 |
0.218 |
0.816 |
4.694 |
37.476 |
-5.130*** |
|
Eurozone |
0.146 |
0.864 |
0.046 |
0.095 |
3.206 |
18.779 |
-6.629*** |
|
UK |
1.128 |
5.995 |
0.404 |
0.694 |
4.007 |
24.626 |
-7.223*** |
|
USA |
0.225 |
1.724 |
0.057 |
0.171 |
4.655 |
34.990 |
-7.819*** |
|
Canada |
2.447 |
13.229 |
0.820 |
1.355 |
4.380 |
30.995 |
-6/607*** |
|
Panel C: GOLD |
|||||||
|
Australia |
0.012 |
0.208 |
0.003 |
0.014 |
9.569 |
122.087 |
-9.078*** |
|
China |
0.011 |
0.069 |
0.003 |
0.009 |
3.249 |
17.845 |
-5.226*** |
|
India |
0.012 |
0.083 |
0.003 |
0.01 |
3.591 |
21.52 |
-6.252*** |
|
Japan |
0.011 |
0.075 |
0.004 |
0.008 |
3.364 |
19.449 |
-5.166*** |
|
Russia |
0.019 |
0.694 |
0.005 |
0.044 |
12.544 |
185.448 |
-11.892*** |
|
Eurozone |
0.01 |
0.071 |
0.003 |
0.008 |
3.183 |
17.409 |
-6.489*** |
|
UK |
0.011 |
0.083 |
0.004 |
0.009 |
3.629 |
22.694 |
-7.280*** |
|
USA |
0.011 |
0.09 |
0.004 |
0.009 |
4.377 |
32.475 |
-6.628*** |
|
Canada |
0.011 |
0.065 |
0.004 |
0.008 |
3.31 |
18.236 |
-5.174*** |
Note: ***, **, and* indicate statistical significance at the 1%, 5% and 10% level, respectively. ADF stands for the Augmented Dickey-Fuller root tests, which is used to check the stationarity.
4. Empirical results
The section examines the mechanism through the topological features of the multiplex network. The full-sample effect is first analyzed to illustrate the rough situation as shown in Figure 1. In addition, rolling sample analysis is used to estimate the dynamic characteristic of the multiplex network.
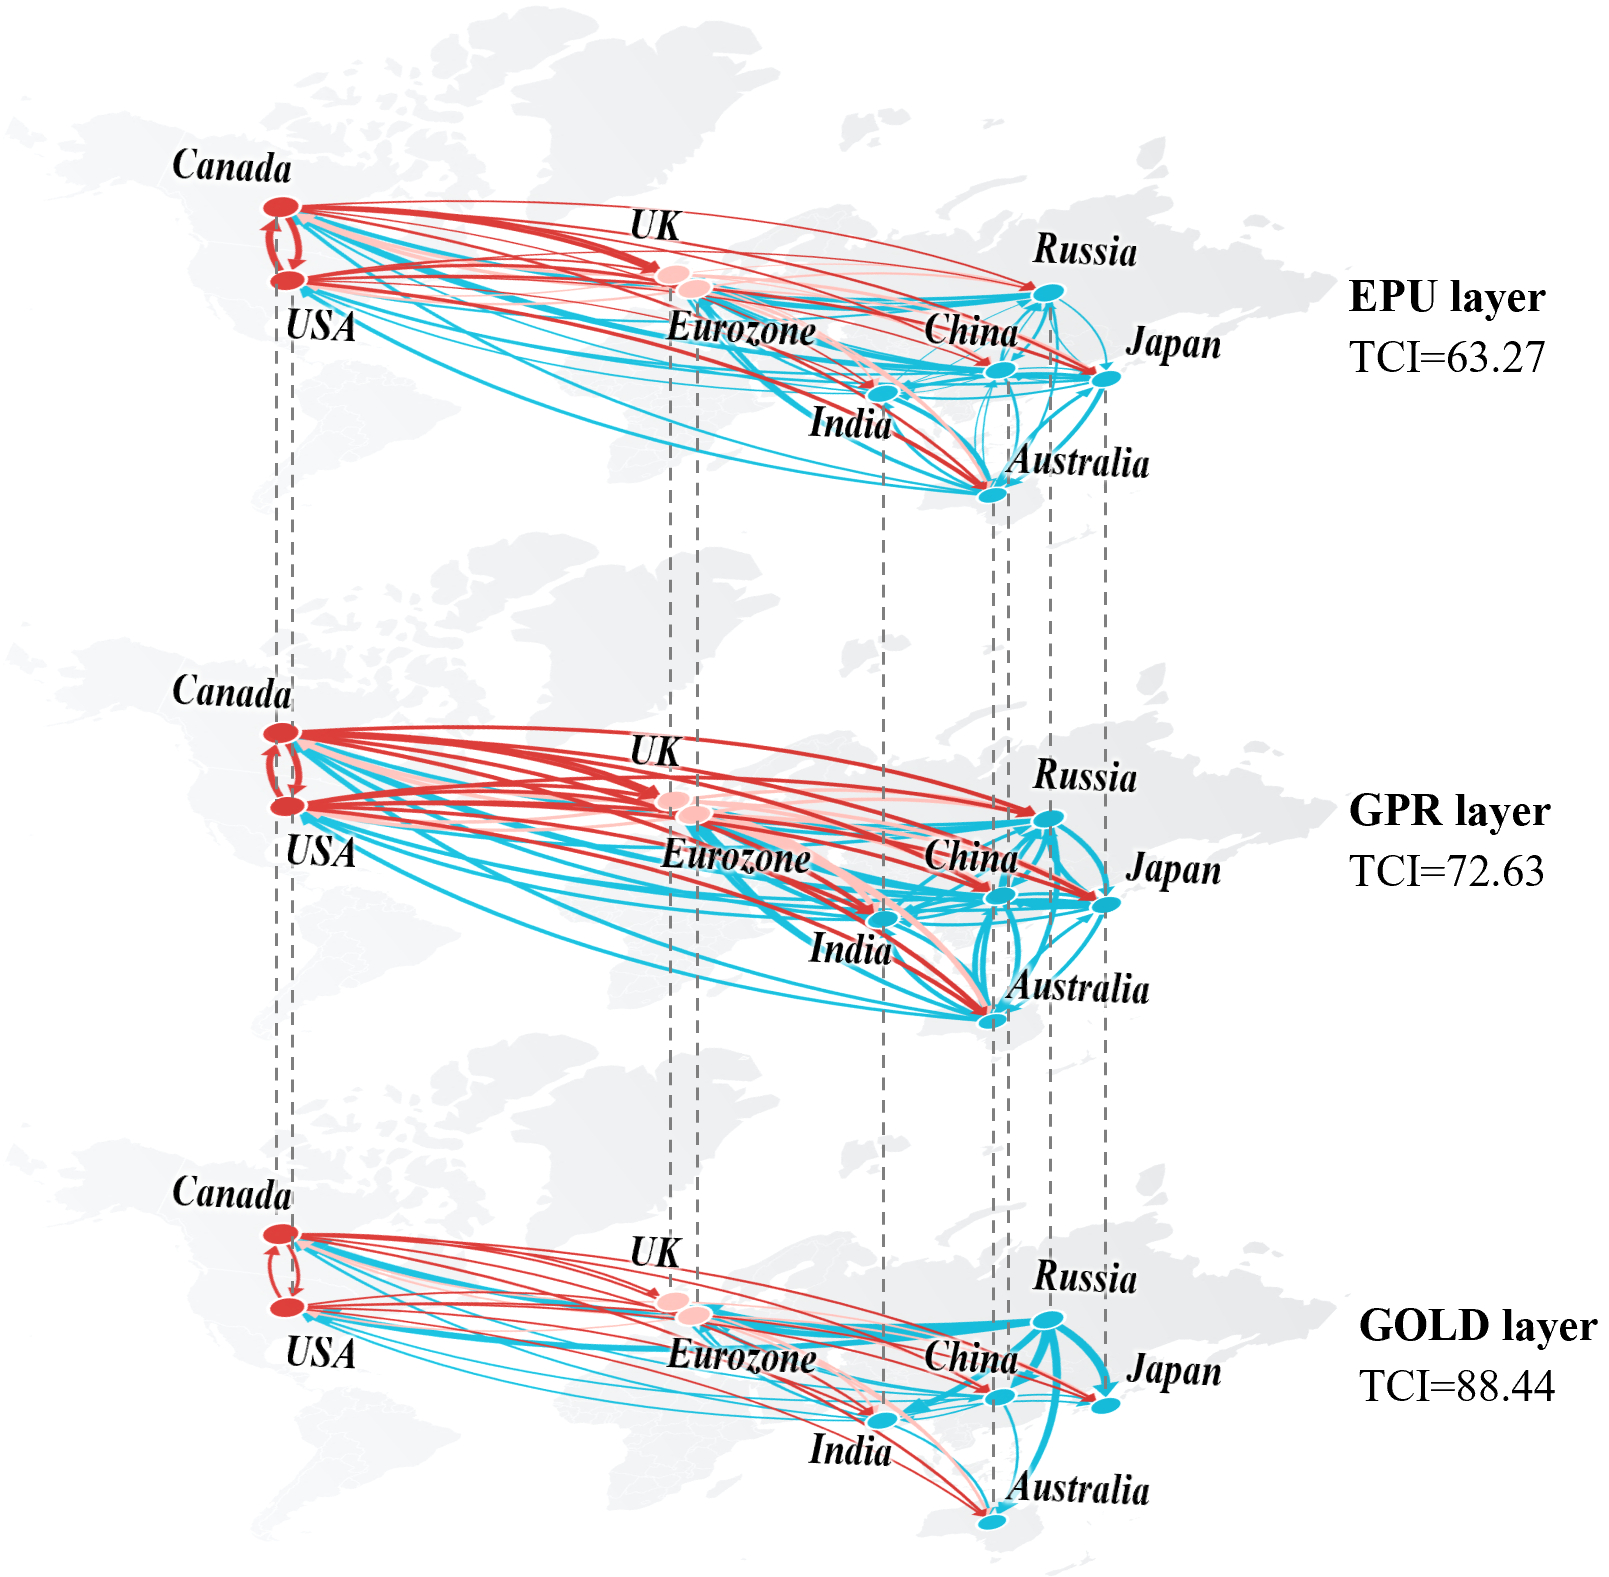
4.1. Full-sample analysis
The tables below illustrate the general topological features of spillover effect of nine economies across the three layers: economic uncertainty risk (EPU), geopolitical risk (GPR), and gold market volatility (GOLD). Through a static analysis of the full sample, the general features of the spillover effect network can be derived.
|
In-strength |
Out-strength |
Net-strength |
||||||||||||
|
EPU |
GPR |
GOLD |
EPU |
GPR |
GOLD |
EPU |
GPR |
GOLD |
||||||
|
Australia |
9.961 |
5.180 |
4.929 |
9.585 |
16.063 |
8.619 |
-0.376 |
10.883 |
3.690 |
|||||
|
China |
16.210 |
1.243 |
10.787 |
8.885 |
19.055 |
0.631 |
-7.325 |
17.812 |
-10.156 |
|||||
|
India |
4.143 |
1.994 |
11.282 |
16.700 |
41.985 |
1.327 |
12.556 |
39.991 |
-9.955 |
|||||
|
Japan |
4.746 |
9.113 |
0.048 |
11.887 |
6.965 |
21.955 |
7.141 |
-2.147 |
21.907 |
|||||
|
Russia |
5.857 |
6.927 |
3.535 |
19.691 |
7.768 |
17.487 |
13.833 |
0.841 |
13.952 |
|||||
|
Eurozone |
11.381 |
16.977 |
2.467 |
6.210 |
1.333 |
10.746 |
-5.171 |
-15.644 |
8.279 |
|||||
|
UK |
33.448 |
21.084 |
8.362 |
21.892 |
0.371 |
3.623 |
-11.557 |
-20.714 |
-4.739 |
|||||
|
USA |
12.094 |
20.809 |
10.465 |
6.836 |
1.252 |
0.798 |
-5.258 |
-19.557 |
-9.667 |
|||||
|
Canada |
12.103 |
14.579 |
13.763 |
8.258 |
3.112 |
0.450 |
-3.845 |
-11.466 |
-13.313 |
|||||
In terms of spillover effects, the paper primarily examines the impact paths from the perspectives of In-strength, Out-strength, and Net-strength across different layers. In the In-strength dimension, the UK in Europe exhibits the highest value in the EPU layer, with the Eurozone also showing significant influence in both the EPU and GPR layers. This indicates heightened economic and geopolitical risks in Europe throughout the period. Conversely, the Asia-Pacific region displays varied influence, with China and India reflecting substantial international impact on their gold markets. In the Out-strength dimension, India stands out in the GPR layer with a high value of 41.985. Russia also shows significant influence in the EPU layer. Meanwhile, the USA and Canada exhibit relatively low Out-strength across layers, suggesting a more domestically focused approach in these areas. The Net-strength analysis demonstrate the combined influence. Compared to the emerging Asia-Pacific areas where India and China stand out, European and American countries, despite showing significant inflows and outflows, tend to balance out and often act as net recipients in the global spillover network.
As to inter-layer similarity, the two systemic risks-the EPU and GPR layers-show a strong correlation, reflecting closely connected economic and geopolitical risks. However, the correlation between the GPR and GOLD layers is weaker, suggesting less influential the factor politic is.
|
Closeness |
Betweenness |
PageRank |
|||||||||
|
EPU |
GPR |
GOLD |
EPU |
GPR |
GOLD |
EPU |
GPR |
GOLD |
|||
|
Australia |
0.112 |
0.085 |
0.096 |
0.334 |
0.229 |
0.418 |
0.100 |
0.058 |
0.062 |
||
|
China |
0.099 |
0.095 |
0.105 |
0.448 |
0.381 |
0.598 |
0.187 |
0.057 |
0.115 |
||
|
India |
0.084 |
0.062 |
0.099 |
0.200 |
0.073 |
0.121 |
0.047 |
0.053 |
0.194 |
||
|
Japan |
0.102 |
0.107 |
0.057 |
0.437 |
0.585 |
0.088 |
0.046 |
0.069 |
0.051 |
||
|
Russia |
0.094 |
0.103 |
0.072 |
0.333 |
0.667 |
0.029 |
0.055 |
0.066 |
0.086 |
||
|
Eurozone |
0.111 |
0.093 |
0.094 |
0.476 |
0.220 |
0.506 |
0.086 |
0.236 |
0.057 |
||
|
UK |
0.075 |
0.088 |
0.104 |
0.436 |
0.206 |
0.479 |
0.203 |
0.212 |
0.095 |
||
|
USA |
0.110 |
0.090 |
0.107 |
0.282 |
0.241 |
0.477 |
0.164 |
0.161 |
0.101 |
||
|
Canada |
0.106 |
0.105 |
0.092 |
0.338 |
0.361 |
0.116 |
0.110 |
0.089 |
0.240 |
||
In terms of centrality, closeness centrality, betweenness centrality, and PageRank centrality are examined to assess the status of different regions. At the closeness centrality level, regions like the Eurozone and the USA demonstrate high closeness in the EPU layer, indicating efficient information dissemination, while the UK (0.075) shows lower closeness, suggesting less efficiency despite strong spillover effects. Developed Asia-Pacific countries, such as Australia and Japan, also play important roles. At the betweenness centrality level, China leads in the GOLD layer, serving as a crucial bridge, while Japan is significant in the GPR layer, highlighting the Asia-Pacific region's intermediary role in the global network. At the PageRank centrality level, the UK has strong influence in both systemic risk layers, with scores above 0.2, although its impact on gold market risk is weaker. Similar trends are observed in other European and American countries, which are more central in risk layers, while the Asia-Pacific region gains prominence in gold market volatility.
The inter-layer centrality similarity analysis also shows a strong correlation (0.307) between the economic and geopolitical uncertainty layers similar to edge similarity, particularly in Europe and America. In contrast, the connection between these risks and the gold market is weaker, with more independent central positions and even negative correlations between the GPR and GOLD layers. This indicates that Europe and America are central in risk layers, whereas emerging markets in the Asia-Pacific region show greater influence in the gold market.
|
Edge |
PageRank |
||||
|
Spearman |
Kendall |
Spearman |
Kendall |
||
|
EPU-GPR |
0.307 |
0.307 |
0.074 |
0.053 |
|
|
EPU-GOLD |
0.162 |
0.162 |
0.124 |
0.137 |
|
|
GPR-GOLD |
0.059 |
0.059 |
-0.086 |
-0.081 |
|
4.2. Dynamic-sample analysis
Furthermore, this study investigates the time-varying characteristics using 293 months of monthly data from January 2000 to May 2024, providing a comprehensive analysis of temporal dynamics over an extended period.
The window width and prediction horizon are set to
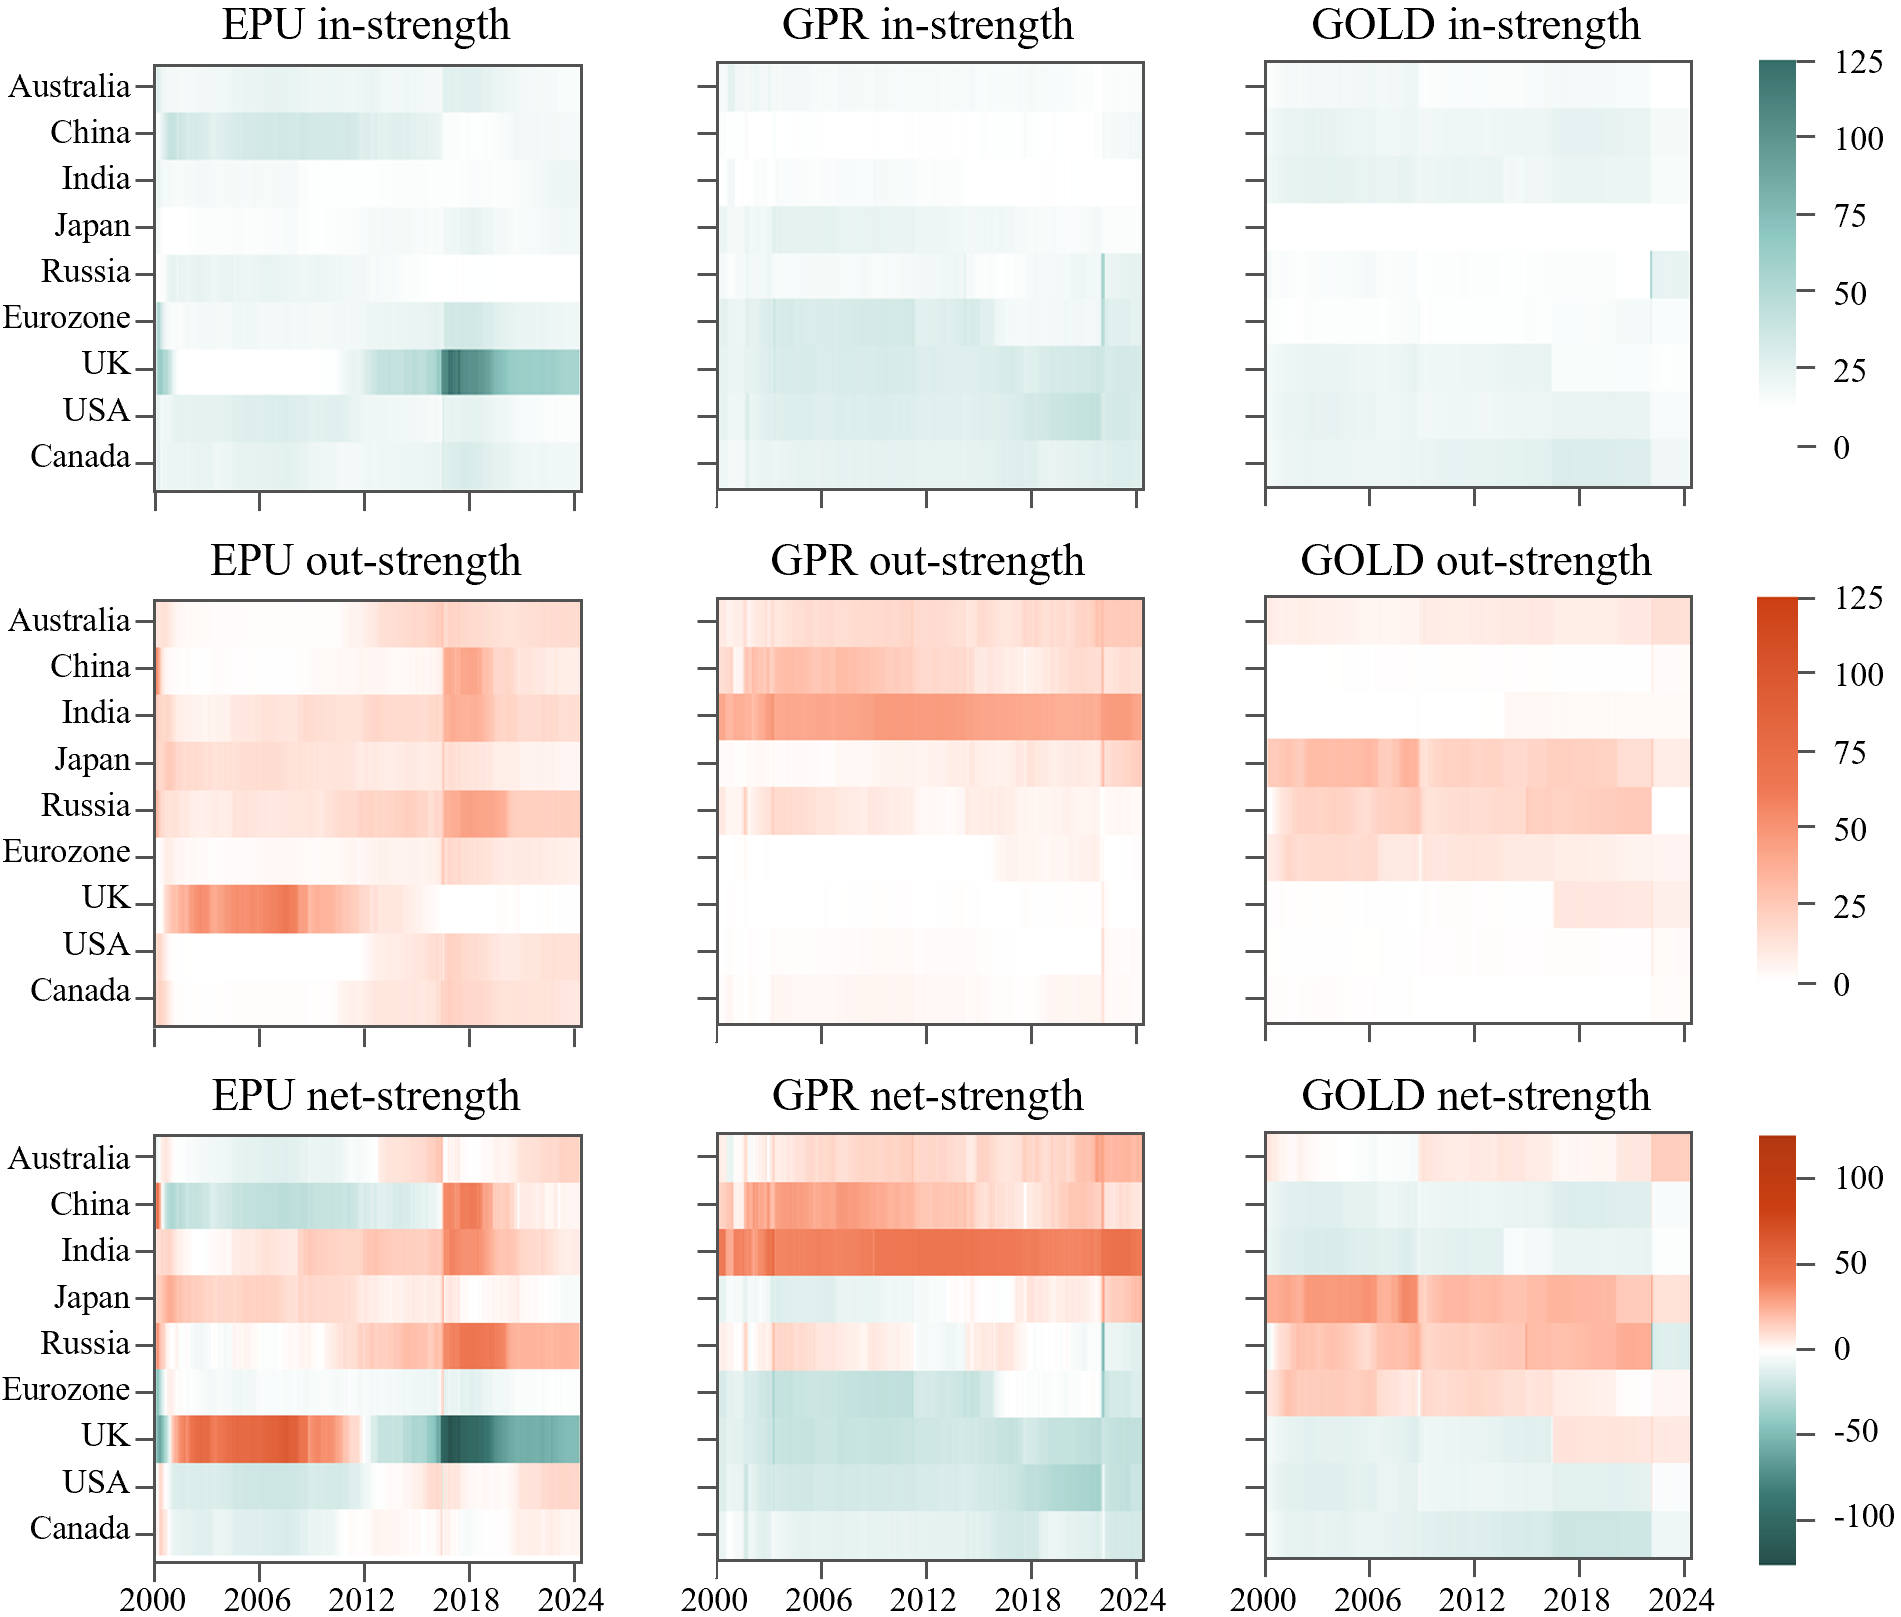
As show in Figure 2, it is evident that events are a crucial factor beyond region. Regarding In-strength, similar to the static analysis, the Asia-Pacific region generally exhibits weaker In-strength over the entire period, while European and American countries are more significantly impacted. Notably, the UK experienced a significant increase in In-strength during the 2008 financial crisis and the 2016 Brexit referendum, indicating that it was most affected by the heightened global economic policy uncertainty during its related events. Additionally, in 2022, Russia and the Eurozone saw a sharp rise in In-strength in the GPR layer, reflecting the geopolitical impact of the Russia-Ukraine conflict. Following this event, Russia’s gold volatility also showed a long-term increase, indicating lasting effects. Regarding Out-strength, prior to the 2008 financial crisis, the UK had the most significant global external influence. While after the crisis, particularly after 2016, emerging Asia-Pacific countries like China, India, and Russia began to exhibit more prominent influence. However, the GPR layer showed stronger country-specific characteristics, with the nature of GPR being more dependent on national attributes, similar to the characteristics observed in the GOLD layer.
Thus, in terms of Net-strength, economic uncertainty risks displayed more variability. Policy adjustments before and after 2008 and 2016 in developed regions and emerging markets caused significant shifts in the global landscape. However, in the geopolitical and gold layers, countries generally maintained consistent characteristics. The former saw greater influence from emerging countries, while the latter remained dominated by developed nations.
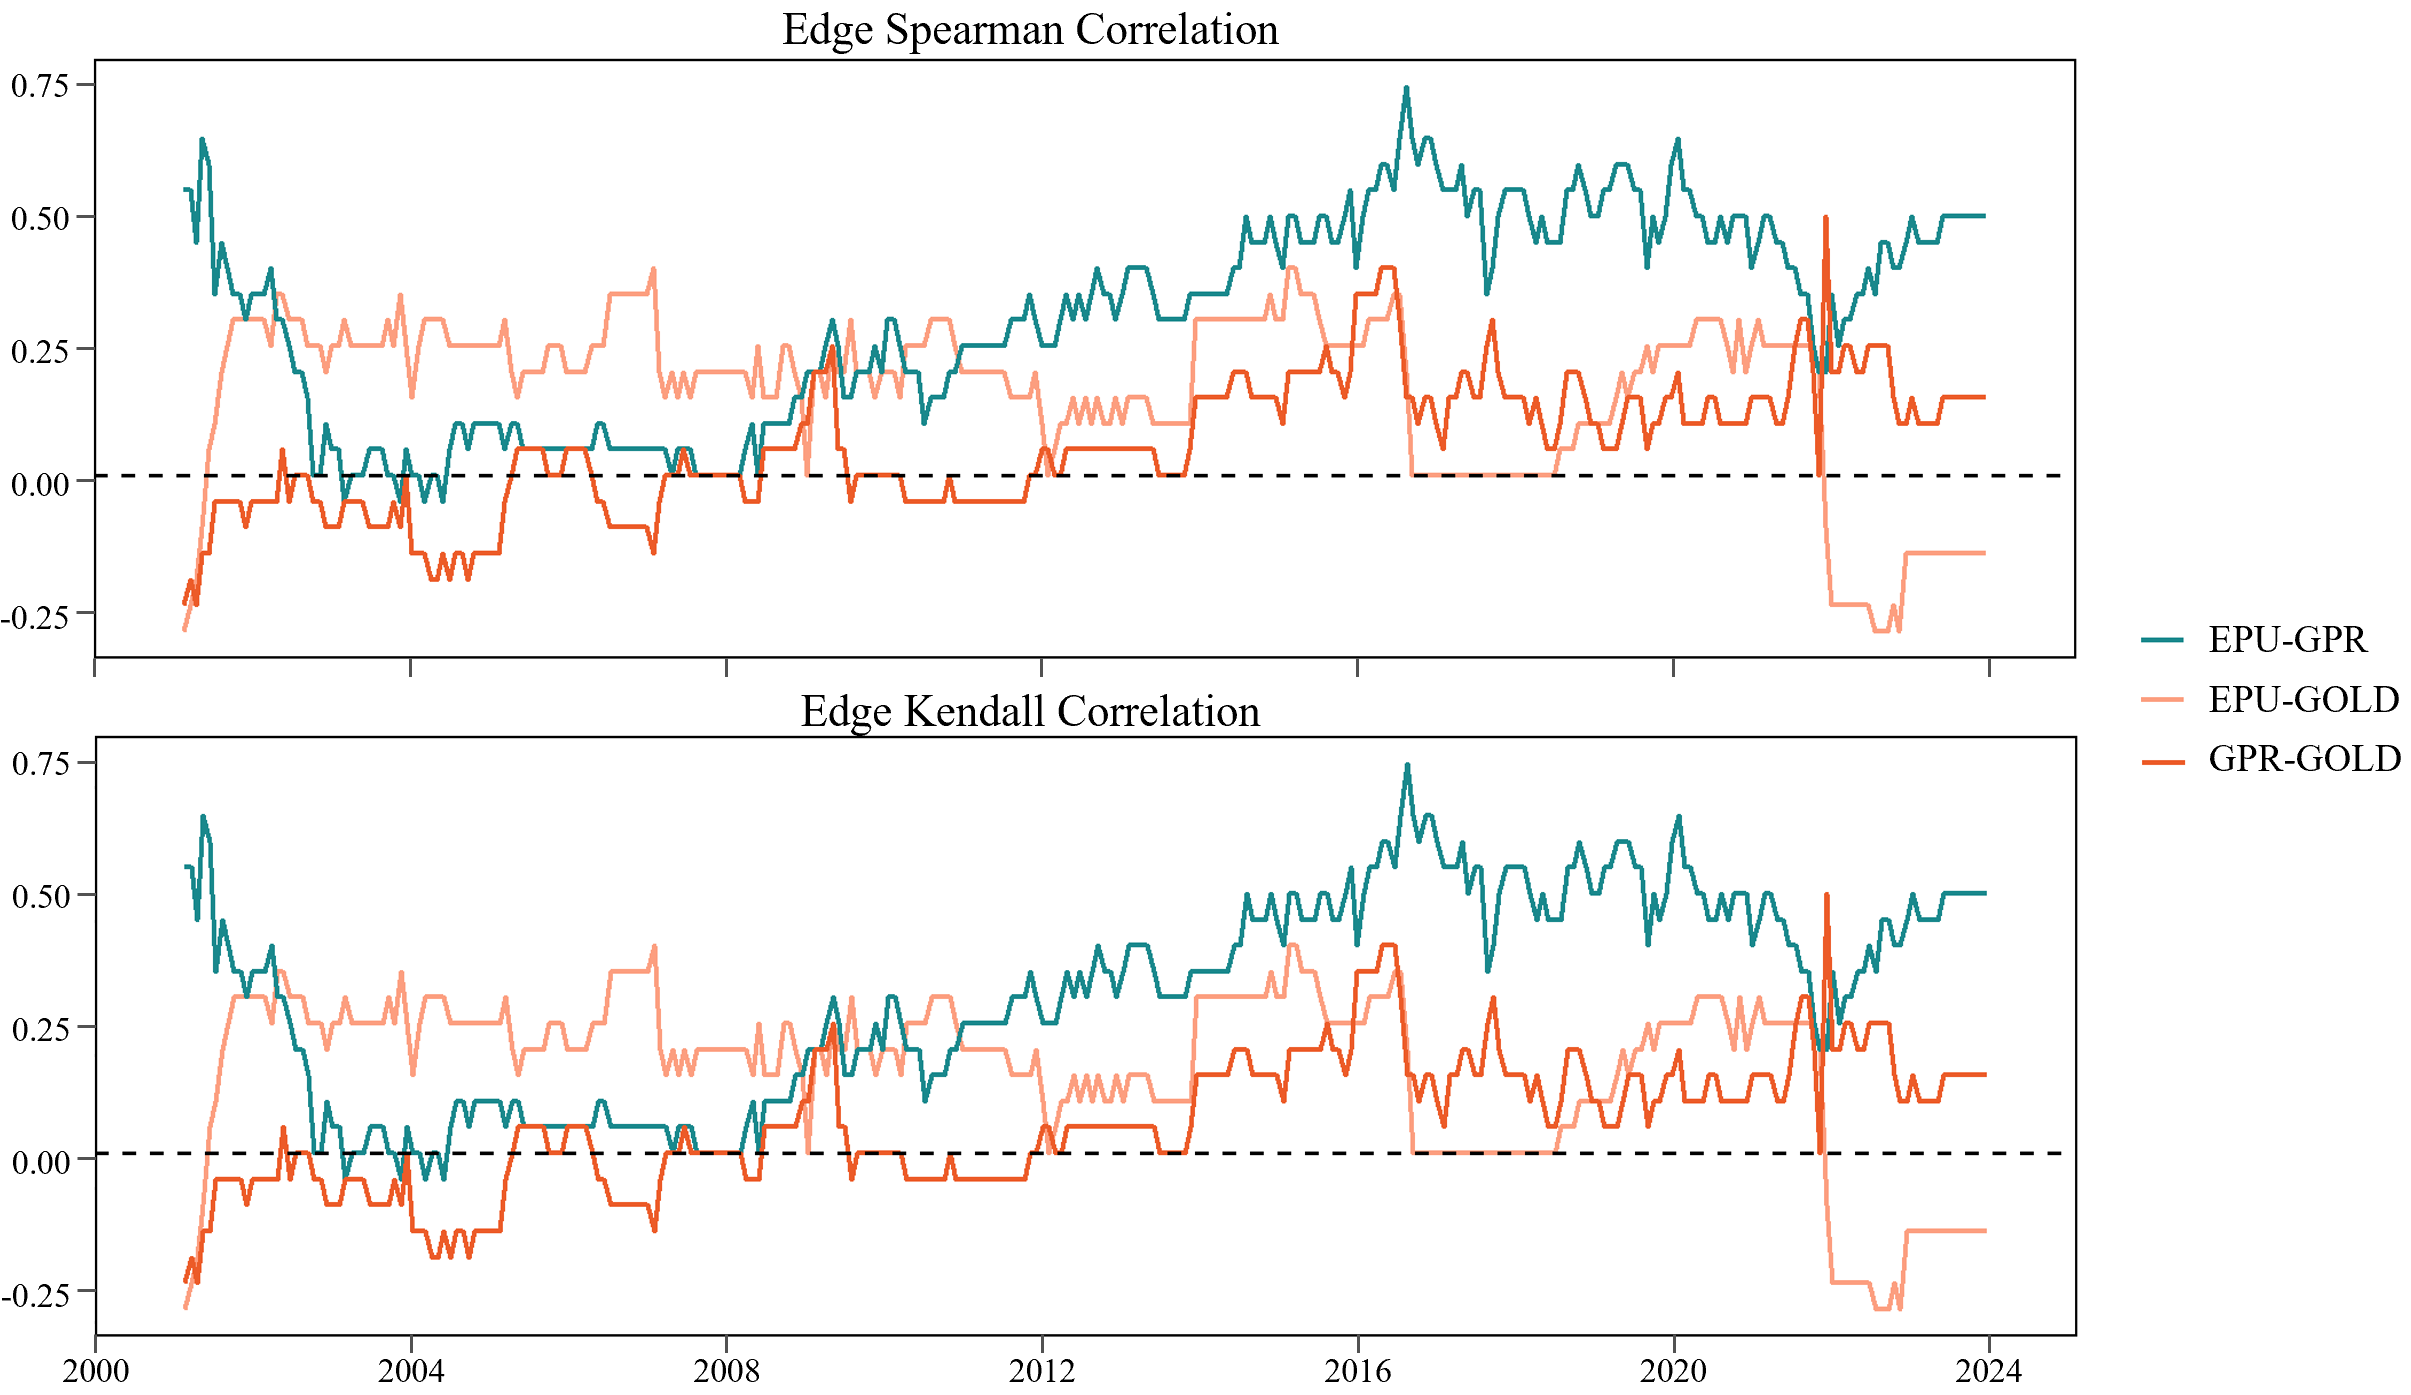
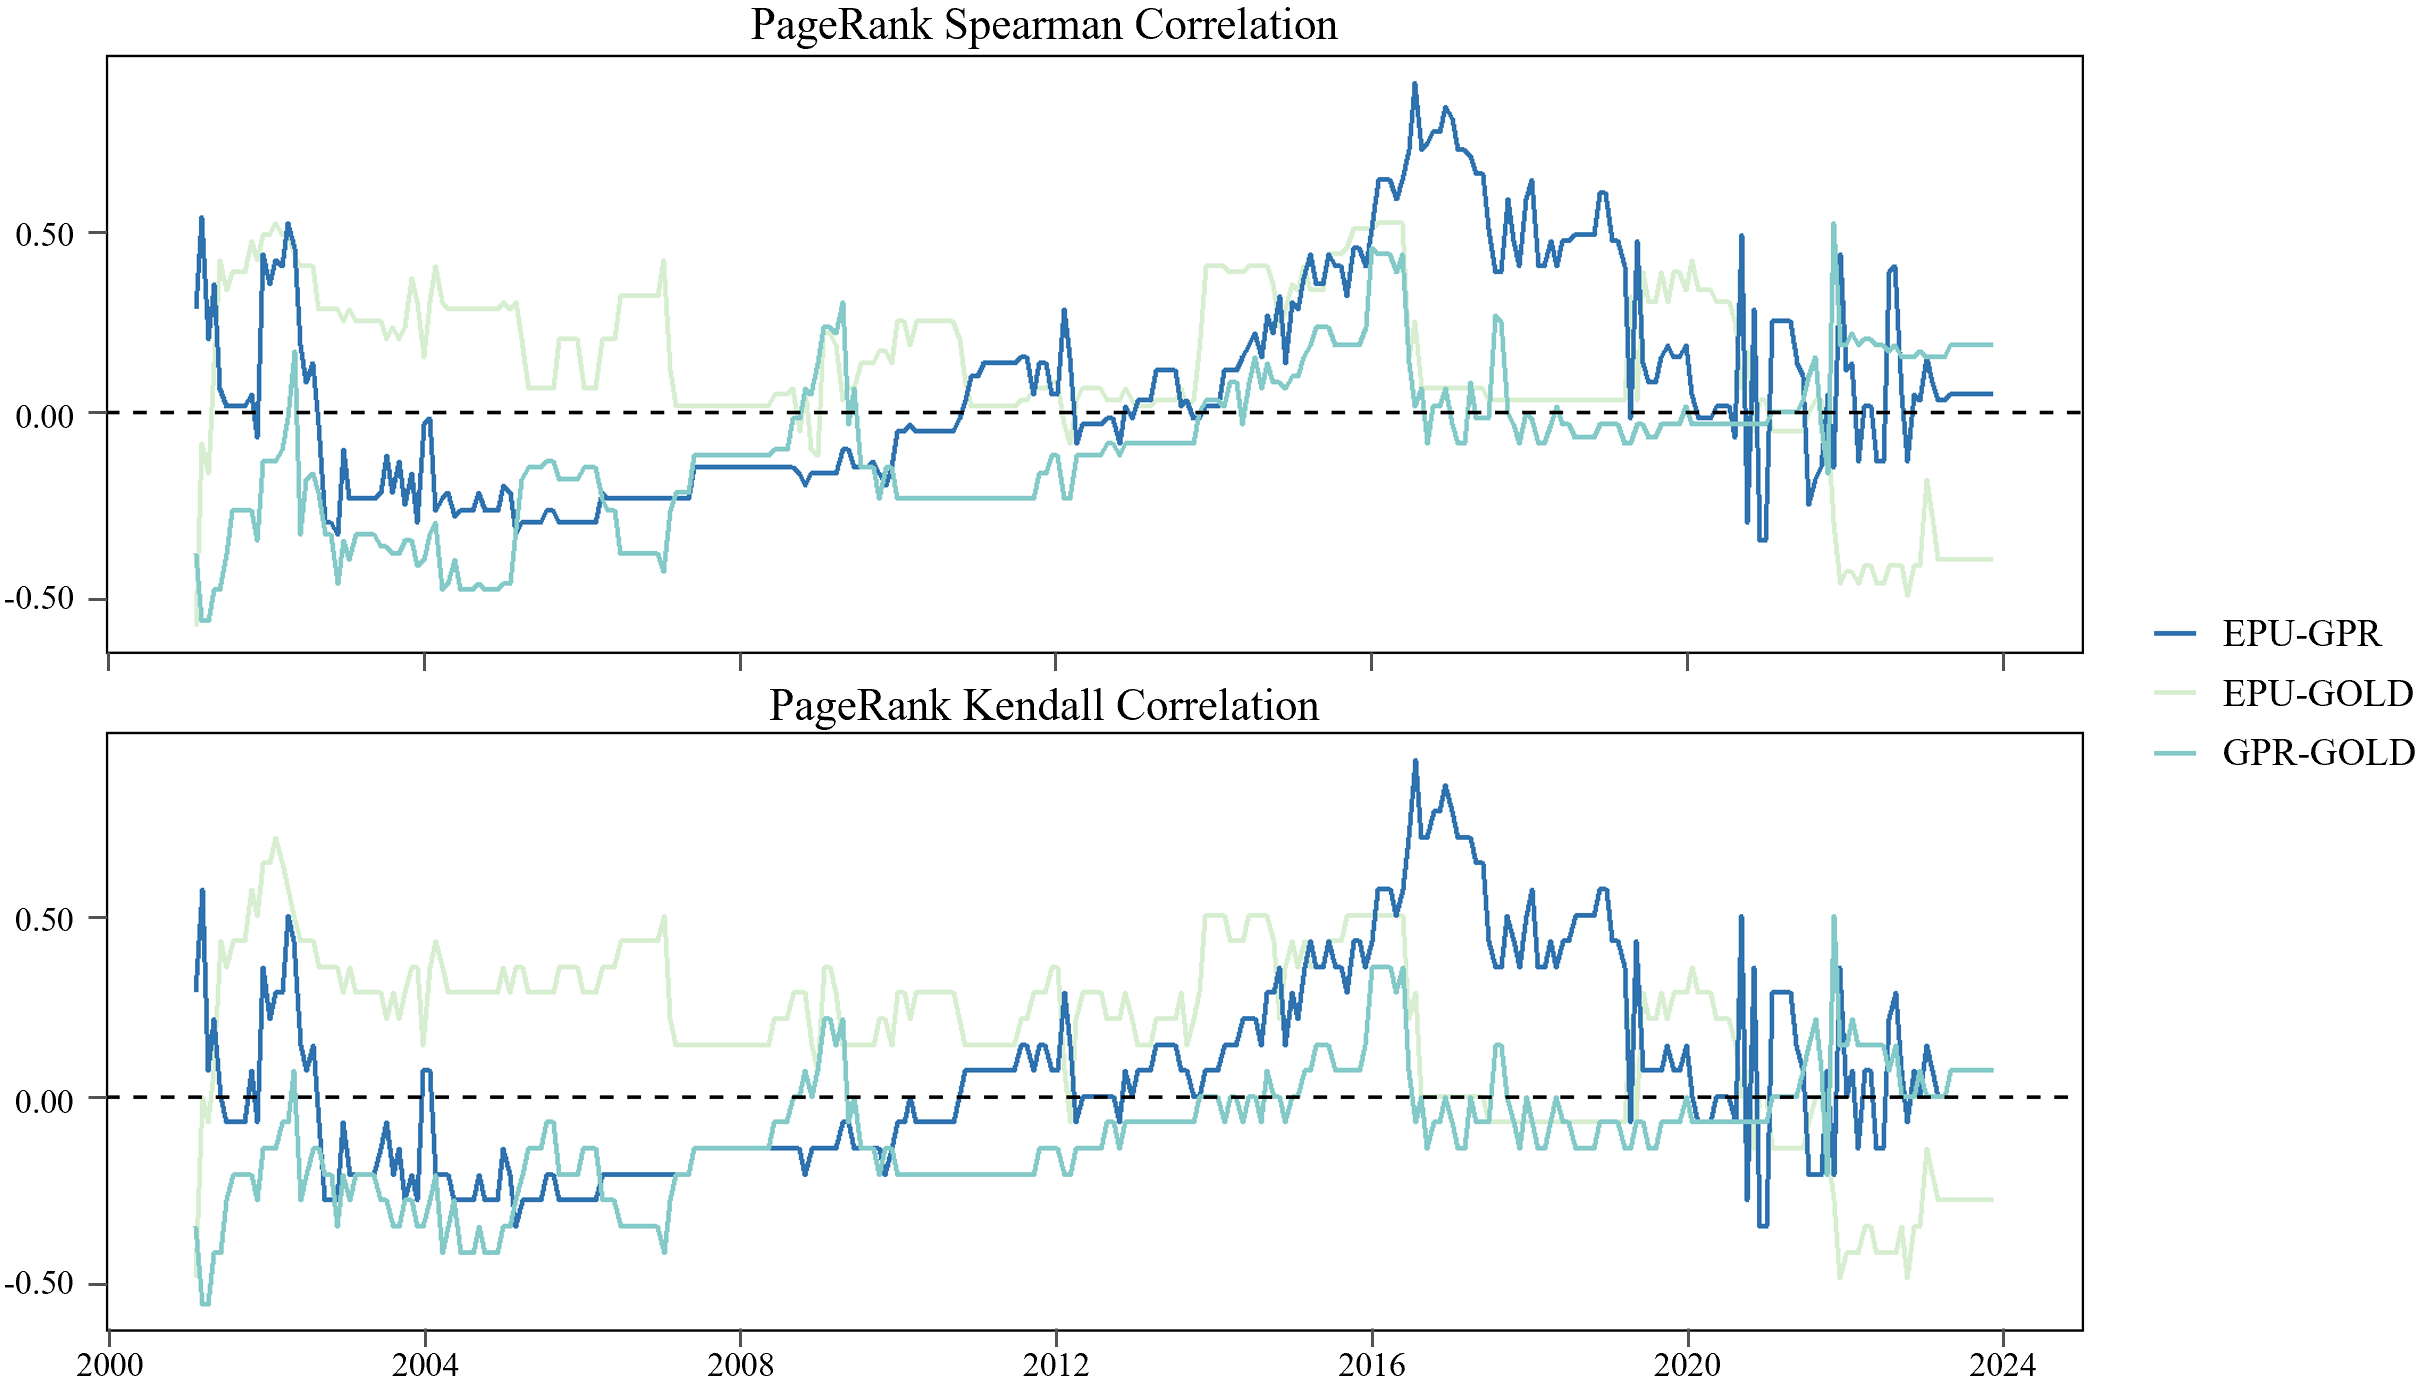
In the Spearman and Kendall rank correlations, the overall correlation is positive. The correlation between EPU and GPR significantly strengthened during the 2008 financial crisis, indicating a high level of interdependence between these two systemic during major events. In terms of their connection to the gold market, both EPU and GPR correlations surged during major events such as 9/11, the financial crisis, the European debt crisis, and the Russia-Ukraine conflict. Although the correlation between EPU and the GOLD layer was initially higher but sharply turned negative after the 2022 pandemic, the correlation between GPR and GOLD, while initially low, gradually increased after 2008.
Dynamic analysis reveals that the roles and influence of countries within the global network have changed significantly over time and with events. The Asia-Pacific region, particularly China and India, has transitioned from being receivers to becoming important transmitters in the global network as international events progressed. In contrast, European and American countries tend to balance their spillover effects during relatively stable periods. Inter-layer similarity analysis further highlights the close link between economic policy and geopolitical risks while also reflecting the independence of the gold market.
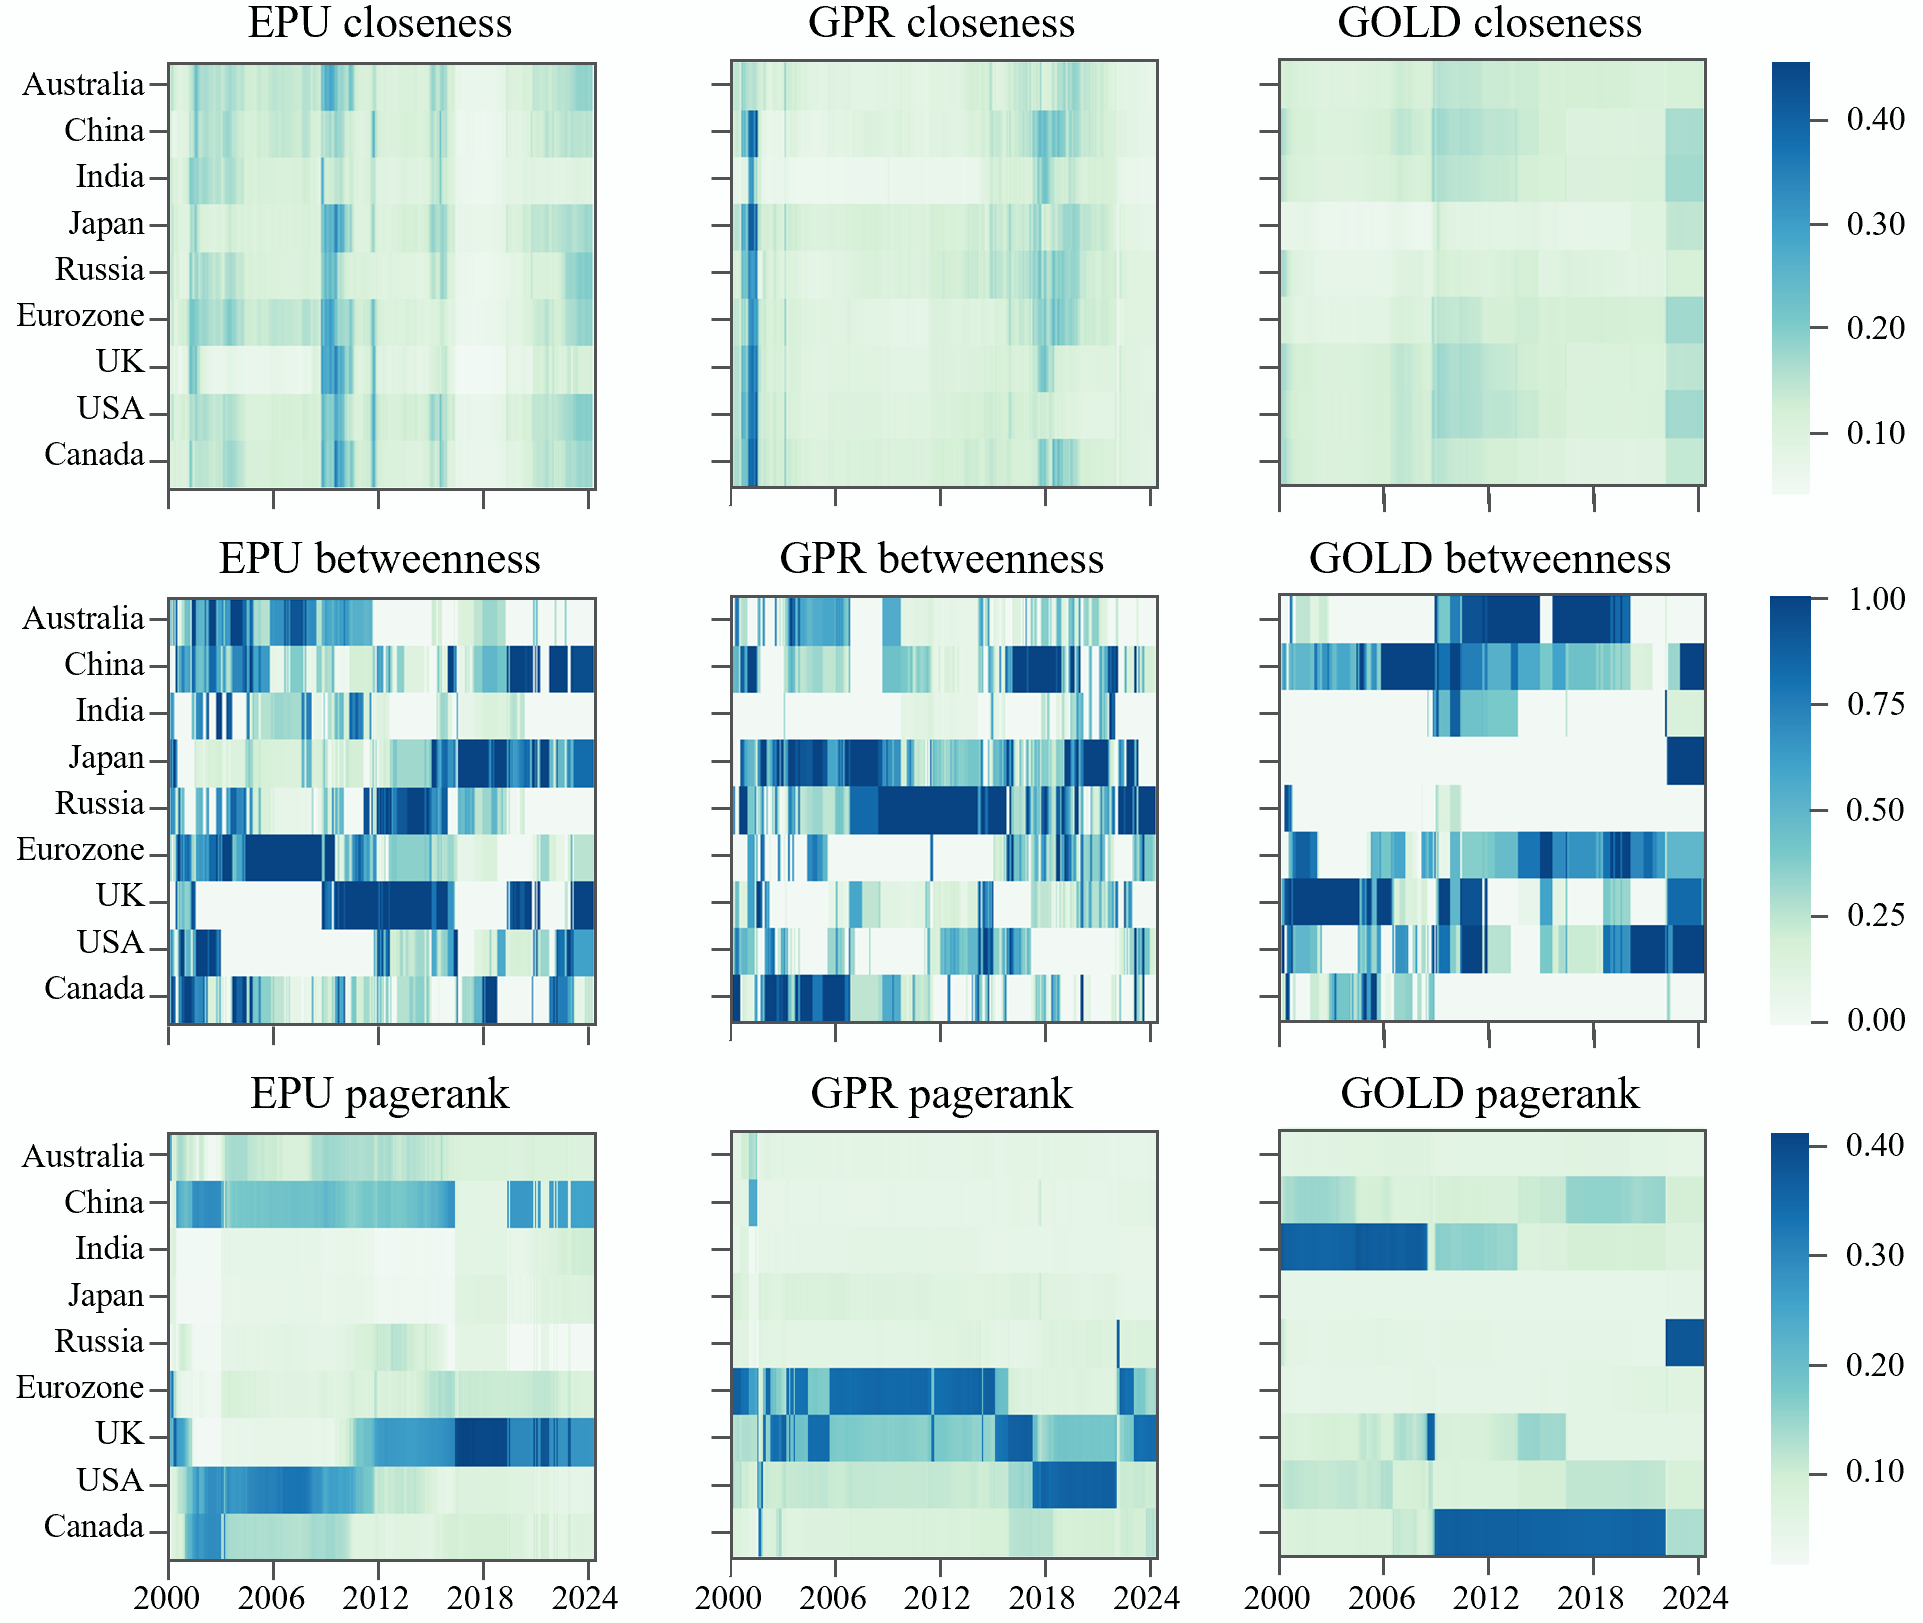
In terms of closeness centrality, countries show significant increases in the EPU layer during the 2008 financial crisis, the 2016 Brexit, and the 2022 pandemic. While the GPR layer reacts strongly around the 9/11 attacks, its impact on the GOLD layer remains relatively stable except during the financial crisis. However, in betweenness centrality, after standardization, roles shift significantly with localized shocks. Overall, emerging Asia-Pacific countries act as intermediaries in systemic risks, while developed countries like Australia, the Eurozone, and the USA dominate in transmitting gold market volatility. Regarding PageRank influence, despite the UK's rising EPU influence post-Brexit and Russia's increased GOLD influence after the 2022 conflict, developed Western countries still primarily lead the market, with notable emerging country influence only in specific periods. The PageRank indicators for the UK and Eurozone in the GPR layer rose significantly during the 2008 financial crisis, indicating their increased importance in global geopolitical risk.
Inter-layer similarity shows that while there have been recent fluctuations, the PageRank similarity between two risk layers remains high, particularly the increase during the 2008 financial crisis, reflecting increased global interconnectedness. However, the similarity between the EPU, GPR and GOLD layers is low, indicating weak direct linkage between risks and gold market volatility.
5. Conclusion
To conduct a comprehensive and systematic inquiry into the interaction of economic and political uncertainty risks and gold market volatility, this paper built a multiplex network model based on spillover effect. The full-sample and dynamic-sample analyses underscore the intricate interplay between economic policy uncertainty, geopolitical risk, and gold market volatility. Key economies exhibit distinct roles and responses, reflecting their strategic positions and adaptability during major global events. The UK and Eurozone show strong influence in EPU, while China and India are significant in GOLD. Emerging Asia-Pacific countries increasingly influence global networks, while developed Western countries dominate systemic risks and gold market volatility. Time-varying analysis reveals shifts in influence, particularly during major events like the 2008 financial crisis and 2022 Russia-Ukraine conflict. Inter-layer correlations indicate strong connections between economic and geopolitical risks but weaker ties to the gold market.
However, the proposed multilayer network analysis overlooks the inter-layer spillover effects, which could be further explored within an interdependent structure. Additionally, the mechanisms of the system are primarily discussed through topological features and correlations. Future research could extend this analysis to examine model resilience, percolation, and synchronization, drawing on similar methodologies used in medical research to provide a more comprehensive understanding of the system's dynamics and robustness.
References
[1]. Gong, J., Wang, G. J., Zhou, Y., Zhu, Y., Xie, C., & Foglia, M. (2023). Spreading of cross-market volatility information: Evidence from multiplex network analysis of volatility spillovers. Journal of International Financial Markets, Institutions and Money, 83, 101733.
[2]. Baker, S. R., Bloom, N., & Davis, S. J. (2016). Measuring economic policy uncertainty. The quarterly journal of economics, 131(4), 1593-1636.
[3]. Flint, C. (2021). Introduction to geopolitics. Routledge.
[4]. Caldara, D., & Iacoviello, M. (2022). Measuring geopolitical risk. American Economic Review, 112(4), 1194-1225.
[5]. Balli, F., Balli, H. O., Hasan, M., & Gregory-Allen, R. (2022). Geopolitical risk spillovers and its determinants. The Annals of Regional Science, 68(2), 463-500.
[6]. Antonakakis, N., Gupta, R., Kollias, C., & Papadamou, S. (2017). Geopolitical risks and the oil-stock nexus over 1899–2016. Finance Research Letters, 23, 165-173.
[7]. Bouoiyour, J., Selmi, R., Hammoudeh, S., & Wohar, M. E. (2019). What are the categories of geopolitical risks that could drive oil prices higher? Acts or threats?. Energy Economics, 84, 104523.
[8]. Liu, T., Nakajima, T., & Hamori, S. (2021). The impact of economic uncertainty caused by COVID-19 on renewable energy stocks. Empirical Economics, 1-21.
[9]. Zhang, Z., Wang, Y., & Li, B. (2023). Asymmetric spillover of geopolitical risk and oil price volatility: a global perspective. Resources Policy, 83, 103701.
[10]. Jin, Y., Zhao, H., Bu, L., & Zhang, D. (2023). Geopolitical risk, climate risk and energy markets: A dynamic spillover analysis. International Review of Financial Analysis, 87, 102597.
[11]. Lucey, B. M., Larkin, C., & O’Connor, F. (2014). Gold markets around the world–who spills over what, to whom, when?. Applied Economics Letters, 21(13), 887-892.
[12]. Beckmann, J., Berger, T., & Czudaj, R. (2015). Does gold act as a hedge or a safe haven for stocks? A smooth transition approach. Economic Modelling, 48, 16-24.
[13]. Li, Y., Huang, J., & Chen, J. (2021). Dynamic spillovers of geopolitical risks and gold prices: New evidence from 18 emerging economies. Resources Policy, 70, 101938.
[14]. Triki, M. B., & Maatoug, A. B. (2021). The GOLD market as a safe haven against the stock market uncertainty: Evidence from geopolitical risk. Resources Policy, 70, 101872.
[15]. Baur, D. G., & Smales, L. A. (2020). Hedging geopolitical risk with precious metals. Journal of Banking & Finance, 117, 105823.
[16]. Zhu, X., Zhang, S., & Ding, Q. (2024). Does extreme climate change drive the connectedness among global gold markets? Evidence from TVP-VAR and causality-in-quantiles techniques. Resources Policy, 91, 104899.
[17]. Yu, S. Y., Yu, C. F. & Wei, J. L.. (2024). Global political and economic uncertainty and gold price volatility - An empirical study based on GARCH-MIDAS model. Quantitative Economic Research (01), 132-152. doi: 10.16699/b.cnki.jqe.2024.01.001.
[18]. Wang, Y. S., & Chueh, Y. L. (2013). Dynamic transmission effects between the interest rate, the US dollar, and gold and crude oil prices. Economic Modelling, 30, 792-798.
[19]. Giannellis, N., & Koukouritakis, M. (2019). Gold price and exchange rates: A panel smooth transition regression model for the G7 countries. The North American Journal of Economics and Finance, 49, 27-46.
[20]. Aziz, T., & Hussain, A. (2021). Volatility spillovers of gold prices, oil prices, and economic policy uncertainty on the stock market of Pakistan. Global Business and Economics Review, 24(4), 344-359.
[21]. Raza, S. A., Shah, N., & Shahbaz, M. (2018). Does economic policy uncertainty influence gold prices? Evidence from a nonparametric causality-in-quantiles approach. Resources Policy, 57, 61-68.
[22]. Fang, L., Chen, B., Yu, H., & Qian, Y. (2018). The importance of global economic policy uncertainty in predicting gold futures market volatility: A GARCH‐MIDAS approach. Journal of Futures Markets, 38(3), 413-422.
[23]. Diebold, F. X., & Yilmaz, K. (2012). Better to give than to receive: Predictive directional measurement of volatility spillovers. International Journal of forecasting, 28(1), 57-66.
[24]. Diebold, F. X., & Yılmaz, K. (2014). On the network topology of variance decompositions: Measuring the connectedness of financial firms. Journal of econometrics, 182(1), 119-134.
[25]. Zhang, W., Zhuang, X., & Lu, Y. (2020). Spatial spillover effects and risk contagion around G20 stock markets based on volatility network. The North American Journal of Economics and Finance, 51, 101064.
[26]. Wang, Z., Gao, X., An, H., Tang, R., & Sun, Q. (2020). Identifying influential energy stocks based on spillover network. International Review of Financial Analysis, 68, 101277.
[27]. Ouyang, Z. Y., Qin, Z., Cao, H., Xie, T. Y., Dai, X. Y., & Wang, Q. W. (2021). A spillover network analysis of the global crude oil market: Evidence from the post-financial crisis era. Petroleum Science, 18(4), 1256-1269.
[28]. Dong, Q., Zhao, Y., Ma, X., & Zhou, Y. (2024). Risk spillover between carbon markets and stock markets from a progressive perspective: Measurements, spillover networks, and driving factors. Energy Economics, 129, 107228.
[29]. Li, S. W., Wang, L., & Gong, C. (2020). A Research Approach to Complex Financial Systems - Multilayer Network Theory. Journal of Systems Science (01), 40-44.
[30]. Boccaletti, S., Bianconi, G., Criado, R., Del Genio, C. I., Gómez-Gardenes, J., Romance, M., ... & Zanin, M. (2014). The structure and dynamics of multilayer networks. Physics reports, 544(1), 1-122.
[31]. de la Concha, A., Martinez-Jaramillo, S., & Carmona, C. (2018). Multiplex financial networks: Revealing the level of interconnectedness in the banking system. In Complex Networks & Their Applications VI: Proceedings of Complex Networks 2017 (The Sixth International Conference on Complex Networks and Their Applications) (pp. 1135-1148). Springer International Publishing.
[32]. Cao, J., Wen, F., Stanley, H. E., & Wang, X. (2021). Multilayer financial networks and systemic importance: Evidence from China. International Review of Financial Analysis, 78, 101882.
[33]. Wang, G. J., Chen, Y. Y., Si, H. B., Xie, C., & Chevallier, J. (2021). Multilayer information spillover networks analysis of China’s financial institutions based on variance decompositions. International Review of Economics & Finance, 73, 325-347.
[34]. Ouyang, Z., Zhou, X., & Lai, Y. (2023). Global stock markets risk contagion: Evidence from multilayer connectedness networks in the frequency domain. The North American Journal of Economics and Finance, 68, 101973.
[35]. Wang, G. J., Wan, L., Feng, Y., Xie, C., Uddin, G. S., & Zhu, Y. (2023). Interconnected multilayer networks: Quantifying connectedness among global stock and foreign exchange markets. International Review of Financial Analysis, 86, 102518.
[36]. Xiang, Y., & Borjigin, S. (2024). Multilayer networks for measuring interconnectedness among global stock markets through the lens of trading volume-price relationship. Global Finance Journal, 101006.
[37]. Wang, G. J., Xiong, L., Zhu, Y., Xie, C., & Foglia, M. (2022). Multilayer network analysis of investor sentiment and stock returns. Research in International Business and Finance, 62, 101707.
[38]. Zhu, B., Deng, Y., & Hu, X. (2023). Global energy security: do internal and external risk spillovers matter? A multilayer network method. Energy Economics, 126, 106961.
[39]. Diebold, F. X., & Yilmaz, K. (2009). Measuring financial asset return and volatility spillovers, with application to global equity markets. The Economic Journal, 119(534), 158-171.
[40]. Koop, G., Pesaran, M. H., & Potter, S. M. (1996). Impulse response analysis in nonlinear multivariate models. Journal of econometrics, 74(1), 119-147.
[41]. Pesaran, H. H., & Shin, Y. (1998). Generalized impulse response analysis in linear multivariate models. Economics letters, 58(1), 17-29.
Cite this article
Xu,X. (2025). Economic, Political Uncertainty Risks and Gold Market Volatility: Evidence from Multiplex Network Analysis of Global Spillovers. Advances in Economics, Management and Political Sciences,198,28-42.
Data availability
The datasets used and/or analyzed during the current study will be available from the authors upon reasonable request.
Disclaimer/Publisher's Note
The statements, opinions and data contained in all publications are solely those of the individual author(s) and contributor(s) and not of EWA Publishing and/or the editor(s). EWA Publishing and/or the editor(s) disclaim responsibility for any injury to people or property resulting from any ideas, methods, instructions or products referred to in the content.
About volume
Volume title: Proceedings of the 3rd International Conference on Financial Technology and Business Analysis
© 2024 by the author(s). Licensee EWA Publishing, Oxford, UK. This article is an open access article distributed under the terms and
conditions of the Creative Commons Attribution (CC BY) license. Authors who
publish this series agree to the following terms:
1. Authors retain copyright and grant the series right of first publication with the work simultaneously licensed under a Creative Commons
Attribution License that allows others to share the work with an acknowledgment of the work's authorship and initial publication in this
series.
2. Authors are able to enter into separate, additional contractual arrangements for the non-exclusive distribution of the series's published
version of the work (e.g., post it to an institutional repository or publish it in a book), with an acknowledgment of its initial
publication in this series.
3. Authors are permitted and encouraged to post their work online (e.g., in institutional repositories or on their website) prior to and
during the submission process, as it can lead to productive exchanges, as well as earlier and greater citation of published work (See
Open access policy for details).
References
[1]. Gong, J., Wang, G. J., Zhou, Y., Zhu, Y., Xie, C., & Foglia, M. (2023). Spreading of cross-market volatility information: Evidence from multiplex network analysis of volatility spillovers. Journal of International Financial Markets, Institutions and Money, 83, 101733.
[2]. Baker, S. R., Bloom, N., & Davis, S. J. (2016). Measuring economic policy uncertainty. The quarterly journal of economics, 131(4), 1593-1636.
[3]. Flint, C. (2021). Introduction to geopolitics. Routledge.
[4]. Caldara, D., & Iacoviello, M. (2022). Measuring geopolitical risk. American Economic Review, 112(4), 1194-1225.
[5]. Balli, F., Balli, H. O., Hasan, M., & Gregory-Allen, R. (2022). Geopolitical risk spillovers and its determinants. The Annals of Regional Science, 68(2), 463-500.
[6]. Antonakakis, N., Gupta, R., Kollias, C., & Papadamou, S. (2017). Geopolitical risks and the oil-stock nexus over 1899–2016. Finance Research Letters, 23, 165-173.
[7]. Bouoiyour, J., Selmi, R., Hammoudeh, S., & Wohar, M. E. (2019). What are the categories of geopolitical risks that could drive oil prices higher? Acts or threats?. Energy Economics, 84, 104523.
[8]. Liu, T., Nakajima, T., & Hamori, S. (2021). The impact of economic uncertainty caused by COVID-19 on renewable energy stocks. Empirical Economics, 1-21.
[9]. Zhang, Z., Wang, Y., & Li, B. (2023). Asymmetric spillover of geopolitical risk and oil price volatility: a global perspective. Resources Policy, 83, 103701.
[10]. Jin, Y., Zhao, H., Bu, L., & Zhang, D. (2023). Geopolitical risk, climate risk and energy markets: A dynamic spillover analysis. International Review of Financial Analysis, 87, 102597.
[11]. Lucey, B. M., Larkin, C., & O’Connor, F. (2014). Gold markets around the world–who spills over what, to whom, when?. Applied Economics Letters, 21(13), 887-892.
[12]. Beckmann, J., Berger, T., & Czudaj, R. (2015). Does gold act as a hedge or a safe haven for stocks? A smooth transition approach. Economic Modelling, 48, 16-24.
[13]. Li, Y., Huang, J., & Chen, J. (2021). Dynamic spillovers of geopolitical risks and gold prices: New evidence from 18 emerging economies. Resources Policy, 70, 101938.
[14]. Triki, M. B., & Maatoug, A. B. (2021). The GOLD market as a safe haven against the stock market uncertainty: Evidence from geopolitical risk. Resources Policy, 70, 101872.
[15]. Baur, D. G., & Smales, L. A. (2020). Hedging geopolitical risk with precious metals. Journal of Banking & Finance, 117, 105823.
[16]. Zhu, X., Zhang, S., & Ding, Q. (2024). Does extreme climate change drive the connectedness among global gold markets? Evidence from TVP-VAR and causality-in-quantiles techniques. Resources Policy, 91, 104899.
[17]. Yu, S. Y., Yu, C. F. & Wei, J. L.. (2024). Global political and economic uncertainty and gold price volatility - An empirical study based on GARCH-MIDAS model. Quantitative Economic Research (01), 132-152. doi: 10.16699/b.cnki.jqe.2024.01.001.
[18]. Wang, Y. S., & Chueh, Y. L. (2013). Dynamic transmission effects between the interest rate, the US dollar, and gold and crude oil prices. Economic Modelling, 30, 792-798.
[19]. Giannellis, N., & Koukouritakis, M. (2019). Gold price and exchange rates: A panel smooth transition regression model for the G7 countries. The North American Journal of Economics and Finance, 49, 27-46.
[20]. Aziz, T., & Hussain, A. (2021). Volatility spillovers of gold prices, oil prices, and economic policy uncertainty on the stock market of Pakistan. Global Business and Economics Review, 24(4), 344-359.
[21]. Raza, S. A., Shah, N., & Shahbaz, M. (2018). Does economic policy uncertainty influence gold prices? Evidence from a nonparametric causality-in-quantiles approach. Resources Policy, 57, 61-68.
[22]. Fang, L., Chen, B., Yu, H., & Qian, Y. (2018). The importance of global economic policy uncertainty in predicting gold futures market volatility: A GARCH‐MIDAS approach. Journal of Futures Markets, 38(3), 413-422.
[23]. Diebold, F. X., & Yilmaz, K. (2012). Better to give than to receive: Predictive directional measurement of volatility spillovers. International Journal of forecasting, 28(1), 57-66.
[24]. Diebold, F. X., & Yılmaz, K. (2014). On the network topology of variance decompositions: Measuring the connectedness of financial firms. Journal of econometrics, 182(1), 119-134.
[25]. Zhang, W., Zhuang, X., & Lu, Y. (2020). Spatial spillover effects and risk contagion around G20 stock markets based on volatility network. The North American Journal of Economics and Finance, 51, 101064.
[26]. Wang, Z., Gao, X., An, H., Tang, R., & Sun, Q. (2020). Identifying influential energy stocks based on spillover network. International Review of Financial Analysis, 68, 101277.
[27]. Ouyang, Z. Y., Qin, Z., Cao, H., Xie, T. Y., Dai, X. Y., & Wang, Q. W. (2021). A spillover network analysis of the global crude oil market: Evidence from the post-financial crisis era. Petroleum Science, 18(4), 1256-1269.
[28]. Dong, Q., Zhao, Y., Ma, X., & Zhou, Y. (2024). Risk spillover between carbon markets and stock markets from a progressive perspective: Measurements, spillover networks, and driving factors. Energy Economics, 129, 107228.
[29]. Li, S. W., Wang, L., & Gong, C. (2020). A Research Approach to Complex Financial Systems - Multilayer Network Theory. Journal of Systems Science (01), 40-44.
[30]. Boccaletti, S., Bianconi, G., Criado, R., Del Genio, C. I., Gómez-Gardenes, J., Romance, M., ... & Zanin, M. (2014). The structure and dynamics of multilayer networks. Physics reports, 544(1), 1-122.
[31]. de la Concha, A., Martinez-Jaramillo, S., & Carmona, C. (2018). Multiplex financial networks: Revealing the level of interconnectedness in the banking system. In Complex Networks & Their Applications VI: Proceedings of Complex Networks 2017 (The Sixth International Conference on Complex Networks and Their Applications) (pp. 1135-1148). Springer International Publishing.
[32]. Cao, J., Wen, F., Stanley, H. E., & Wang, X. (2021). Multilayer financial networks and systemic importance: Evidence from China. International Review of Financial Analysis, 78, 101882.
[33]. Wang, G. J., Chen, Y. Y., Si, H. B., Xie, C., & Chevallier, J. (2021). Multilayer information spillover networks analysis of China’s financial institutions based on variance decompositions. International Review of Economics & Finance, 73, 325-347.
[34]. Ouyang, Z., Zhou, X., & Lai, Y. (2023). Global stock markets risk contagion: Evidence from multilayer connectedness networks in the frequency domain. The North American Journal of Economics and Finance, 68, 101973.
[35]. Wang, G. J., Wan, L., Feng, Y., Xie, C., Uddin, G. S., & Zhu, Y. (2023). Interconnected multilayer networks: Quantifying connectedness among global stock and foreign exchange markets. International Review of Financial Analysis, 86, 102518.
[36]. Xiang, Y., & Borjigin, S. (2024). Multilayer networks for measuring interconnectedness among global stock markets through the lens of trading volume-price relationship. Global Finance Journal, 101006.
[37]. Wang, G. J., Xiong, L., Zhu, Y., Xie, C., & Foglia, M. (2022). Multilayer network analysis of investor sentiment and stock returns. Research in International Business and Finance, 62, 101707.
[38]. Zhu, B., Deng, Y., & Hu, X. (2023). Global energy security: do internal and external risk spillovers matter? A multilayer network method. Energy Economics, 126, 106961.
[39]. Diebold, F. X., & Yilmaz, K. (2009). Measuring financial asset return and volatility spillovers, with application to global equity markets. The Economic Journal, 119(534), 158-171.
[40]. Koop, G., Pesaran, M. H., & Potter, S. M. (1996). Impulse response analysis in nonlinear multivariate models. Journal of econometrics, 74(1), 119-147.
[41]. Pesaran, H. H., & Shin, Y. (1998). Generalized impulse response analysis in linear multivariate models. Economics letters, 58(1), 17-29.