


1. Introduction
The new energy vehicle (NEV) market in China has grown quickly, making it one of the biggest in the world. Significant improvements in legislation, technology, infrastructure, industrial chain, and market development have resulted from the Chinese government's crucial support and promotion of the NEV sector. Against the backdrop of a transforming global energy structure and a digital green economy, the demand for new energy vehicles has grown compared to traditional fuel vehicles, clearly indicating a trend toward replacing them [1]. Therefore, accurately predicting new energy vehicle sales is crucial for future trends in the automotive industry. It provides strong data support for industrial planning, policy formulation, and adjustment. This information is important for promoting high-quality development in the industry [2].
International Energy Agency (IEA) data indicates that over 14 million new energy vehicles were sold worldwide in 2023. Over 60% of global sales of NEVs came from China, the largest market in the world, indicating strong industrial vitality. As per the data provided by the China Association of Automobile Manufacturers, China sold just 17,000 new energy vehicles annually in 2013. The yearly sales reached 1.256 million units by 2018. The number of new energy cars sold in China increased from 9.495 million units in 2023 to 12.866 million units in 2024. Experts predict that this figure could exceed 16 million units by the end of 2025, setting a new record high. In just over a decade, the sales of new energy vehicles have increased nearly a thousandfold and continue to grow rapidly [3]. 2025 marks a critical turning point for new energy vehicles, shifting from policy-driven growth to market competition. Chinese automotive companies must consolidate their supply chain advantages, enhance technological breakthroughs, and reduce manufacturing costs; China will collaborate with other countries worldwide to tackle key technological challenges, jointly developing new technologies, business models, and industry ecosystems; the global market must address the challenges of charging standardization and power decarbonization. Therefore, in this highly competitive market, accurately predicting new energy vehicle sales is of great significance for enterprises to plan their production and other strategies in the face of future market uncertainties.
2. ARIMA and SARIMA models
Time series models with seasonal characteristics are handled by the Seasonal ARIMA model, often known as SARIMA, which is an extension of the ARIMA model. The symbol for it is ARIMA (p,d,q) (P, D, Q) [m]. One popular time series forecasting model is the ARIMA model. Autoregression (AR), differencing (I), and moving average (MA) comprise its three components. The AR component takes into account how previous observations have affected the time series' current value. The model is constructed using historical error terms using the moving average (MA) component. The differencing (I) component makes non-stationary time series stationary. Overall, the ARIMA model integrates these three components to address non-stationary time series data, using the operator of I to address non-stationarity, AR to capture long-term dependencies, and MA to handle short-term fluctuations. This makes the ARIMA model a powerful tool for describing linear relationships in time series data and for making forecasts [4-6]. This paper uses the characteristics of the ARIMA model to analyze and forecast time series data (monthly sales of NEV).
3. Establishment of the SARIMA model
3.1. Sources of data and preparation
Well-known automotive websites and the China Association of Automobile Manufacturers are the sources of the data. NEV sales data from January 2015 to April 2025 was used for cleaning and modeling.
3.2. Data processing and stationarity testing
According to the ARIMA model, time series data is assumed to be stationary, meaning that neither the variance nor the mean fluctuate over time. It is necessary to make nonstationary data stationary before modeling.
3.2.1. Data trend analysis
Figure 1 shows the time series chart of monthly NEV sales. From January 2015 to April 2025, the chart shows an overall significant upward trend. This trend became more pronounced after 2020. While data fluctuations were relatively small in the early period, they became larger in the later period with non-constant variance, indicating the possibility of variance.
3.2.2. Stationarity test
Stationery can be tested using a variety of techniques. The null hypothesis is that there is a unit root and that the time series is non-stationary. This paper utilizes the Augmented Dickey-Fuller test to find out if a time series has a unit root.
|
Original sequence |
Dickey-Fuller=0.0422 |
p-value=0.99 |
|
First-order differential sequence |
Dickey-Fuller=-6.302 |
p-value=0.01 |
The test findings in Table 1 show that the p-value is 0.99. The null hypothesis cannot be disproved when the p-value exceeds 0.05. The original time series is therefore non-stationary.
3.2.3. Data stationarity treatment
(1) Logarithmic Transformation
Log transformation is a commonly used method for variance stabilization. For data in which the variance increases with the mean, taking the log of the variable reduces the difference between large values and amplifies the difference between small values to some extent, thereby stabilizing the variance.
(2) Differencing Transformation
Differencing eliminates trends in the data and aids in variance stabilization. Based on the results of the data trend analysis and the ADF test, the original time series should undergo a logarithmic transformation first. Then, the transformed data should be processed using first-order differencing and seasonal differencing. Test the processed data for stationary. If the data does not meet the modeling requirements, then perform second-order differencing [7]. As shown in Table 1, the stationary test results indicate that the transformed data is stationary.
3.3. Building the ARIMA model
After smoothing the data, as shown in Figure 2, the model may contain seasonal and non-seasonal MA (1) components. Since the data underwent one difference and one seasonal difference, an initial ARIMA (0,1,1) (0,1,1) [12] model was established.
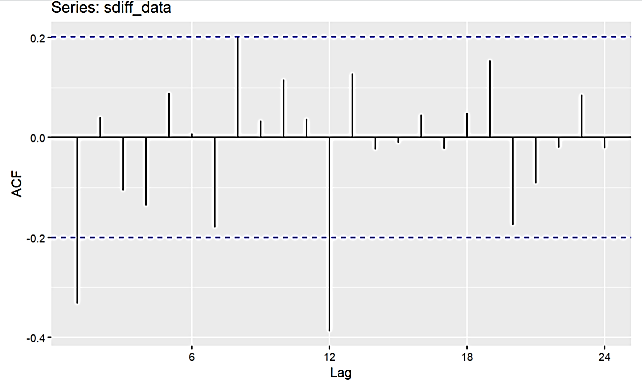
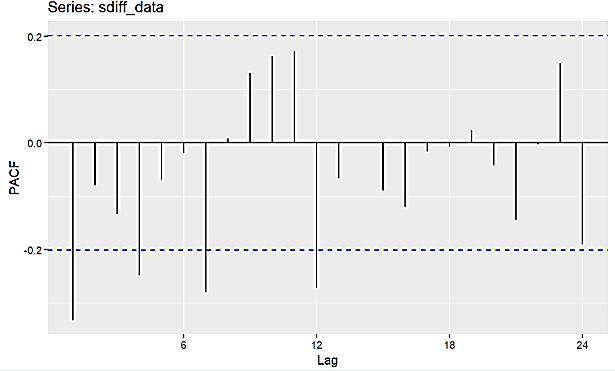
Figure 2: ACF and PACF
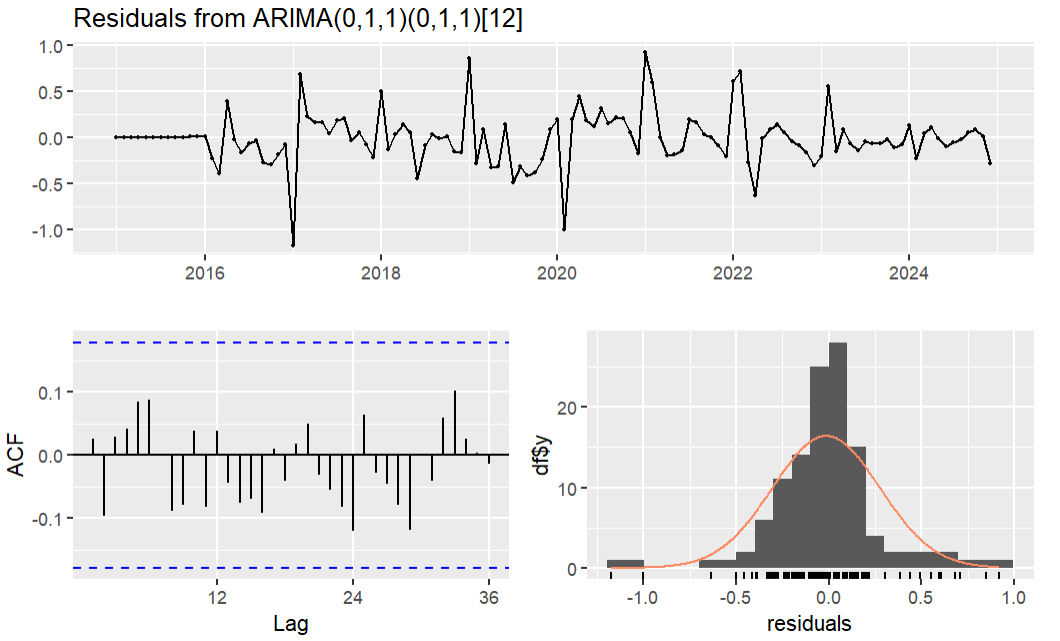
Multiple fittings were performed through this model and its derivative models, and the corresponding AICc values were calculated, as shown in Table 2. Based on the characteristics of the AICc values, the final optimal model was determined to be the ARIMA (0,1,1) (0,1,1) [12]. As can be seen from the residual plot of the fitted model in Figure 3, all residuals are within the significant threshold, indicating white noise characteristics. The Ljung-Box test also shows that there is no autocorrelation among the residuals [8-10].
|
Model |
AICc |
|
ARIMA (0,1,1) (0,1,1) [12] |
62.80 |
|
ARIMA (0,1,2) (0,1,1) [12] |
64.61. |
|
ARIMA (1,1,1) (0,1,1) [12] |
64.74 |
|
ARIMA (0,1,3) (0,1,1) [12] |
65.10 |
|
ARIMA (0,1,1) (1,1,0) [12] |
73.62 |
|
ARIMA (0,1,2) (1,1,0) [12] |
75.62 |
3.4. Forecasting sales data and model testing
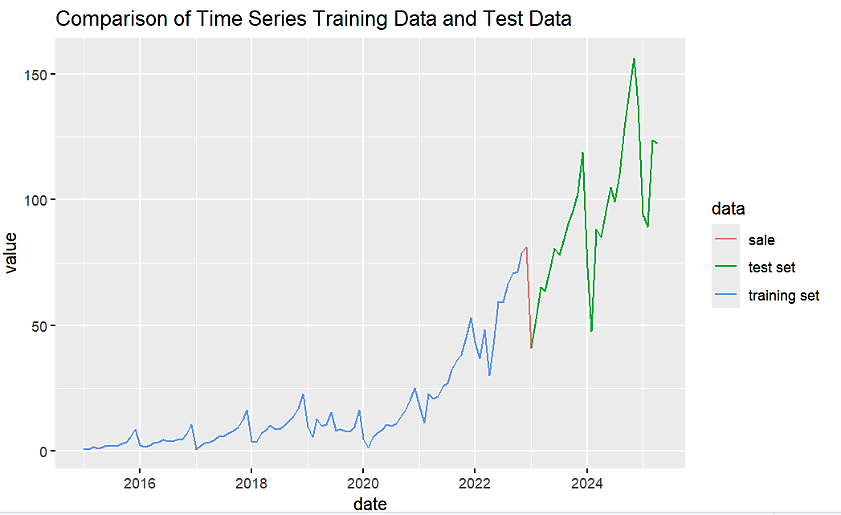
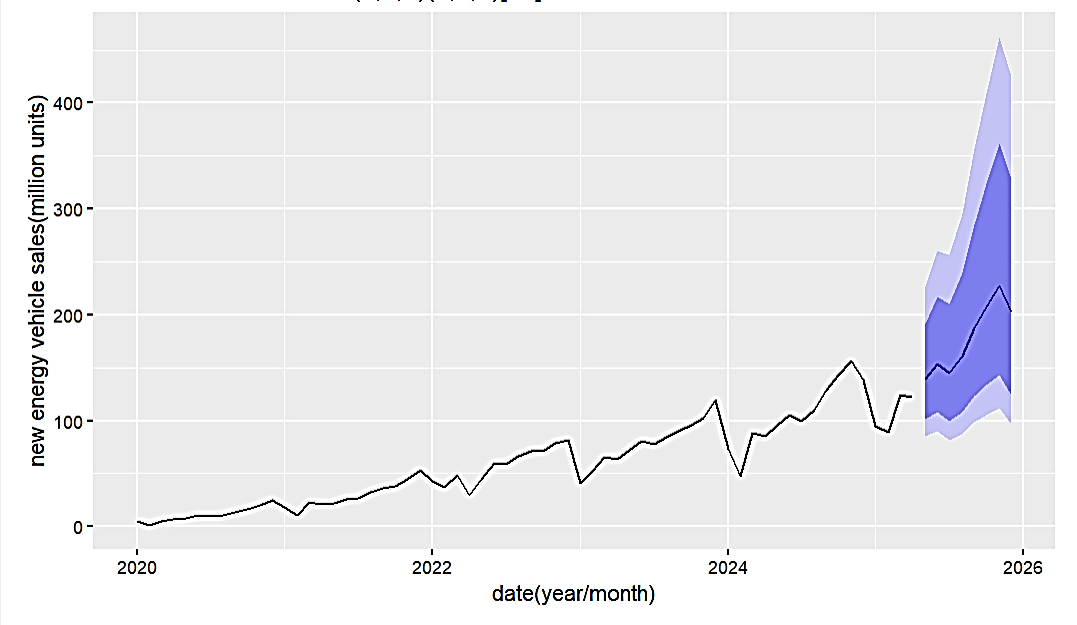
Data from January 2015–December 2022 as the training set and January 2023–April 2025 as the test set were used to compare the outcomes predicted by the ARIMA (0,1,1) (0,1,1) [12] model with the test set. The validity of the model is confirmed by the RMSE of 58.90723, as shown in Table 3. The sales of NEV from May to December of 2025 were then forecasted using the same data for fitting. Figure 4 graphs the trend of the anticipated data, whereas Table 4 displays the monthly sales prediction findings.
|
ME |
RMSE |
MAE |
MPE |
MAPE |
MASE |
|
|
Training set |
-2.2197 |
9.5565 |
6.2101 |
-5.9948 |
14.3057 |
0.2736 |
|
Test set |
2.7157 |
15.0273 |
11.5581 |
1.1934 |
12.3020 |
0.5093 |
|
Test set |
0.4434 |
|||||
|
RMSE |
58.9072 |
|
Point forecast |
Low 80 |
High 80 |
Low 95 |
High 95 |
|
|
May 2025 |
140.9297 |
95.2488 |
208.5188 |
77.4090 |
256.5745 |
|
June 2025 |
163.3137 |
105.0968 |
253.7790 |
83.2245 |
320.4750 |
|
July 2025 |
155.1126 |
95.5137 |
251.9004 |
73.8908 |
325.6147 |
|
August 2025 |
172.4794 |
102.0020 |
291.6526 |
77.2405 |
385.1498 |
|
September 2025 |
193.7725 |
110.3756 |
340.1818 |
81.9381 |
458.2460 |
|
October 2025 |
208.7873 |
114.8192 |
379.6589 |
83.6649 |
521.0326 |
|
November 2025 |
233.2649 |
124.0906 |
438.4902 |
88.8451 |
612.4425 |
|
December 2025 |
242.9705 |
125.2401 |
471.3718 |
88.1833 |
669.4544 |
4. Conclusion
The seasonal ARIMA (SARIMA) model was chosen in light of the noteworthy correlation between China's car sales and seasonality, as well as monthly nationwide sales statistics for new energy cars from January 2015 to April 2025. The SARIMA model was fitted and established after the model's structure and order were constructed in accordance with pertinent concepts and criteria. It is necessary to discover that the model performed well in terms of prediction after testing it on the test set. For the next eight months, the author projected the monthly sales of new energy cars using this methodology. In addition to providing crucial theoretical and practical assistance for the high-quality growth of the automobile industry, this paper anticipates that these forecasts will yield data to enable future manufacturing of new energy vehicles.
References
[1]. Shang, W. J., Wang, Y. W., Sheng, H. B., & Hu, X. Y. (2024). Forecasting Automobile Sales Based on ARIMA Model. Auto Industry Research, 3, 25-29.
[2]. Wu M, Chen W. (2022). Forecast of electric vehicle sales in the world and China based on PCA - GRNN. Sustainability, 14(4), 2206.
[3]. Zhang, S. X. (2024). Application of ARIMA and ARIMAX Models in Forecasting Private Car Ownership. Science & Technology Industry, 24(9), 189-194
[4]. Wang Y. (2015). Time Series Analysis: Based on R. Beijing: China Renmin University Press.
[5]. Hyndman, R. J., & Athanasopoulos, G. (2014). Forecasting: principles and practice. London: Bowker-Saur. Pharo.
[6]. Tian, J. M., Wang, P., Zhu, D. N. (2024). Overview of Chinese new energy vehicle industry and policy development. Green Energy and Resources, 2(2), 100075.
[7]. Akaike, H. (1970). Statistical predictor identification. Annals of the Institute of Statistical Mathematics, 22(1), 203-217.
[8]. Zhang, J. (2020). Research on development mechanism of new energy vehicle enterprises based on open-source innovation model. IOP Conference Series: Earth and Environmental Science, 619(1).
[9]. Long S, Liu Q. (2021). Research on new energy vehicle sales forecast and product optimization based on data mining// The International Society for Applied Computing (ISAC), The Technical Institute for Engineers (TIE.). Proceedings of 2021 2nd International Conference on Electronics, Communications and Information Technology (CECIT 2021). IEEE COMPUTER SOCIETY, 1054-1059.
[10]. Du Y, Wei K, Wang Y, et al. (2022). New Energy Vehicles Sales Prediction Model Combining the Online Reviews Sentiment Analysis: A Case Study of Chinese New Energy Vehicles Market //Artificial Intelligence in China. Springer, Singapore, 424-431.
Cite this article
Liang,Z. (2025). SARIMA Model for Sales Forecast: Evidence from New Energy Vehicles. Advances in Economics, Management and Political Sciences,200,90-95.
Data availability
The datasets used and/or analyzed during the current study will be available from the authors upon reasonable request.
Disclaimer/Publisher's Note
The statements, opinions and data contained in all publications are solely those of the individual author(s) and contributor(s) and not of EWA Publishing and/or the editor(s). EWA Publishing and/or the editor(s) disclaim responsibility for any injury to people or property resulting from any ideas, methods, instructions or products referred to in the content.
About volume
Volume title: Proceedings of ICEMGD 2025 Symposium: Innovating in Management and Economic Development
© 2024 by the author(s). Licensee EWA Publishing, Oxford, UK. This article is an open access article distributed under the terms and
conditions of the Creative Commons Attribution (CC BY) license. Authors who
publish this series agree to the following terms:
1. Authors retain copyright and grant the series right of first publication with the work simultaneously licensed under a Creative Commons
Attribution License that allows others to share the work with an acknowledgment of the work's authorship and initial publication in this
series.
2. Authors are able to enter into separate, additional contractual arrangements for the non-exclusive distribution of the series's published
version of the work (e.g., post it to an institutional repository or publish it in a book), with an acknowledgment of its initial
publication in this series.
3. Authors are permitted and encouraged to post their work online (e.g., in institutional repositories or on their website) prior to and
during the submission process, as it can lead to productive exchanges, as well as earlier and greater citation of published work (See
Open access policy for details).
References
[1]. Shang, W. J., Wang, Y. W., Sheng, H. B., & Hu, X. Y. (2024). Forecasting Automobile Sales Based on ARIMA Model. Auto Industry Research, 3, 25-29.
[2]. Wu M, Chen W. (2022). Forecast of electric vehicle sales in the world and China based on PCA - GRNN. Sustainability, 14(4), 2206.
[3]. Zhang, S. X. (2024). Application of ARIMA and ARIMAX Models in Forecasting Private Car Ownership. Science & Technology Industry, 24(9), 189-194
[4]. Wang Y. (2015). Time Series Analysis: Based on R. Beijing: China Renmin University Press.
[5]. Hyndman, R. J., & Athanasopoulos, G. (2014). Forecasting: principles and practice. London: Bowker-Saur. Pharo.
[6]. Tian, J. M., Wang, P., Zhu, D. N. (2024). Overview of Chinese new energy vehicle industry and policy development. Green Energy and Resources, 2(2), 100075.
[7]. Akaike, H. (1970). Statistical predictor identification. Annals of the Institute of Statistical Mathematics, 22(1), 203-217.
[8]. Zhang, J. (2020). Research on development mechanism of new energy vehicle enterprises based on open-source innovation model. IOP Conference Series: Earth and Environmental Science, 619(1).
[9]. Long S, Liu Q. (2021). Research on new energy vehicle sales forecast and product optimization based on data mining// The International Society for Applied Computing (ISAC), The Technical Institute for Engineers (TIE.). Proceedings of 2021 2nd International Conference on Electronics, Communications and Information Technology (CECIT 2021). IEEE COMPUTER SOCIETY, 1054-1059.
[10]. Du Y, Wei K, Wang Y, et al. (2022). New Energy Vehicles Sales Prediction Model Combining the Online Reviews Sentiment Analysis: A Case Study of Chinese New Energy Vehicles Market //Artificial Intelligence in China. Springer, Singapore, 424-431.