


1. Introduction
The apparel and fashion industry is one of the most influential industries in the world, contributing significantly to the gross domestic product of the world economy. Many countries benefit from the import and export of apparel. In addition, it has stimulated the expansion of a number of apparel brand companies. In response to the tremendous demand for clothing, numerous clothing brands have joined the market. Maintaining the affection and loyalty of customers has become crucial for brands to maintain a strong position in the highly competitive sector. In accordance with Leading Clothing Companies Worldwide as of December 2023, by market capitalization [1], the world is in the process of clothing manufacturers demonstrating outstanding brand strength in a highly competitive market. These renowned companies, like LVMH, Nike, Dior, and Fast Retailing, are not just at the forefront in terms of sales and market share. These organizations have effectively cultivated a distinctive brand identity in the international market by employing precise and innovative marketing strategies and branding [2]. As individuals' quality of life rises, buyers have varying criteria for clothing preferences, such as durability, comfort, sustainability, and even brand recognition. The research subject of this study is Lululemon.
The brand was founded in 1998 in Vancouver, Canada, as a premium sportswear brand. Over the years, the brand has expanded its product line to include a variety of athletic apparel and now many accessories that are suitable for a wide range of sports and lifestyles. The company's emphasis on comfort, utility, and fashionable aesthetics has garnered a devoted clientele comprising fitness enthusiasts, athletes, and persons leading active lifestyles who prioritize excellence in quality, fashion, and performance. Due to the proliferation of social media in recent years, Lululemon has successfully diversified its sales channels and promotional strategies. As a sports brand or yoga brand, market capitalization has been ranked as the number two sports brand.
Lululemon's strong market presence has cemented its position as a global leader in the sportswear industry. Therefore, what makes this brand stand out in a competitive market? The key lies in its precise brand positioning and product strategy. By specializing in core values such as high quality, innovative design, and comfort, Lululemon has not only established a distinctive brand image in the market but has also won a large number of loyal consumers in its marketing process [3]. This brand positioning is directly linked to customer loyalty, allowing Lululemon to stay ahead of the competition and continue to solidify its market presence.
2. Literature review
With the rapid development of the global apparel market, brand positioning has become one of the key factors influencing consumer behavior and brand loyalty. In recent years, focusing on how brands can win consumer loyalty through accurate market positioning has become critical research for scholars and marketing managers. In contrast, more academic research has been conducted on how brands can change their marketing strategies through customer satisfaction.
Using a limited dependent variable framework to jointly model brand choice and purchase quantity decisions, Krishnamurthi and Raj, in an early study on brand loyalty and consumer purchase behavior, found that loyal consumers are less price sensitive than non-loyal consumers in their brand choices and decisions [4]. In addition, Krishnamurthi and Raj also explored the duality of consumer decision-making by decomposing the purchase process into brand choice and purchase quantity decisions. The study shows that while loyal consumers are indeed less sensitive to price changes when choosing a brand, this sensitivity increases significantly when they decide on the quantity to purchase.
Consumer perceptions of different brand-positioning strategies are also critical to help brand managers make market-specific choices when selecting positioning strategies. In the article “Evaluating the Effectiveness of Brand-Positioning Strategies from a Consumer Perspective", authors Fuchs and Diamantopoulos examine this issue [5]. The article compares four different positioning strategies: feature positioning, direct benefit positioning, benefit positioning, and surrogate positioning, and asks subjects to rate four different companies selling the same product. It concludes that positioning strategies have a significant effect on brand popularity, differentiation, and credibility.
To explore this topic more thoroughly, scholars have taken the topic to the field of sports apparel. In the article “The Relationship between Brand Image and Brand Trust in Sporting Goods Consumers”, researchers found that there is a positive relationship between brand image and customer trust through the questionnaire of several hundred sporting goods consumers who purchased different sporting apparel brands [6]. The researchers found that there is a positive relationship between brand image and customer trust, and there is a positive relationship between all components of brand image. In other words, the better the brand image, the higher the consumer's trust in the brand [7].
3. Segmentation
|
Segmentation |
Demographics |
Population |
Lifestyle |
Preferences/Product Alignment |
|
Fashion Sports Followers (20-25 years) |
High level of education and income. |
2.9% of 339 million, around 9,831,000 |
Focus on quality of life and health, enjoy high-quality lifestyles. |
Latest and hottest styles, more fashionable, often receive gifts from brands. |
|
“Supergirl” Urban White-collar (25-35 years) |
White-collar professionals, early- and mid-career. |
8.5% of 339 million, Around 28,815,000 |
Focus on quality of life and healthy lifestyles. |
Emphasis on product quality; prefer practical, durable, and cost-effective products. |
|
Fitness Enthusiasts (25-45 years) |
Concerned about overall health, including diet, exercise and mental health. |
15-20% of 339 million, around 50.85 to 67.8 million |
Embrace a healthy lifestyle, love outdoor sports and traveling. |
Seek products that match the brand's philosophy. |
|
Fitness Instructor/Yoga Teacher (25-45 years) |
Focusing on fitness, having a high intensity fitness program |
1-2% of 339 million, around 3.39 to 6.78 million |
High-intensity exercise routines. |
High demand for high- quality yoga products. Purchase exercise products in sets; prioritize functionality, durability, comfort, aesthetics, and style. |
The chart clearly shows the image of Lululemon's target customers. First, these customers are between the ages of 20 and 45 and generally have a regular fitness frequency. These customers are usually highly educated and have high-paying jobs, so their spending level is higher. In addition, a group of fitness enthusiasts are more interested in the quality and comfort of the product. Also not to be ignored is the “Supergirl” type of customer, which is a type of customer group specifically proposed by Lululemon. This type of customer is mainly concentrated in the white-collar women in urban areas, who not only have requirements on the quality and functionality of the clothes but also pay great attention to the fashion of the clothes.
4. Positioning
By analyzing the target customers, we can understand their needs and preferences. These insights not only help us understand a brand's core consumer group but also provide an essential reference for the brand's market positioning [3]. The next section will explore how major sports brands meet the needs of their target customers through different positioning strategies by analyzing the perception map.
Figure 1 shows a perceptual map that visualizes the positioning of different brands based on two key dimensions: fashion and functionality. This perceptual map allows us to visually analyze how Lululemon is positioned in the market relative to other sports and yoga brands Nike, Adidas, Under Armour, and Alo Yoga, and how these positions reflect the differences in fashion and functionality of the brands. Divided by ten grids, five different colors represent each brand's position on the perceptual map, as shown in Figure 1.
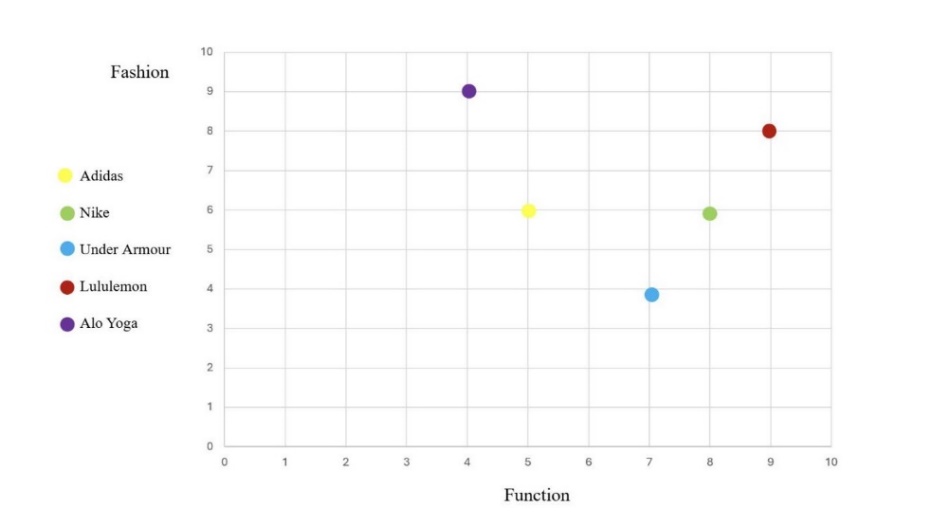
The positioning map above illustrates the relative positioning of Lululemon and its four competitors: Adidas, Nike, Under Armour, and Alo Yoga. We take the price of women's leggings as an example, based on two key dimensions: fashion and function.
Lululemon, with 41 billion market value, is positioned in the upper right quadrant, indicating a strong presence in function and fashion. This positioning aligns with Lululemon's brand identity as a premium sportswear brand that caters to consumers who value both aesthetics and functionality. Lululemon's two biggest competitors are Nike and Adidas, with a market value of 216 billion and 45 billion, respectively. Nike is positioned slightly lower than Lululemon in both fashion and function, suggesting that while it is still strong in these areas, it may be perceived as less specialized in high fashion than Lululemon. Adidas is placed more towards the center, with moderate scores in both fashion and function. Under Armour is positioned lower on both the fashion and function scales, indicating that it is perceived as less fashionable and functional than the other brands. Alo Yoga is positioned high on the fashion scale but lower on function, suggesting that it is perceived as a stylish brand with a strong focus on aesthetics.
5. Methodology
The purpose of this study is to explore, through a questionnaire survey, consumer preferences for price, durability, and comfort when choosing an athletic brand. For this purpose, the study conducted a detailed comparative analysis of the three major competing brands in the market: Lululemon, Nike, and Under Armour. The research team constructed 100 different combinations of attributes covering every possible scenario of price, durability, and comfort. Respondents were asked to select the option from these combinations that best matched their preferences.
To ensure the diversity and representativeness of the data, the study distributed a total of 12 questionnaires, each receiving 100 responses, with a total of 1,200 valid responses collected. The study used Pearson's correlation analysis to explore the relationship between the attributes. In addition, Ordinary Least Squares (OLS) regression analysis was used to determine the specific impact of each attribute on brand choice.
6. Data analysis
This study uses the Pearson correlation analysis and the Ordinary Least Squares (OLS) regression analysis to examine the factors influencing consumer choice for Lululemon products, including comfort level, durability, and price—the analysis offers insights into Lululemon's brand positioning and how these factors drive consumer preferences and loyalty.
6.1. Consumer choice and price
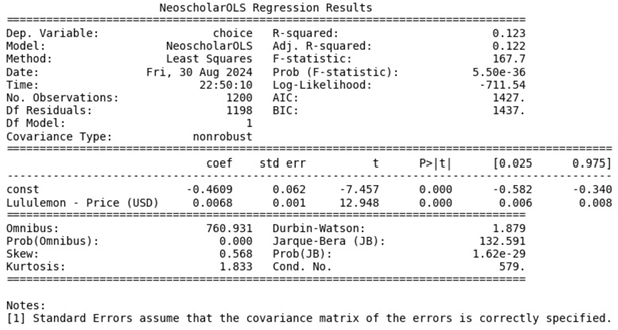
A substantial positive association between Lululemon's pricing and consumer choice is demonstrated by the regression analysis in Figure 2, which has a coefficient of 0.0068 and a P-value of 0.000. That indicates that Lululemon's high pricing does not stop consumers from buying but strengthens its brand image. There are a series of reasons behind this trend. Firstly, consumers tend to perceive higher prices as an indicator of high quality. Especially for premium brands, consumers are likely to associate the high price with better materials, more innovative design, or more robust durability. As a result, Lululemon’s target consumers are willing to pay a higher price for better products. Secondly, the premium pricing strategy gives consumers a sense of exclusivity and status. Purchasing Lululemon's products is seen as a symbol of high social status, with the brand expressing the values of the wellness-driven, affluent consumer base. In addition, the positive relationship between price and consumer choice also indicates strong brand loyalty. In Krishnamurthi and Raj's study, loyal consumers are less sensitive towards the price and care more about the brand [4]. Loyal consumers of Lululemon tend to continue purchasing despite the price rise.
6.2. Consumer choice and comfort level
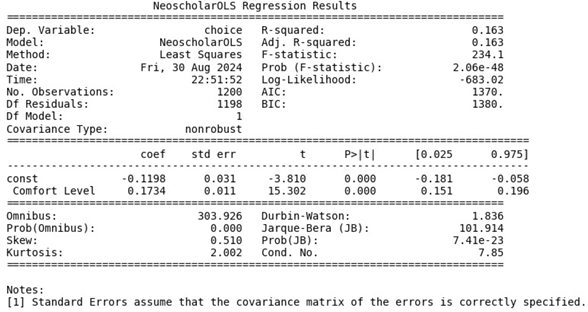
The regression coefficient for "Comfort Level" is 0.1734, with a P-value of 0.000, as shown in Figure 3. This positive coefficient indicates that an increase in the comfort level of Lululemon products will enormously increase consumers' likelihood of choosing these products. This trend is as follows: Firstly, consumers associate Lululemon products with superior comfort. The brand has successfully cultivated a reputation for producing high-quality athletic wear that is functional and comfortable. That aligns with both consumers’ needs and Lululemon's feature for apparel worn for exercise and casual settings, blending fashion with functionality. Given this, many consumers are willing to pay a higher price for Lululemon’s products because they believe they are getting superior comfort and quality. Therefore, the premium pricing strategy is justified by the brand’s ability to stick to its high quality.
Moreover, comfort plays a significant role in fostering strong consumer loyalty. According to Pura, high consumer perceived value (CPV) can increase purchase intentions and positive word-of-mouth [8]. Lululemon consistently delivers comfortable and well-made products, which reinforces consumer trust, leading to repeat purchases and brand advocacy. Customers with positive experiences with the comfort of Lululemon’s products are more likely to continue buying and recommending them to others, further strengthening Lululemon’s market position.
6.3. Comparison of price and comfort level
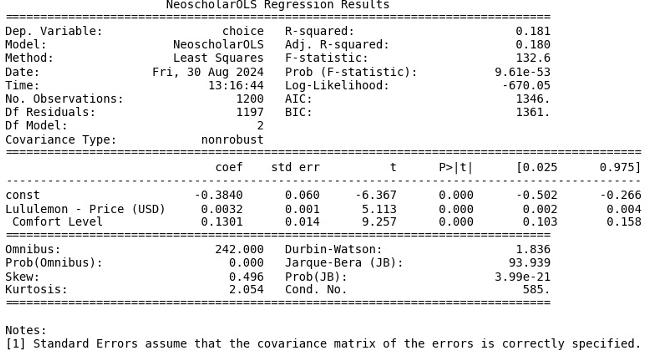
The regression analysis gives insights into how price and comfort level predict consumer choice when considered in single and multiple-variable analyses. As shown in Figure 4, in the single variable analysis, the coefficient for price was 0.0068, indicating a positive relationship between price and consumer choice. However, in the multiple variable analysis, which controls for comfort level, the coefficient for price decreases to 0.0032. This reduction suggests that while price remains a significant predictor, its impact is diminished when other variables, such as comfort, are considered. Similarly, the coefficient for comfort level shows a decline from 0.1734 in the single-variable analysis to 0.1301 in the multiple-variable analysis, but not so significant compared to price. Therefore, it shows despite this decrease, comfort remains an essential factor, demonstrating its considerable influence on consumer choice, even when controlling for the effect of price. This result indicates comfort as a critical factor that drives consumer decisions. These findings provide valuable insights into the relative importance of price and comfort. While price is still a significant factor, it is clear that comfort is a more substantial contributor to Lululemon products.
6.4. Durability and choice
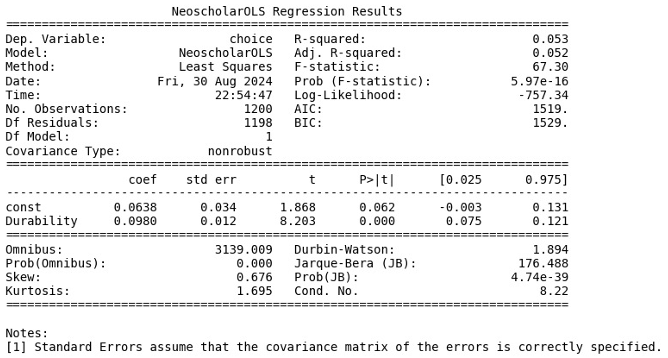
The regression analysis for "Durability" indicates a positive coefficient (0.0980), as shown in Figure 5. However, the impact on consumer choice is not statistically significant, with a P-value of 0.062, compared to the coefficient of comfort level (0.1734). That suggests that durability is not a primary determinant in consumer decision-making. This insight can help the marketer further refine its marketing and product development strategies, emphasizing comfort as a core value while attaching less importance to durability.
7. Limitation & future research field
Though the survey is carefully designed and thoroughly analyzed, there are still several limitations, and future research can be explored further in those fields.
Firstly, the sample size of 12 distributed surveys may only partially represent the broader population of sportswear consumers. Future studies should include a more extensive and diverse sample to enhance the findings. Secondly, the survey design included fixed attributes and choices, which might only capture some factors influencing consumer decisions. Additional attributes such as brand reputation, innovation, and social influence could be included in future surveys to provide a more comprehensive analysis. Thirdly, the study focused on comparisons between Lululemon, Nike, and Under Armour. Including additional competitors in the analysis could provide a broad view of the competitive landscape in the sportswear market. Moreover, the study uses only two research methods, and future studies can adopt other methods, such as Structural Equation Modeling (SEM) and Cluster Analysis, to get a border view of consumer loyalty.
The following studies could focus on examining the influence of digital marketing on the level of customer allegiance to a brand. An investigation will be conducted to explore the relationship between digital marketing efforts and customer loyalty. That will be achieved by measuring the level of involvement on social media platforms and conducting customer surveys for analysis. In addition, marketing managers can use customer satisfaction surveys to measure how often customers return. For example, evaluating the impact of Lululemon's in-store yoga classes and tailored shopping experiences on customer loyalty can provide more insight into the relationship between consumer experience, engagement, and brand loyalty.
8. Conclusion
After analyzing these data, the following conclusions can be drawn. Firstly, in accordance with Lululemon's branding as a luxury brand, customers typically associate high prices with high-quality products. Lululemon's expensive strategy effectively strengthens customers' social identities while also enhancing their sense of individuality and distinction. Lululemon demonstrates a solid commitment to the brand despite its higher price point, suggesting that the target consumer recognizes the value it provides.
Furthermore, the level of comfort has played an important part in customers' purchasing decisions. This research provides evidence for the effectiveness of Lululemon's marketing strategy in positioning itself as a prestigious and superior brand. Consumers' strong desire for comfort is fueled by the ongoing provision of items of great quality and exceptional customer experiences, demonstrating remarkable brand loyalty and trust.
Lastly, while durability is considered a fundamental expectation by customers, Lululemon has yet to significantly differentiate itself with regard to this characteristic. Customers are primarily captivated by the product's additional performance attributes. Therefore, Lululemon could enhance its market position in the future by emphasizing the innovative design and exceptional comfort of its items in its marketing strategy.
Acknowledgement
Xin Li, Xinyuan Wu, and Yizhong Wang contributed equally to this work and should be considered co-first authors.
References
[1]. U.S. Census Bureau. (2023). Income Summary Measures by Selected Characteristics: 2021 and 2022. Retrieved from https: //www2.census.gov/programssurveys/cps/techdocs/cpsmar23.pdf.
[2]. Agustin, C., & Singh, J. (2005). Curvilinear effects of consumer loyalty determinants in relational exchanges. Journal of Marketing Research, 42(1), 96-108.
[3]. Lim, C. H., Kim, K., & Cheong, Y. (2016). Factors affecting sportswear buying behavior: A comparative analysis of luxury sportswear. Journal of Business Research, 69(12), 57935800. https: //doi.org/10.1016/j.jbusres.2016.04.176
[4]. Krishnamurthi, L., & Raj, S. P. (1991). An empirical analysis of the relationship between brand loyalty and consumer price elasticity. Marketing Science, 10(2), 172-183. https: //doi.org/10.1287/mksc.10.2.172
[5]. Fuchs, C., & Diamantopoulos, A. (2010). Evaluating the effectiveness of brand-positioning strategies from a consumer perspective. European Journal of Marketing, 44(11/12), 17631786. https: //doi.org/10.1108/03090561011079873
[6]. Deheshti, M., Adabi Firouzjah, J., & Alimohammadi, H. (2016). The relationship between Brand Image and Brand Trust in sporting goods consumers. Annals of Applied Sportd Science, 4(3), 27-34. https: //doi.org/10.18869/acadpub.aassjournal.4.3.27
[7]. Buil, I., Martinez, E., & de Chernatony, L. (2013). The influence of Brand Equity on Consumer Responses. Journal of Consumer Marketing, 30(1), 62-74. https: //doi.org/10.1108/07363761311290849
[8]. Pura, M. (2005). Linking perceived value and loyalty in location-based mobile services. Managing Service Quality: An International Journal, 15(6), 509–538.
Cite this article
Wu,X.;Li,X.;Wang,Y. (2025). Brand Positioning and Consumer Loyalty: An Empirical Study of Lululemon. Advances in Economics, Management and Political Sciences,198,295-302.
Data availability
The datasets used and/or analyzed during the current study will be available from the authors upon reasonable request.
Disclaimer/Publisher's Note
The statements, opinions and data contained in all publications are solely those of the individual author(s) and contributor(s) and not of EWA Publishing and/or the editor(s). EWA Publishing and/or the editor(s) disclaim responsibility for any injury to people or property resulting from any ideas, methods, instructions or products referred to in the content.
About volume
Volume title: Proceedings of the 3rd International Conference on Financial Technology and Business Analysis
© 2024 by the author(s). Licensee EWA Publishing, Oxford, UK. This article is an open access article distributed under the terms and
conditions of the Creative Commons Attribution (CC BY) license. Authors who
publish this series agree to the following terms:
1. Authors retain copyright and grant the series right of first publication with the work simultaneously licensed under a Creative Commons
Attribution License that allows others to share the work with an acknowledgment of the work's authorship and initial publication in this
series.
2. Authors are able to enter into separate, additional contractual arrangements for the non-exclusive distribution of the series's published
version of the work (e.g., post it to an institutional repository or publish it in a book), with an acknowledgment of its initial
publication in this series.
3. Authors are permitted and encouraged to post their work online (e.g., in institutional repositories or on their website) prior to and
during the submission process, as it can lead to productive exchanges, as well as earlier and greater citation of published work (See
Open access policy for details).
References
[1]. U.S. Census Bureau. (2023). Income Summary Measures by Selected Characteristics: 2021 and 2022. Retrieved from https: //www2.census.gov/programssurveys/cps/techdocs/cpsmar23.pdf.
[2]. Agustin, C., & Singh, J. (2005). Curvilinear effects of consumer loyalty determinants in relational exchanges. Journal of Marketing Research, 42(1), 96-108.
[3]. Lim, C. H., Kim, K., & Cheong, Y. (2016). Factors affecting sportswear buying behavior: A comparative analysis of luxury sportswear. Journal of Business Research, 69(12), 57935800. https: //doi.org/10.1016/j.jbusres.2016.04.176
[4]. Krishnamurthi, L., & Raj, S. P. (1991). An empirical analysis of the relationship between brand loyalty and consumer price elasticity. Marketing Science, 10(2), 172-183. https: //doi.org/10.1287/mksc.10.2.172
[5]. Fuchs, C., & Diamantopoulos, A. (2010). Evaluating the effectiveness of brand-positioning strategies from a consumer perspective. European Journal of Marketing, 44(11/12), 17631786. https: //doi.org/10.1108/03090561011079873
[6]. Deheshti, M., Adabi Firouzjah, J., & Alimohammadi, H. (2016). The relationship between Brand Image and Brand Trust in sporting goods consumers. Annals of Applied Sportd Science, 4(3), 27-34. https: //doi.org/10.18869/acadpub.aassjournal.4.3.27
[7]. Buil, I., Martinez, E., & de Chernatony, L. (2013). The influence of Brand Equity on Consumer Responses. Journal of Consumer Marketing, 30(1), 62-74. https: //doi.org/10.1108/07363761311290849
[8]. Pura, M. (2005). Linking perceived value and loyalty in location-based mobile services. Managing Service Quality: An International Journal, 15(6), 509–538.