1. Introduction
Gender inequality has always been controversial as a widely concerned social issue. Although some people claim that the problem of gender discrimination has gradually diminished with the development of society, there are still opponents who believe that implicit gender discrimination still exists and even is deepening [1]. That is because, the phenomenon that the average educational level of females is lower than males has been going on for a long time. Though the gender difference in lower-level education has gradually diminished through time, the gender gap is still non-negligible in the enrollment rates in higher education. By Chau and Kanbor, such inequality on gender has negatively affected the economic development as gender discrimination deprives the opportunity of certain part of the population, thus suppressesing the potential of the discriminated group [2]
This paper aims to determine whether the severity of gender discrimination is related to regional economic development. If such a correlation exists, this paper will explore whether this correlation is negative or positive. To test the conjecture, regression lines are applied to the gross regional product per capita during the last five years and annual educational level data of male and female population, which is sampled by province.
This paper looks at the negative effects of gender discrimination from different angles, and tries to provide new ideas for eliminating the obstacles to social and economic development at the present stage by analyzing the reasons affecting economic development.
2. Literature Review
When it comes to the reasons why gender discrimination is related to economic development,the study have summarized the following points.
Dollar and Gatti proposed an opinion that the average amount of working force has been reduced by the gender discrimination, and thus impede the economic development [3]. Blecker and Seguino holds the same view, they suggest that such inequality prevents countries to gain competitive advantage on “export-led growth strategies” by using female labour as they are relatively cheaper [4]
Another point raised by Tiago de Cavalcanti and Tavares is mentioned in the article of Stephan Klasen, their model suggests that, gender inequality on the labor market is closely associated with the fertility, where severe discrimination on hiring female always accompany with higher fertility rate, and higher fertility reduces economic growth [5].
Also, Stephanie Seguino has mentioned a view that Alderman et al, Hill and King raised, which concerns that the marginal returns to education for girls are higher than for boys, partly reflecting selection effects -- only the most able girls end up in education. [6]
Lastly, Anand Swamy and his partner claims that, on average, female less prone to corruption and nepotism than male. And if such point confirmed, allowing women to participate in the workplace would also be profitable for the economy [7].
3. Analysis
3.1. Analysis of the Relationship Between Female Education Level and Sex Discrimination
Gender inequality is reflected in numerous aspects, including gender wage differences and employment rates, paid and unpaid hours of work, unemployment rates, educational attainment, and other more specific measures of well-being such as life expectancy and the ratio of men to women in the population. [6]. And for the choice of data, it is considered that the ratio of male to female education in each province is very representative. Here this researchcompare the proportion of the population of male and female in each province with the proportion of men and women receiving higher education. We assume that if there is no gender discrimination in a region, then the proportion of men and women receiving higher education should be the same as the proportion of men and women in the population.
It is worth mentioning that the employment rate of males and females is also a representative variable, but it is accompanied by many endogenous problems. It is difficult to calculate and exclude the wage difference of different genders in the same position, and the preference of certain genders in many specific occupations cannot be eliminated. For example, there may be a bias in favor of men in some jobs that require a lot of physical strength, or a bias in favor of women in some jobs that require a lot of manual labor, but there are objective biological reasons for this, rather than outright gender discrimination.
3.2. Gender Disparities in Higher Education and GDP
In this section, the educated females and males ratio in 2019 is separated by province and compared with the local highly educated females and male ratios in the same year to test whether there is a gap between males and females in receiving higher education. This variable is considered as the basic calculator of gender discrimination level in the following study.
The GDL(gender discrimination level) calculation formula for the degree of gender discrimination in this paper is:
| (1) |
FE: current female educated population in the province
ME: Current male educated population in provinces
HFE: Number of women currently in higher education in the province
HME: Number of males with higher education in the current province
In this test, provinces where the absolute difference between the ratio of educated female and male and the ratio of highly educated female and male is greater than 0.053794 is considered as "province with at least mild discrimination" .
The test results are shown in TAB.1:
Table 1: Existence of gender discrimination in China by province.
province | GDP | Gender ratio | Higher educated | discrimination level | If discriminate |
Beijing | 164563 | 0.9846392 | 0.9619941 | 0.022645123 | FALSE |
Tianjin | 90058 | 0.8118352 | 0.8340659 | 0.022230728 | FALSE |
Hebei | 46182 | 0.959118 | 0.9016544 | 0.057463625 | TRUE |
Shanxi | 45549 | 0.9773037 | 0.960076 | 0.017227662 | FALSE |
Inner Mongolia Autonomous | 67852 | 0.9373957 | 0.9917012 | 0.054305503 | TRUE |
Liaoning | 57067 | 0.9929245 | 0.9391304 | 0.053794094 | TRUE |
Jilin | 43475 | 0.9809839 | 0.9862385 | 0.005254615 | FALSE |
Heilongjiang | 36001 | 0.9730187 | 0.934824 | 0.038194687 | FALSE |
Shanghai | 156587 | 0.9271645 | 0.9369274 | 0.009762867 | FALSE |
Jiangsu | 122398 | 0.9672811 | 0.8738706 | 0.093410445 | TRUE |
Zhejiang | 107814 | 0.9289901 | 0.9503192 | 0.021329116 | FALSE |
Anhui | 58072 | 0.9791151 | 0.8069835 | 0.172131576 | TRUE |
Fujian | 106966 | 0.9301569 | 0.9257695 | 0.004387481 | FALSE |
Jiangxi | 52865 | 0.958848 | 0.8367806 | 0.122067383 | TRUE |
Shandon | 70129 | 0.9811793 | 0.8648231 | 0.116356276 | TRUE |
Henan | 55825 | 0.9801424 | 0.8275947 | 0.152547717 | TRUE |
Hubei | 76712 | 0.9857426 | 1.0114322 | 0.025689609 | FALSE |
Hunan | 57746 | 0.962643 | 0.8738919 | 0.088751142 | TRUE |
Guangdong | 94448 | 0.8470753 | 0.8559217 | 0.008846319 | FALSE |
Guangxi Zhuang Autonomous | 42964 | 0.9347783 | 0.9622196 | 0.027441343 | FALSE |
Hainan | 56740 | 0.9403379 | 1.3578199 | 0.417481996 | TRUE |
Chongqing | 75828 | 0.9982712 | 0.971831 | 0.026440192 | FALSE |
Sichuan | 55472 | 1.0337979 | 1.0427148 | 0.008916862 | FALSE |
Guizhou | 46433 | 0.930886 | 0.8671329 | 0.063753105 | TRUE |
Yunnan | 47944 | 0.9602505 | 1.1237224 | 0.163471927 | TRUE |
Tibet Autonomous | 48902 | 0.9970867 | 1.0490196 | 0.051932936 | FALSE |
Shannxi | 66649 | 0.9708535 | 0.8614052 | 0.109448286 | TRUE |
Gansu | 32995 | 0.9785297 | 0.8881524 | 0.090377221 | TRUE |
Qinghai | 48570 | 0.9353783 | 0.8066465 | 0.128731797 | TRUE |
Ningxia Hui Autonomous | 54217 | 0.9438849 | 0.9150685 | 0.028816399 | FALSE |
Xinjiang Uyghur Autonomous | 54280 | 0.9829551 | 1.0750586 | 0.092103521 | TRUE |
In this table,
“Gender ratio” represents the proportion of the female population versus the male population, which is calculated by:
 (2)
(2)
“Higher educated” represents the proportion of the female population that receives a higher level of education versus that of male. It is calculated by:
 (3)
(3)
“Discrimination level” represents GDL(gender discrimination level):
 (1)
(1)
“If discriminate” determines whether gender discrimination exists in the area. Area with “Discrimination level” higher than 0.053794 is marked as TURE in this section, and FALSE otherwise.
After this, this researchextracted all areas that are considered to have at least mild discrimination.
Table 2: Provinces with at least mild discrimination.
province | GDP | Gender ratio | Higher educated | discrimination level | If discriminate |
Hebei | 46182 | 0.959118 | 0.9016544 | 0.057463625 | TRUE |
Inner Mongolia Autonomous | 67852 | 0.9373957 | 0.9917012 | 0.054305503 | TRUE |
Liaoning | 57067 | 0.9929245 | 0.9391304 | 0.053794094 | TRUE |
Jiangsu | 122398 | 0.9672811 | 0.8738706 | 0.093410445 | TRUE |
Anhui | 58072 | 0.9791151 | 0.8069835 | 0.172131576 | TRUE |
Jiangxi | 52865 | 0.958848 | 0.8367806 | 0.122067383 | TRUE |
Shandon | 70129 | 0.9811793 | 0.8648231 | 0.116356276 | TRUE |
Henan | 55825 | 0.9801424 | 0.8275947 | 0.152547717 | TRUE |
Hunan | 57746 | 0.962643 | 0.8738919 | 0.088751142 | TRUE |
Hainan | 56740 | 0.9403379 | 1.3578199 | 0.417481996 | TRUE |
Guizhou | 46433 | 0.930886 | 0.8671329 | 0.063753105 | TRUE |
Yunnan | 47944 | 0.9602505 | 1.1237224 | 0.163471927 | TRUE |
Shannxi | 66649 | 0.9708535 | 0.8614052 | 0.109448286 | TRUE |
Gansu | 32995 | 0.9785297 | 0.8881524 | 0.090377221 | TRUE |
Qinghai | 48570 | 0.9353783 | 0.8066465 | 0.128731797 | TRUE |
Xinjiang Uyghur Autonomous | 54280 | 0.9829551 | 1.0750586 | 0.092103521 | TRUE |
After removing outliers from the results, the remaining provinces are further classified into areas with high and low levels of gender discrimination using the median gender discrimination level(GDL), which is around 0.056. The GDP information of the two groups with high and low levels of gender discrimination is summarized respectively in figure 1& figure 2:
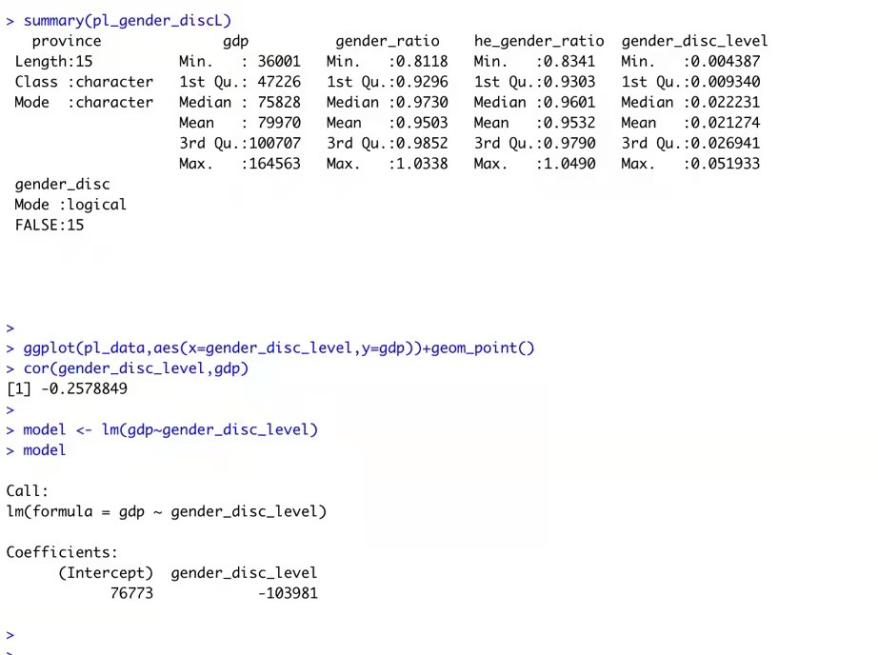
Figure 1:Summary data of the “mild gender discrimination” group
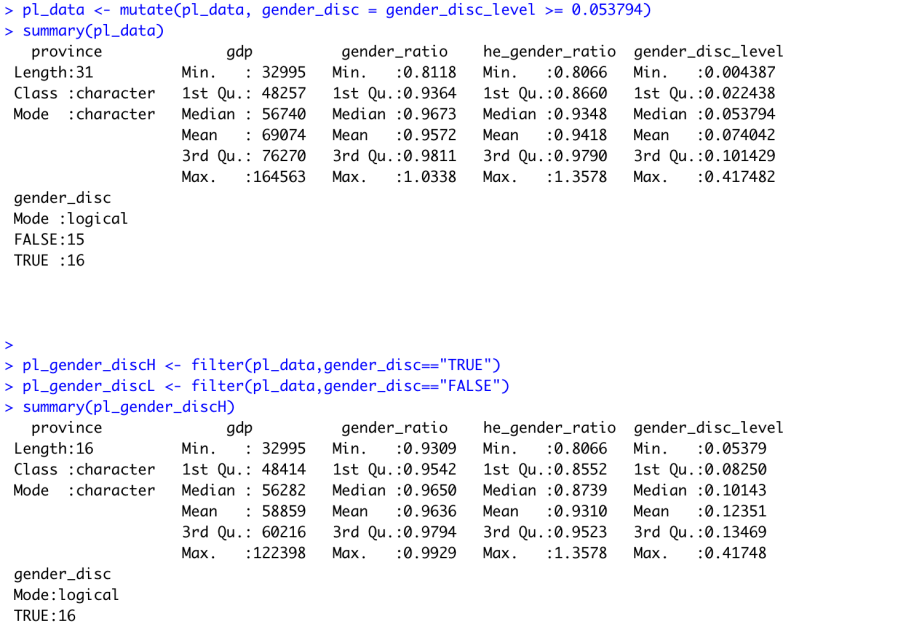
Figure 2: Summary data of the “severe gender discrimination” group
As can be seen from the comparison chart, the maximum, median, minimum and average values of GDP in areas with a relatively high degree of gender discrimination are uniformly lower than those in areas with a relatively low degree of gender discrimination.
By drawing the scatter chart(FIG.3) and calculating the correlation between the degree of gender discrimination in each province and GDP data, which is -0.2579. The research concluded that cities with less female education in general have less economic development.
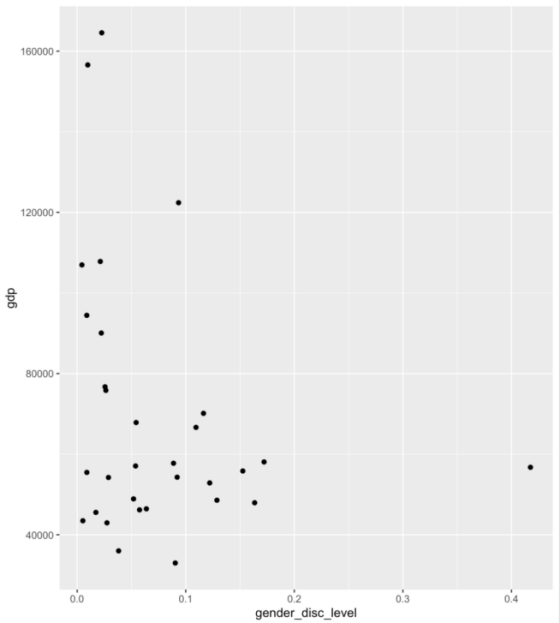
Figure 3: Scatter plot of gender discriminarion level versus GDP
3.3. Change in Degree of Gender Discrimination & GDP Growth Rate
At the same time, in order to further test the correlation between gender discrimination and economic development, the educational level of female in 2018 and 2019 was compared to test whether there was any change in the degree of gender discrimination between the two years.
A comparative analysis was conducted combining with the change rate of GDP.
First, the rate of change of GDP in 2018-2019 :
 (4)
(4)
Rate of change of male and female education ratio:
 (5)
(5)
The changing rate of the proportion of men and women with higher education:
 (6)
(6)
And the change rate of the degree of gender discrimination :
 (7)
(7)
Are calculated separately.
GDP19: GDP of the current province in 19 years
GDP18: the current provincial GDP of 18 years
GER19: The ratio of females with 19 years of education to males in the current province
GER18: The ratio of females with 18 years of education to males in the current province
HGER19: Ratio of females to males with higher education in 19 years in the current province
HGER18: Ratio of females to males with higher education in 18 years in the current province
GDL19: The degree of gender discrimination in the current province over 19 years
GDL18: Degree of gender discrimination in current provinces over 18 years (calculated using the same method as Formula 1)
The data are summarized in TAB.3:
Table 3: Changes in the extent of gender discrimination in China by province from 2018 to 2019.
province | GDP change rate | Gender ratio change rate | Higher education gender change rate | Discr level change rate | If discr increase |
Beijing | 0.07490774 | -0.02765218 | -0.077682958 | -0.25455367 | FALSE |
Tianjin | 0.05015334 | -0.060592646 | -0.078110934 | -0.45158539 | FALSE |
Hebei | 0.07130927 | -0.02485344 | -0.107001917 | 1.1990934 | TRUE |
Shanxi | 0.05903278 | 0.023582531 | -0.020286035 | -0.31549481 | FALSE |
Inner Mongolia Autonomous | 0.06397792 | -0.022617061 | 0.054255538 | 1.94777831 | TRUE |
Liaoning | 0.05933725 | -0.00340189 | 0.012420106 | -0.21702171 | FALSE |
Jilin | 0.04718663 | 0.000916437 | 0.011900154 | -0.03506518 | FALSE |
Heilongjiang | 0.05956971 | 0.001604955 | -0.000962131 | 0.06882388 | TRUE |
Shanghai | 0.05272818 | -0.011641244 | 0.009398733 | -0.01201018 | FALSE |
Jiangsu | 0.05579229 | 0.000496781 | -0.043279346 | 0.74930142 | TRUE |
Zhejiang | 0.05894139 | 0.003010229 | -0.010349629 | -0.37369548 | FALSE |
Anhui | 0.07385628 | 0.038379877 | 0.119989326 | -0.22601962 | FALSE |
Fujian | 0.08548639 | 0.008335006 | 0.046154315 | -0.883131 | FALSE |
Jiangxi | 0.07859139 | 0.014772118 | -0.032973158 | 0.53394794 | TRUE |
Shandon | 0.05501565 | -0.011218893 | -0.056895552 | 0.5449094 | TRUE |
Henan | 0.07120927 | 0.004126437 | -0.1714262 | 5.71904301 | TRUE |
Hubei | 0.07879453 | 0.046416567 | 0.455134755 | -0.89596794 | FALSE |
Hunan | 0.09348785 | -0.022872857 | -0.109264047 | 20.71486065 | TRUE |
Guangdong | 0.06383123 | -0.006637718 | 0.028235929 | -0.56460643 | FALSE |
Guangxi Zhuang | 0.07377787 | 0.013927998 | 0.042533273 | 25.76026549 | TRUE |
Hainan | 0.07460086 | -0.015422724 | 0.079612157 | 0.37953729 | TRUE |
Chongqing | 0.08479135 | 0.001733572 | 0.072482879 | -0.7074974 | FALSE |
Sichuan | 0.07595624 | 0.020094066 | 0.023187329 | 0.57792293 | TRUE |
Guizhou | 0.0857203 | 0.018065651 | -0.009631196 | 0.64304842 | TRUE |
Yunnan | 0.10556657 | 0.033902791 | 0.165925012 | 3.6652284 | TRUE |
Tibet Autonomous | 0.07533644 | -0.013475687 | 0.146351324 | -0.45683832 | FALSE |
Shannxi | 0.07161347 | -0.024539202 | -0.093437739 | 1.42743168 | TRUE |
Gansu | 0.07137059 | 0.01430367 | 0.04809678 | -0.22975071 | FALSE |
Qinghai | 0.06191788 | 0.013425061 | 0.032281918 | -0.09066136 | FALSE |
Ningxia Hui Autonomous | 0.05793397 | -0.072709427 | -0.124374114 | 0.0613949 | TRUE |
Xinjiang Uyghur | 0.04485082 | -0.019454085 | 0.033095384 | 1.41349076 | TRUE |
“If discr increase” determines whether the level of gender discrimination has rose in the area. Area with “Discr level change rate” higher than 0 is marked as TURE in this section, and FALSE otherwise.
Additionally, the correlation between the change rate of gender discrimination degree and the change rate of GDP index in each province is found to be 0.2968, which is the opposite to the paper’s prediction.

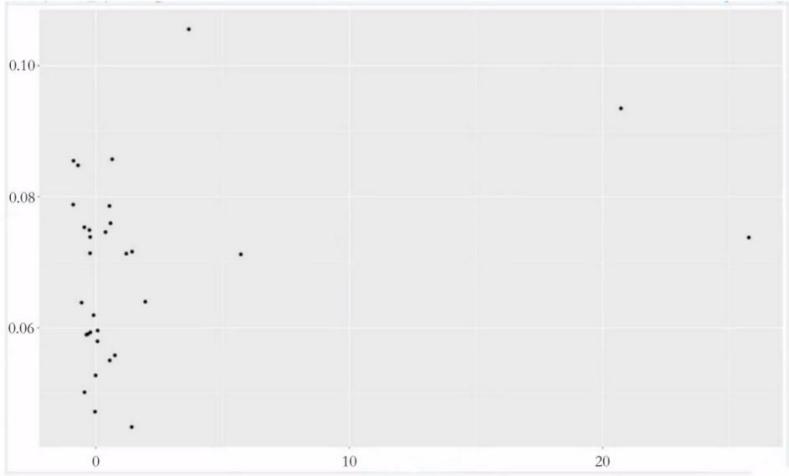
Gender discrimination level change rate
Figure 4: the ralationship between the change in gender discrimination level and GDP.
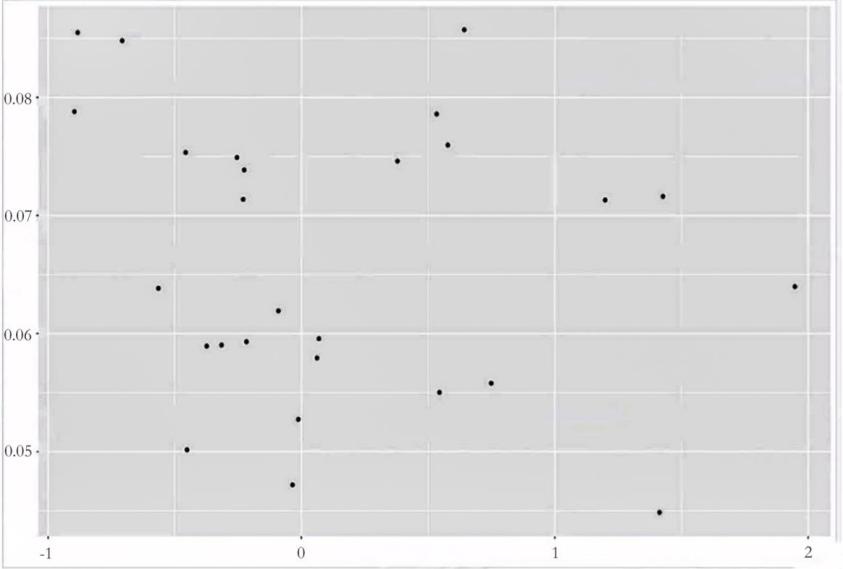
After drawing a scatter plot (FIG.4), it can be found that the values of very few provinces affected the overall trend, so this paper-removed outliers in the data and re-conducted the plot (FIG. 5).

Gender discrimination level change rate
Figure 5: the ralationship between the change in gender discrimination level and GDP without outlier.
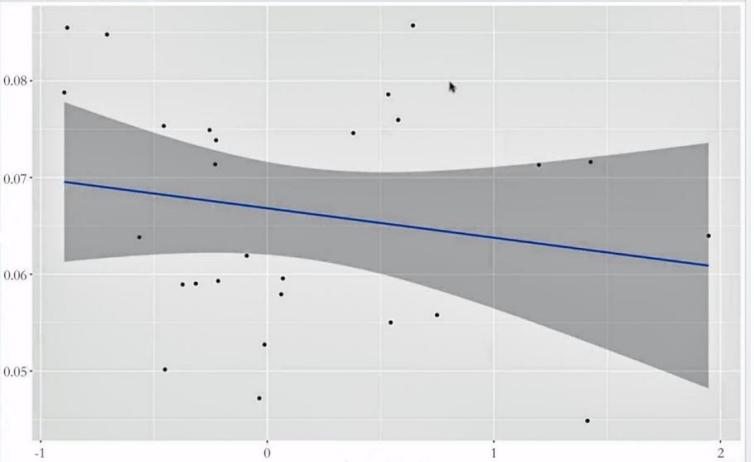
The correlation coefficient of the adjusted plot was -0.1886. In addition, the regression line is drawn by linear regression and also shows that the rate of change of gender discrimination degree in each province is negatively correlated with the rate of change of GDP index in each province (FIG. 6).

Gender discrimination level change rate
Figure 6: regression line of Gender discrimination level change rate and GDP change rate.
Thus, it is found that the increasing rate of gender discrimination is generally accompanied by slow or even negative economic growth.
To further test this study's conjecture, a hypothetical experiment was also proposed.
The original hypothesis(H0) is that the severity of gender discrimination is not correlated with GDP, while the alternative hypothesis(Ha) is that the severity of gender discrimination is negatively correlated with GDP.
By analyzing the degree of gender discrimination in Chinese provinces and their GDP index, it is concluded that the P value of the hypothesis is 0.04333, which means under the premise that the original hypothesis. Namely, the probability that gender discrimination and GDP data in 2019 really occurs("the severity of gender discrimination is not correlated with GDP") is only 0.04333, which is a very low probability event and smaller than the significance level 0.05. Therefore, it is reasonable to reject the null hypothesis that "the severity of gender discrimination is not correlated with GDP" and claim that the severity of gender discrimination is negatively correlated with GDP.
4. Gender Discrimination in Other Countries
The same problem happens in Pakistan. While the Constitution of Pakistan emphasizes equal treatment for all in society, the reality has backfired. Women lag behind men in almost every area of life. They have less access to education, health care and employment opportunities. They enjoy very limited ownership rights. This limits their active role in economic and development activities. In the study of Pervaiz and his partners, the ADF Unit root Test and the Unrestricted co-integration Rank test (Trace) were used to conduct a short run on the relationship between labor force growth, investment and trade opening gender inequality variables and economic growth Labor force growth, investment and trade openness are estimated to have a significant positive impact on economic growth, while gender inequality has a significant negative impact. This proves that gender inequality hinders Pakistan's economic growth in terms of female labor market participation, average human capital stock and fertility rate. Therefore, this study also suggests that addressing gender inequality should consider not only its intrinsic value, but also its instrumental value growth for the economy. [8]
South Korea is also a case in point. Under a series of policies, gender inequality in education in South Korea is decreasing. However, gender inequality is still affecting the employment rate of women in the workplace. Jingyoung Kim and his partners use the framework of equal labor force participation rate of men and women under the background of no gender bias exists in the family and labor market, and finds that under the new stable state, the growth rate of per capita output increases to a higher value. The results show that by eliminating gender inequality, the annual growth rate of per capita income could increase by about half a percentage point. According to the article's estimates of full gender equality, complete elimination of gender discrimination in the Labour market would increase female Labour market participation from 54.4 to 59.3%, while average per capita income growth would increase from 3.6% to 4.3%. Interestingly, however, the elimination of gender inequality in household production or education alone will reduce the growth rate of per capita income. This is mainly due to the shrinking supply of male workers. With full equality between men and women in family production or education, men will increase the amount of time allocated to family production, child rearing and education, and their time in the Labour market will decrease.[9]
5. Conclusion
In conclusion, through the analysis, the research first found that the GDP of regions with relatively high rates of gender discrimination was relatively low, and that the rate of change in GDP was negatively correlated with the degree of gender discrimination, that is, the rate of change of the proportion of men and women receiving higher education, which was also verified by the hypothesis experiment. Gender inequality has hampered economic growth by affecting average education levels, fertility rates, the average size of the labor force, and import and export policies, and many believe that inequality in the workplace may have also been affected by it. This paper does not exclude the possibility that provinces with lower GDP may lead to increased gender discrimination, which will need to be analyzed in a subsequent study.
References
[1]. Sabine Meinck &Falk Brese, Trends in gender gaps: using 20 years of evidence from TIMSS, 30 July 2019
[2]. Nancy H. Chau and Ravi Kanbur, the past,present and future of economic development, department of applied economics and management, Cornell University, September 2018.
[3]. Dollar, David and Roberta Gatti. “Gender Inequality, Income and Growth: Are Good Times good for Women?” Mimeographed. Washington CD: The World Bank, 1999.
[4]. Blecker, Robert and Stephanie Seguino. “Macroeconomic effect of reducing gender wage inequality in a export oriented, semi-industrialized economy”, Review of Development Economics, 2002.
[5]. Stephan Klasen, The Impact of Gender Inequality in Education and Employment on Economic Growth in Developing Countries: Updates and Extensions, Francesca Lamanna, World Bank Group, 2008.
[6]. Stephanie Seguino, Gender Inequality and Economic Growth: A Cross-Country Analysis, University of Vermont, Elsevier Science Ltd, 2000.
[7]. Swamy, Anand, Omar Azfar, Stephen Knack and Young Lee. “Gender and Corruption“. Journal of Development Economics, 2001.
[8]. Pervaiz, Zahid and Chani, Muhammad Irfan and Jan, Sajjad Ahmad and Chaudhary, Amatul R, Gender inequality and economic growth: a time series analysis for Pakistan, National College of Business Administration and Economics (NCBAE), 2011.
[9]. JINYOUNG KIM, Jong-Wha LEE and KWANHO SHIN, GENDER INEQUALITY AND ECONOMIC GROWTH IN KOREA, Pacific Economic Review, 2016.
Cite this article
Wu,R. (2023). Empirical Study of Gender Differences and Regional Economic Development. Advances in Economics, Management and Political Sciences,8,8-17.
Data availability
The datasets used and/or analyzed during the current study will be available from the authors upon reasonable request.
Disclaimer/Publisher's Note
The statements, opinions and data contained in all publications are solely those of the individual author(s) and contributor(s) and not of EWA Publishing and/or the editor(s). EWA Publishing and/or the editor(s) disclaim responsibility for any injury to people or property resulting from any ideas, methods, instructions or products referred to in the content.
About volume
Volume title: Proceedings of the 2nd International Conference on Business and Policy Studies
© 2024 by the author(s). Licensee EWA Publishing, Oxford, UK. This article is an open access article distributed under the terms and
conditions of the Creative Commons Attribution (CC BY) license. Authors who
publish this series agree to the following terms:
1. Authors retain copyright and grant the series right of first publication with the work simultaneously licensed under a Creative Commons
Attribution License that allows others to share the work with an acknowledgment of the work's authorship and initial publication in this
series.
2. Authors are able to enter into separate, additional contractual arrangements for the non-exclusive distribution of the series's published
version of the work (e.g., post it to an institutional repository or publish it in a book), with an acknowledgment of its initial
publication in this series.
3. Authors are permitted and encouraged to post their work online (e.g., in institutional repositories or on their website) prior to and
during the submission process, as it can lead to productive exchanges, as well as earlier and greater citation of published work (See
Open access policy for details).
References
[1]. Sabine Meinck &Falk Brese, Trends in gender gaps: using 20 years of evidence from TIMSS, 30 July 2019
[2]. Nancy H. Chau and Ravi Kanbur, the past,present and future of economic development, department of applied economics and management, Cornell University, September 2018.
[3]. Dollar, David and Roberta Gatti. “Gender Inequality, Income and Growth: Are Good Times good for Women?” Mimeographed. Washington CD: The World Bank, 1999.
[4]. Blecker, Robert and Stephanie Seguino. “Macroeconomic effect of reducing gender wage inequality in a export oriented, semi-industrialized economy”, Review of Development Economics, 2002.
[5]. Stephan Klasen, The Impact of Gender Inequality in Education and Employment on Economic Growth in Developing Countries: Updates and Extensions, Francesca Lamanna, World Bank Group, 2008.
[6]. Stephanie Seguino, Gender Inequality and Economic Growth: A Cross-Country Analysis, University of Vermont, Elsevier Science Ltd, 2000.
[7]. Swamy, Anand, Omar Azfar, Stephen Knack and Young Lee. “Gender and Corruption“. Journal of Development Economics, 2001.
[8]. Pervaiz, Zahid and Chani, Muhammad Irfan and Jan, Sajjad Ahmad and Chaudhary, Amatul R, Gender inequality and economic growth: a time series analysis for Pakistan, National College of Business Administration and Economics (NCBAE), 2011.
[9]. JINYOUNG KIM, Jong-Wha LEE and KWANHO SHIN, GENDER INEQUALITY AND ECONOMIC GROWTH IN KOREA, Pacific Economic Review, 2016.


