


1. Introduction
Securitization refers to the process that puts relevant assets together (forms into a pool) and packages them into new securities with different interest levels. The typical securitization example is MBS (Mortgage-backed securities), which refers to gathering mortgage loans, repackaging them into securities with foreseeable payments, and forming an investment like a bond. Furthermore, CDS are securities assembled through the securitization of MBS and other loans. During the financial crisis from 2007 to 2008, The creation and trading of MBS and CDO significantly impacted financial markets and even the global economy.
MBS and CDOs positively influence and increase the liquidity of mortgages. However, it did have issues with its securitization structure during the financial crisis, which caused massive damage to the whole financial system. Its duality is fascinating, but as a result, it was the key reason for the financial crisis. Therefore, the goal of our group will discuss the potential risk of the securitization structure of mortgages during the financial crisis and the impact that this securitization caused based on the background to prove that the securitization of mortgages at that time may not be a good choice for the U.S. financial system and economy.
For the discussion about the potential risk, our group will identify the potential risk, which is the correlation between mortgages using the OLS linear regression model (regress mortgage default rate on the unemployment rate and the housing price index) first. Then, our group will use an example to specify the effect of ignorance about the correlation to show the potential risk in MBS and CDO. Furthermore, our group will discuss the further expansion of this risk due to the U.S. housing market.
For the discussion about the impact, our group will first use the OLS linear regression model (regress return on equity on nonperforming loans and MBS asset size held by banks) to analyze the key factors that affect banks’ performance and banks performance during the financial crisis based on these factors. Furthermore, our group will discuss the impact from a macro view, such as GDP and unemployment rate change due to the influence caused by securitization.
Overall, our group will conclude that securitization during the financial crisis and prove that securitization at that time is a “curse.”
2. Background
In the early 20th century, only a few people in the United States could buy a house. The GSE (government-sponsored enterprises) was established to help provide housing for low- and moderate-income families and improve the United States housing situation. Companies such as Freddie Mac and Fannie Mae were established as GSEs in the housing sector. Since 2000, the GSE has shifted its focus to subprime mortgages to achieve "affordable housing goals” GSEs shifted their focus to subprime mortgages, creating MBS and CDO in the hope that this would optimize housing conditions well as boost the U.S. economy.
According to the graph shown below, after 2001, the start of GSE, the Federal Reserve decreases the interest rate from 6.52 to 1 percent. Therefore, the mortgage requirement starts to drop, and many Americans begin to take out mortgages. Furthermore, the companies which hold most mortgages through the purchase in the secondary market, such as Fannie Mae and Freddie Mac (purchased roughly $43 billion of conventional conforming mortgages in 2007, according to its 2007 annual report), started to securitize mortgages [1]. Other financial institutions begin to securitize based on mortgage securitization and other securities to make a profit and increase market liquidity. Moreover, since the housing demand increased dramatically due to the above situation, the housing price increased tremendously.
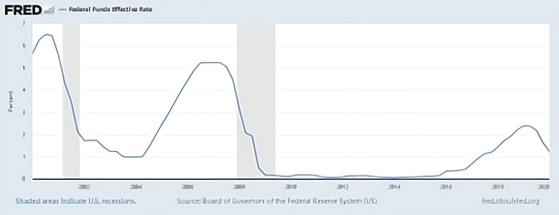
Figure 1: Federal Funds Effective Rate (all data from the Board of Governors of the Federal Reserve System (US)) [2].
3. Methodology & Analysis
3.1. Risks Arising from the Securitization and Housing Markets
3.1.1. The potential risk is based on the securitization of the financial crisis.
MBS has significant advantages. First, creating MBS provides high liquidity and profitability for commercial banks. Most of the maturity lengths of U.S. mortgage loans are about 30 years, and the maturity length is much more than most deposits [3]. The depositors have a strong liquidity demand. U.S. According to the banking system, mortgage loans should be regarded as typical assets, and deposits should be the liability. Therefore, bank operations will have a maturity mismatch problem because the long-run cash inflow may not match the short-term cash outflow. However, MBS provides a way that commercial banks could get high liquidity cash flows even from long-maturity assets and transfer the liquidity risk of mortgage loans to other financial institutions or investors. After selling the mortgage loans, banks could get enough capital to make loans immediately and provide credit to more investors so that banks do not need the extra capital to provide credit to investors and decrease the cost of funding. As a result, the total supply of credit and more capital joined the flow of the financial market, and the overall market liquidity increased. From 2006 to 2008, according to the Federal Reserve Bank of New York data, the daily average trading volumes (in billions) for MBS risen from 254.6 to 344.9, and the increase rate was 35.46% [4].
On the other hand, securitization at that time also has substantial drawbacks. The adverse effects of these shortcomings are even more significant than the positive effects. The first drawback is the underestimation of the overall risk of the securities. The underestimation is strongly related to the correlation between mortgage defaults. To prove there is strong correlation existence in mortgage defaults, an OLS linear regression model will be applied:
Y (Default rate) = β1X1 (Unemployment rate) + β2X2 (Housing price index) + ε(1)
In this model, Y stands for the default rate of family residential mortgages (DRFRM), X1 stands for the unemployment rate (UNRATE), X2 stands for the U.S. housing price index (USSTHPI), and ε stands for the residuals. The data is collected from Federal Reserve Economic Data. The regression process is conducted through Python and is shown below:
import pandas as pd
import statsmodels.formula.api as smf
df = pd.read_csv('USROE.csv')
ols1 = smf.ols('DRFRM ~ UNRATE + USSTHPI', df).fit()
ols1.summary()
and the regression result shows below:
Table 1: Regression results are based on the residential mortgage default rate, unemployment rate, and the U.S. housing price index (all data is from the Board of Governors of the Federal Reserve System (US), and the collected data is from 2001/01/01 to 2020/01/01, which is recorded quarterly) [5] [6] [7].
Dep. Variable: | DRFRM | ||||||||
Model: | OLS | ||||||||
Method: | Least Squares | ||||||||
Date: | Wed, 10 Aug 2022 | ||||||||
Time: | 18:03:38 | ||||||||
No. Observations: | 81 | ||||||||
Df Residuals: | 78 | ||||||||
Df Model: | 2 | ||||||||
R-squared: | 0.558 | ||||||||
Adj. R-squared: | 0.547 | ||||||||
F-statistic: | 49.30 | ||||||||
Prob (F-statistic): | 1.44e-14 | ||||||||
Log-Likelihood: | -178.76 | ||||||||
AIC: | 363.5 | ||||||||
BIC: | 370.7 | ||||||||
coef | std err | t | P>|t| | [0.025 | 0.975] | ||||
Intercept | -6.7898 | 2.105 | -3.225 | 0.002 | -10.981 | -2.599 | |||
UNRATE | 3.7193 | 0.377 | 9.878 | 0.000 | 2.970 | 4.469 | |||
USSTHPI | -0.0220 | 0.005 | -4.362 | 0.000 | -0.032 | -0.012 | |||
Omnibus: | 8.333 | Durbin-Watson: | 0.061 | ||||||
Prob(Omnibus): | 0.016 | Jarque-Bera (JB): | 8.840 | ||||||
Skew: | -0.783 | Prob(JB): | 0.0120 | ||||||
Kurtosis: | 2.592 | Cond. No. | 2.92e+03 | ||||||
According to the regression result, the value of P>|t| is smaller than 5%, and the coefficients of X1 and X2 are significant. The R-squared value reaches above 50%, showing that the regression model is adequate.
The coefficient of the unemployment rate is more significant than zero, which shows that when the unemployment rate increases, the default rate will tend to increase, too. Oppositely, when the housing price index is higher, the default rate tends to be lower. Therefore, it could be concluded that if the overall U.S. unemployment rate is low and most people can find suitable jobs, most people will not tend to default on their residential mortgages. Moreover, if the overall housing market booms, housing owners could refinance their mortgages, but they still will not default on the mortgages. This conclusion shows that the default rate between people could be affected by common factors; in other words, when the overall economy performs excellently, most people will show the same behavior: not default mortgages. Then, the mortgage defaults between people are correlated and not independent.
Between 2007 and 2008, most banks implement the Basel II framework to control the overall risk. However, the framework of Basel II, which is used to control, specify, and manage financial risk, is not as complete as the framework of Basel 2.5, III, and IV. In Basel II, there is no complete process for CRM (Comprehensive Risk Measure) which is about the correlation of default risk among different assets and counterparty credit risk measure [8]. Therefore, to be specific, the actual default risk of MBS is far more than the book value. Here is an example to specify the difference in underestimation:
Table 2: Simulation MBS default rate table based on the below assumed scenario with little correlation between defaults.
Mortgage Loan 1 | Mortgage Loan 2 | Cash flow | Paid Senior | Paid Junior | Probability |
No default | No default | 2000 | 900 | 1100 | 90.25% |
No default | Default | 1000 | 900 | 0 | 4.75% |
Default | No default | 1000 | 900 | 0 | 4.75% |
Default | Default | 0 | 0 | 0 | 0.25% |
In this scenario, there are only two tranches of MBS: Senior and Junior. The senior tranche prioritizes receiving the payments from the mortgage loans, but due to its low volatility and risk premium theory, the payment amount will be smaller. The pay for the senior tranche is 900, and the junior tranche is 1100. Both are sold at 800. Assume the mortgage loan payments are independent and cannot affect each other. The payment for each mortgage loan is 1000, and the default risk is 5% for each loan.
According to the probability, there is only a 0.25% that the senior tranche will not receive the payment. However, if there is a correlation between default risk and the correlation is 1, the actual probability will be significantly different
Table 3: Simulation MBS default rate table based on the below assumed scenario with high correlation between defaults.
Mortgage Loan 1 | Mortgage Loan 2 | Cash flow | Paid Senior | Paid Junior | Probability |
No default | No default | 2000 | 900 | 1100 | 95% |
Default | Default | 0 | 0 | 0 | 5% |
When the correlation between mortgage loans reaches 1, mortgage loan payments tend to default together. Therefore, the default risk for senior tranches is 5%, which is 20 times greater than the book value of 0.25%. Then, the senior tranches suffer a higher risk without risk premiums, so it could be concluded that the risk most senior tranche banks hold during the financial crisis is underestimated. The securitization of mortgages makes the risk underwater.
The structure of CDO also has a similar problem. CDO forms are based on the securitization of MBS. However, the pool for CDO is not just MBS with a lower credit rating. The pool includes other kinds of ABS (Asset-backed securities), such as auto loans, corporate loans, credit card loans, etc. The quality of these loans was at a deficient level during the financial crisis. However, CDO could still divide itself into different tranches, and some tranches could still reach the AAA level based on the above calculation without considering default correlation. Even though the default risk on paper is low, the actual default risk is higher due to the correlation of mortgages, autos, etc. Even assuming the correlation of the securities in the CDO pool is negligible, the excess default risk of MBS, one of the primary securities in the pool, still will push the actual default risk of CDO to a higher level. Detailed CDO default risk is shown below.
Table 4: CDO tranche risk statistics credit ratings and spreads (all data from Wojtowicz’s 2014 article “CDOs and the financial crisis: Credit ratings and fair premia”) [9].
Physical measure (PD=10%) | Risk-neutral measure (PD=20%) | |||
Tranche | Default Probability | Expected loss | Default Probability | Expected loss |
Tranche 2 | 10.00% | 5.00% | 44.64% | 30.24% |
Junior Mezz. | ‘BBB-’ | |||
Tranche 3 | 1.97% | 1.35% | 18.43% | 14.55% |
Senior Mezz. | ‘A-’ | |||
Tranche 4 | 0.87% | 0.58% | 11.09% | 8.46% |
Senior | ‘AA’ | |||
Tranche 5 | 0.36% | 0.01% | 6.21% | 0.27% |
According to the data in Wojtowicz’s 2014 article, when the PD (probability of default) of collateral securities is at a 10% level, the default probability for AAA is 0.36%. However, there is an excess default risk of MBS, and if PD reaches a 20% level, even for the super senior tranche, the default probability and expected loss will increase significantly. Therefore, the actual CDO default risk and expected loss reach a very high level during the financial crisis, even though the default risk on paper is small.
Overall, the securitization frame of mortgages (including MBS and CDO) during the financial crisis has a major problem: ignorance about the significant correlation between mortgages and loans, which causes the actual default risk to be incredibly higher than the paper default risk and still could be rated at AAA level. This results that during the financial crisis, financial institutions which hold AAA MBS or CDOs suffer the excess default risk.
3.1.2. The potential risk in the U.S. housing market.
According to the legislation our group mentioned in the background, many low-income people take out mortgages due to the lower mortgage requirements, and even they do not have enough ability to pay for the mortgage payments when the interest rate increases. The overheating housing demand makes housing price increases significantly, and the securitization of mortgages boost the financial markets so that the economy booms.
When the housing market proliferates, the banks do not worry about the default risk or loss of making mortgages because even if mortgages default, banks could sell the collateral to get their capital back. Therefore, banks expand mortgages without hesitation and use securitization to get high levels of liquidity so that they can use the capital to expand mortgages further.
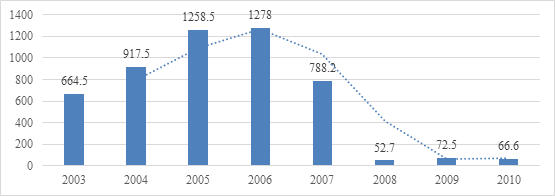
Figure 2: Residential MBS issuance in billion U.S. dollars (all data from Statista) [10].
From 2003 to 2006, the total size of MBS reaches 1278 billion dollars with an increasing rate of 92.3 presents. Furthermore, the total rated volume of CDO reaches approximately 350 billion dollars [11]. There is also a large percentage of MBS which are securitized to CDO. The whole CDO and MBS market overdrove. With the above discussion about the structure of MBS and CDOs, these securities already had excess potential risk, which is much more than the paper value. What’s more, Federal Reserve eventually will cool down the housing market so that the housing market has a giant bubble waiting for a burst from 2004 and 2006. According to the fundamental structure of MBS and CDO, their main collateral assets are mortgages, and the collateral of mortgages is the house. If the housing market collapse, the default rate of MBS and CDO will increase significantly. Therefore, the housing bubble makes MBS and CDOs much riskier. When the collateral asset market has a significant bubble, the securitization of the loans is a perilous choice because the boom could be cooled down or burst at any second.
Federal Reserve will not let the boom continue. According to Figure 1, from 2004 to 2006, Federal Reserve increases the interest rate from 1 to 5.25 percent to cool down the economy and control inflation. When the interest rate increases dramatically, many low-income house owners who need to pay mortgages realize they do not have enough money for their loans. The bubble in the housing market eventually bursts. The total potential risk of MBS and CDO is eventually exposed.
3.2. The Impact of the 2008 Financial Crisis Securitization
3.2.1. The impacts on bank performance.
To analyze the key factor which affects bank performance, an OLS linear regression model will be applied:
Y (Return on equity) = β1X1 (Nonperforming loan) + β2X2 (Total MBS asset) + ε(2)
In this model, Y stands for return on equity for all U.S. banks (ROE), a measure of banks’ profitability and could be regarded as the metric for bank performance. X1 stands for the percentage of nonperforming loans that banks have (NPL). X2 is the total MBS that banks hold (MBS). The regression process is conducted through Python and shown below:
ols2 = smf.ols('ROE ~ NPL + MBS', df).fit()
ols2.summary()
and the regression result shows below:
Table 5: Regression results are based on the return rate of banks’ equity, nonperforming loans that banks hold, and the total MBS asset size (all data is from the Board of Governors of the Federal Reserve System (US) and the collected data is from 2001/01/01 to 2020/01/01, which is recorded quarterly). [12] [13] [14].
Dep. Variable: | ROE | ||||||||
Model: | OLS | ||||||||
Method: | Least Squares | ||||||||
Date: | Thu, 11 Aug 2022 | ||||||||
Time: | 12:48:10 | ||||||||
No. Observations: | 81 | ||||||||
Df Residuals: | 78 | ||||||||
Df Model: | 2 | ||||||||
R-squared: | 0.633 | ||||||||
Adj. R-squared: | 0.623 | ||||||||
F-statistic: | 67.24 | ||||||||
Prob (F-statistic): | 1.06e-17 | ||||||||
Log-Likelihood: | -185.17 | ||||||||
AIC: | 376.3 | ||||||||
BIC: | 383.5 | ||||||||
coef | std err | t | P>|t| | [0.025 | 0.975] | ||||
Intercept | 18.4683 | 0.928 | 19.905 | 0.000 | 16.621 | 20.315 | |||
NPL | -1.8745 | 0.189 | -9.914 | 0.000 | -2.251 | -1.498 | |||
MBS | -2.96e-06 | 5.68e-07 | -5.217 | 0.000 | -4.09e-06 | -1.83e-06 | |||
Omnibus: | 20.982 | Durbin-Watson: | 0.311 | ||||||
Prob(Omnibus): | 0.000 | Jarque-Bera (JB): | 26.676 | ||||||
Skew: | -1.265 | Prob(JB): | 1.61e-06 | ||||||
Kurtosis: | 4.224 | Cond. No. | 5.32e+06 | ||||||
According to the regression result, the R-squared value is 0.633, which shows both independent variables could explain the variations of the dependent variable clearly. What’s more, P>|t| values for both independent variables are less than 5%, which shows both independent variables are statistically significant in this regression model. Furthermore, the coefficient of nonperforming loans is negative, which shows that when there are more nonperforming loans, the profitability of banks will be lower and the coefficient of total MBS asset size is negative, which shows when banks hold more MBS, they tend to underperform on profitability.
From 2007 to 2009, the total size of nonperforming loans increase from 47,731,965 to 361,295,684 thousand dollars and the increase rate is 657%. By 2008, approximately 25 percent of subprime ARM were 90-days delinquent, and the subprime mortgage reaches 1.3 trillion dollars [15]. Then, it could be concluded that most of the nonperforming loans during 2007-2009 are subprime mortgages.
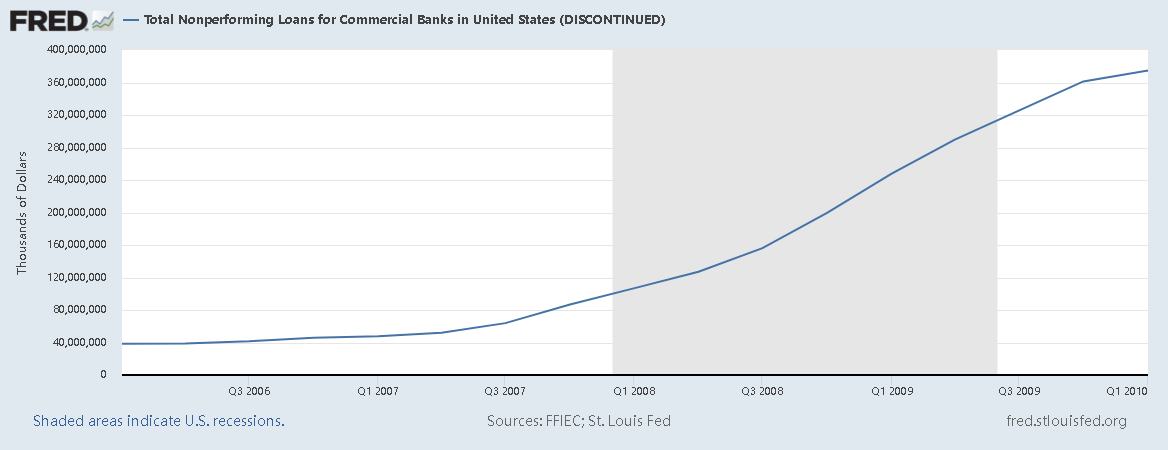
Figure 3: Total Nonperforming Loans for Commercial Banks in the United States (all data from Federal Financial Institutions Examination Council (US)).
The effects of increasing default in subprime mortgages amplified significantly through the securitization. When the collateral assets lost value, the value of MBS and CDO evaporated. The total market value of CDO decreased to below 30 million dollars in 2008 and the total asset value of MBS and CDO held by banks depreciated at a dramatic rate [16]. This explains why the coefficient of MBS assets is negative. It directly shows the negative impact that securitization has on bank performance during the financial crisis. More MBS and CDO they hold, the more loss they need to suffer. In 2007, Citigroup and Goldman Sachs, the main sellers, and holders of CDO, both reported huge losses in profit [16]. Therefore, it could be concluded that the securitization at that time amplify the housing bubble burst effect so that the profitability of banks got hit harder and the securitization may not be a good choice during 2004-2007.
3.2.2. The impacts of securitization products (MBS&CDO) on the overall economy of the U.S.
Looking back, the proliferation of securitization products in the mid-2000s caused the Global Financial Crisis and led to a deep economic recession. However, before securitization products became a plague, they boosted economic growth in the United States for several years. In this section, we will take a closer look at the impacts of the securitization products on the overall economy of the US over the entire process – from the time when the securitization products started gaining popularity to the end of the Global Financial Crisis. We will examine how securitized products have impacted the U.S. economy regarding its GPD, employment rate, and CPI.
The U.S. Economy Before the Global Financial Crisis. Although the securitization products, namely CDOs and MBS, all have extremely complicated structures, they are credit products in nature, which has brought numerous benefits to banks. Before the invention of securitization products, banks had difficulty generating high returns from a limited amount of assets. Once deposits are lent out to borrowers, they will have no other resources to generate additional returns except for the loans with fixed or variable interest rates that sit on their balance sheet. However, with securitization, banks can avoid some regulatory constraints on liquidity requirements and increase their returns with the same amount of assets. For example, Lehman Brothers first employed the aggressive growth strategy in 2006, which was to invest its capital in securitization products, such as subprime mortgages and MBS, etc., to earn an unusually high return. Based on a presentation prepared by Lehman’s securitization department in 2006, the team mentioned that “securitized products outperformed swap by close to 70bps, and MBS and CMBS contributed well to the outperformance with excess returns of 70bps and 61bps” (Figure 1), which shows how profitable the securitized products were. Meanwhile, since these products can be shown as Off-Balance Sheet Assets, which means Lehman did not need to record them under their debt section on its balance sheet, the risk level it reported was much lower than its actual risk level at that time. As a result, Lehman easily escaped the scrutiny of regulators.
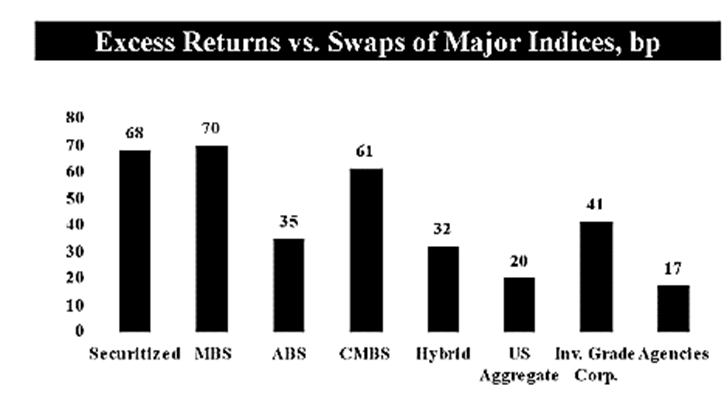
Figure 4: Performance of Securitized Products in 2006 (Source: Lehman Brothers) [17].
Besides the benefits of generating a higher return without showing the true risk level, there are other benefits for banks, such as 1) a more diversified investment pool through purchasing securitized products with different underlying assets, such as houses from different states of the US, cars, credit cards, etc.; 2) new sources of funding.
What’s more, from the corporation or individual borrowers’ perspective, the growth of securitized products provided them mainly with one benefit, which is a more loosened credit environment. Based on the data from Insidemortgagefinance.com1, newly originated subprime, Alt-A, and home equity lines totaled around $330 billion in 2001 and accounted for 15% of all newly originated residential mortgages. Then just five years later, the size of these types of mortgages grew to around $952 billion in 2006 and accounted for a whopping 48% of total new residential mortgages, which represents an annual growth rate of 23.6% for the 5 years. During that time, many individuals who were not qualified for mortgages were approved by issuers quickly, and many of them were able to buy a house even without any reliable income streams.
Since securitized products had provided considerable benefits to both borrowers and lenders, credit condition has also significantly improved. Together with the rate cuts implemented by the Fed since the 2002 recession, the US enjoyed positive quarterly GDP growth before the start of the GFC (Global Financial Crisis) in 2008 (Figure 5).
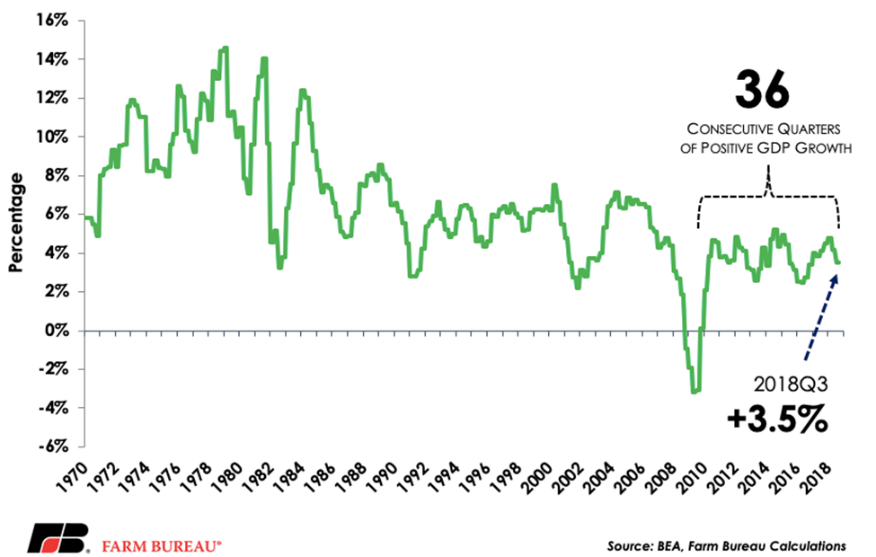
Figure 5: U.S. Quarterly GDP Growth Rate (all data from BEA, Farm Bureau Calculations) [18].
The reason for the GDP growth can be explained by the monetary theory we learned in class (Figure 3). When the Fed lowered the interest rate, there were higher incentives for companies to borrow at a cheaper rate, and for individuals to save less and spend more. Asset prices will also rise, creating a positive wealth effect that will further incentivize the spending spree. As a result, the number of goods and services at each price level increases, shifting the aggregate demand outwards, which will cause positive GDP growth.
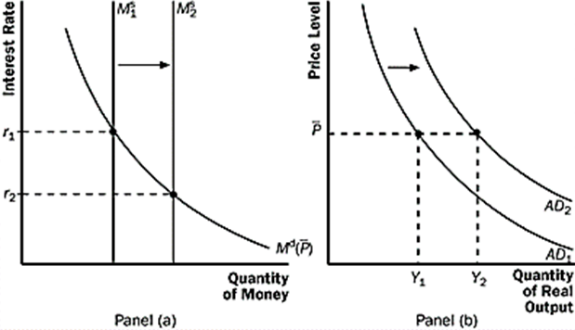
Figure 6: Impacts on Economy from Changes in Interest Rates [19].
Meanwhile, we can see that after the unemployment rate reached a high point in mid-2003, it decreased continuously (Figure 4). And based on the data from the Bureau of Labor Statistics from 2005, the Professional and business services segment had the highest employment change, which was 1145k, and the Construction and Financial activities segment also saw an increase of 662k and 220k new employment (Figure 5) which shows that the improvement of the employment condition was broad-based.
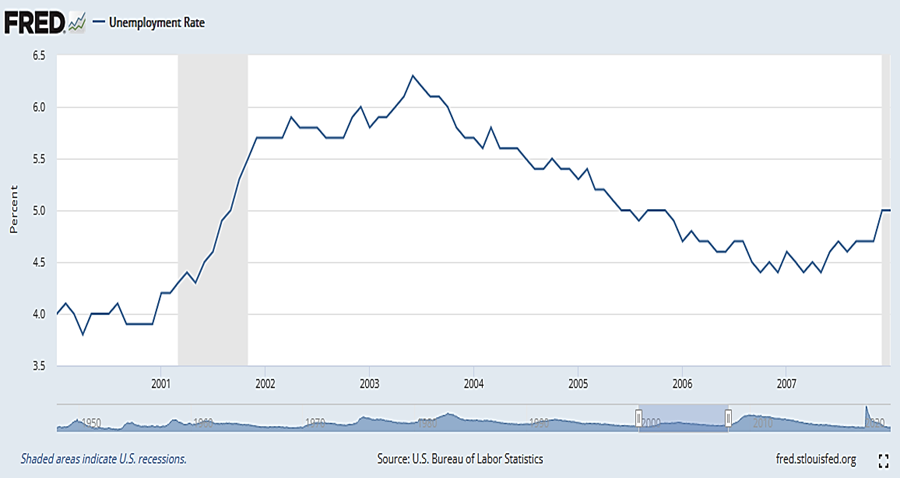
Figure 7: U.S. Unemployment Rate (2000-2007) (all data from U.S. Bureau of Labor Statistics) [5].
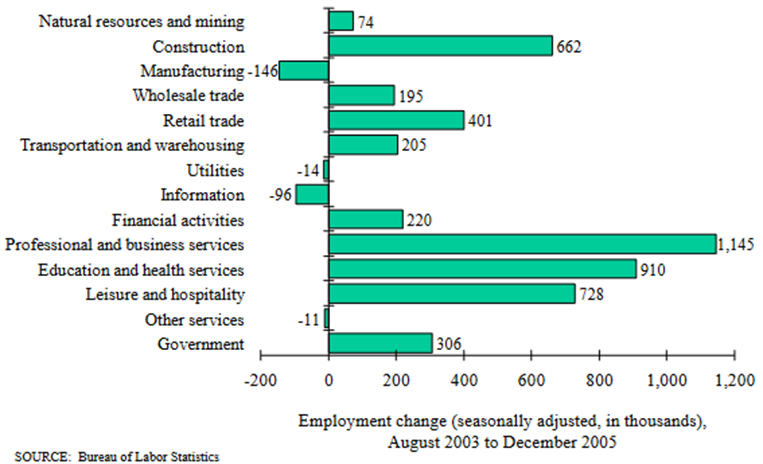
Figure 8: Employment rose in most industries from August 2003 to December 2005 (all data from U.S. Bureau of Labor Statistics) [20].
In terms of inflation, the CPI data has been in the range of 1% to 5% (Figure 6), although economic expansion has had some impacts on the change in prices, the main theme was the change in oil prices and the rise of China. Oil accounts for around 7.5% of the total CPI changes. And as we can see from the chart, the oil price and CPI have been highly positively correlated since the beginning of 2000.
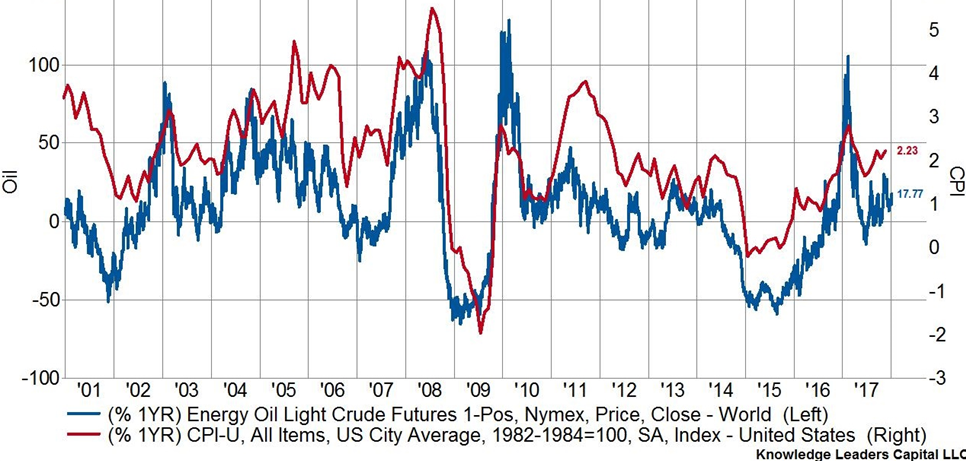
Figure 9: Change in Oil Price vs. CPI [21].
Thus, based on the analysis of the changes in the three major economic metrics above, we can conclude that the rise of securitized products, together with the rate cut from the fed has led to a very loose credit condition before the GFC. As a result, the US enjoyed positive GDP growth and a decrease in the unemployment rate. However, the CPI data sends out a more mixed signal as it was affected by numerous global factors that were not controlled or directly affected by the credit condition of the U.S., for example, the rise in oil price was largely affected by the growing demand from China, which was less related to the economic condition within the U.S.
The U.S. Economy During the Global Financial Crisis. It is very hard to pinpoint the exact cause or the starting time of the GFC. Based on our research, we believe there was a confluent of factors that led to the crisis.
One factor is serious of rate hikes conducted by the Fed. As the economic condition improved after the dot-com bubble, the Fed started to raise rates in response to an overheating economy and the rising oil price. From mid-2004 to mid-2006, the Fed went through 17 consecutive rate hikes and raised the interest rate from 1.25% to 5.25% in the 2 years (Figure 7). Opposite to the effects of lowering the fed fund rate, a rise in the fed fund rate will reduce the credits available in the economy through a higher borrowing rate, and as a result, the overall demand in the economy will also decrease.
Another factor is the size of the subprime mortgage in the system has grown exponentially in the year 2004 to 2006. Before 2004, subprime mortgage originations were around 300 billion per year and this figure almost doubled in 2005 and remained at a heightened level in 2006. The reason that there was a large drop in the originations in 2007 is that subprime mortgage originators started to see a higher delinquency rate for these types of debts.
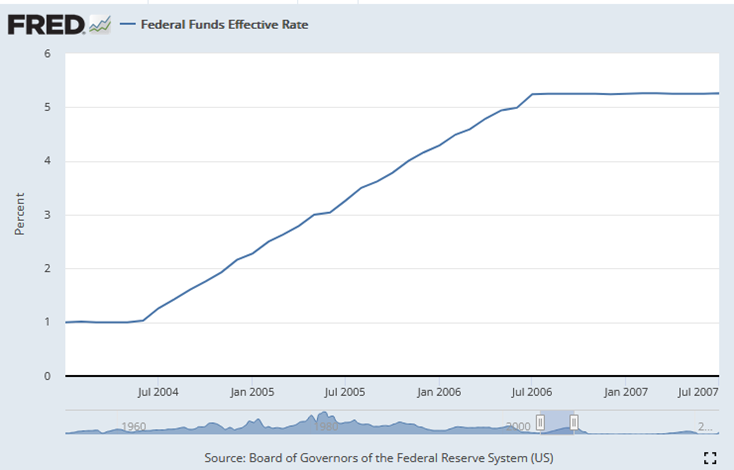
Figure 10: Fed Fund Rate from Mid-2004 to Mid-2006 (all data from Board of Governors of the Federal Reserve System (US)) [2].
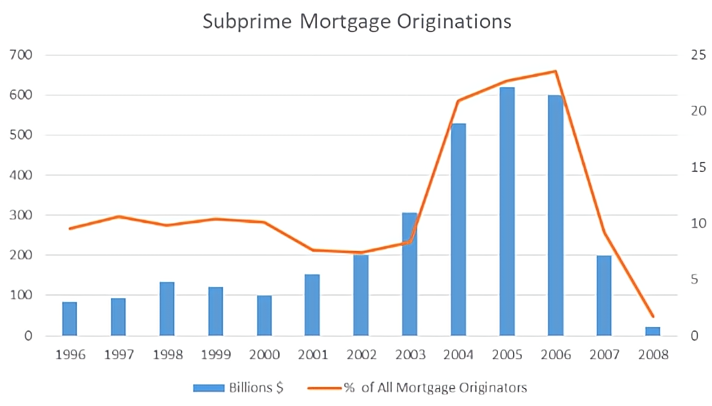
Figure 11: US Subprime Mortgage Originations from 1996 to 2008, source: Inside Mortgage Finance [22].
Since subprime mortgages tend to have a lower quality compared to prime mortgages, they are more sensitive to the deterioration of the economy and the credit environment. And the malpractice of reviewing and approving unqualified mortgages before the financial crisis had exacerbated the problem even more. Many of the subprime mortgages approved at that time can be described using acronyms NINA (no income, no asset) and NINJA (no income, no job or asset). Based on the stats from InsideMortgageFiance.com, the percentage of low-quality subprime mortgages rose from 8% to 20% in 2006, and almost 90% of these mortgages were Adjustable-Rate Mortgages which means the interest rate will increase with the rise of the Fed Fund Rate. In 2007, the adjustable rate of subprime mortgages was as high as 13% while the fixed rate of those mortgages was below 8%, which shows the impacts of a rising Fed Fund rate on these adjustable-rate mortgages. Thus, when the Fed hiked aggressively during that period, many low-quality borrowers started to fall behind their payment schedules and had no choice but to walk away from their mortgages.
Furthermore, before the breakout of the GFC, the percentage of mortgage holdings has also grown rapidly in US commercial banks, from around 20% in 2003 to 26% in 2008, which created a higher default risk for the banks. However, many banks were not aware of these risks because they falsely believed that the mortgage products that they have on their hands were securitized by the underlying assets, which means any loss incurred on the mortgages should be recouped from selling the underlying assets. And this was another key factor that led to the GFC. As analyzed in the first section of the paper, these securitized products, such as MBSs and CDOs are way riskier than they thought. They are highly leveraged, which means an adverse change in the market condition could cause the banks to lose ten times, even a hundred times more.
What’s more, this is what happened to the large financial institutions during that time. Well-known financial institutions such as Bear Stearns, AIG, Fannie Mae, and Freddie Mac all encountered liquidity or even solvency issues because they could not afford to pay for the losses on the securitized investments they owned. The Fed was also slow to respond. Then the bankruptcy of Lehman Brothers announced the start of one of the most severe economic recessions we ever had since the 1990s.
The impacts on the economy were initially in the housing market, where house prices dropped precipitously. Investment and employment in residential sectors peaked in 2006. One year later, the overall US economy peaked by the end of 2007. As we can see from the U.S. Real GDP growth chart below, quarterly GDP was still growing in the year 2007 and it started to drop in 2008 when the financial market started to see the spillover effects from the housing market. At the lowest point, the economy contracted by 8.5% in the fourth quarter of 2008, then contracted deeply again in the first quarter of 2009 (Figure 9). Studies by the Congressional Budget Office show that the financial crisis has cost the U.S. an estimated $648 billion due to a slowdown of the economy, which is equivalent to approximately $5800 per U.S. household. In other asset classes, such as the housing market, the U.S. lost around $3.4 trillion in real estate values according to the Federal Reserve, which is roughly equivalent to $30,300 per U.S. household. The stock market was nothing better. The total market cap of the S&P 500 fell 48% from its peak in August to 2008.
Meanwhile, the unemployment rate, one of the most widely recognized indicators of a recession almost doubled during the period time, from 5% in December 2007 to 9.5% in June 2009, and peaked at 10% in October 2009 (Figure 10). Also, based on the statistics from the U.S. Bureau of Labor Statistics, the long-term unemployment rate, which calculates the percentage of unemployed who don’t have a job for 27 weeks or longer, rose significantly to 4.4% after the crisis. This has never happened in any other previous recessions. In total, 5.5million jobs were lost during the crisis.
The recession also impacted industries differently. Traditionally, recessions tend to affect goods manufacturers the most, which is also the case in the 2008 recession. The manufacturing and construction sectors both had the largest declines in employment since WWII. The employment rate declined by 10% in the manufacturing section and declined 13.7% in the construction sector. The Financial sector was also severely battered and shed 3.9% of the workforce. However, an interesting phenomenon was that the employment rate surprisingly increased in Education and Health sectors. Besides the fact that these two sectors had a long-term robust expansion rate regardless of the business cycle, the winter in the job market also drove more people to take the time to go back to school and recharge. The number of students who enrolled in universities increased by nearly 16% since the start of the recession. The number of undergraduate students increased from 15.6 million in the fall of 2007 to 18.1 million in the fall of 2010.
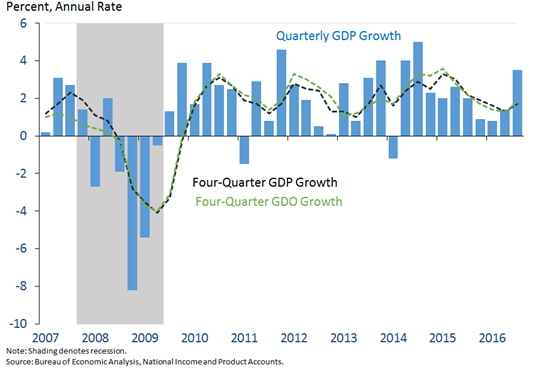
Figure 12: Real GDP and GDO growth in the U.S., 2007-2016 [23].
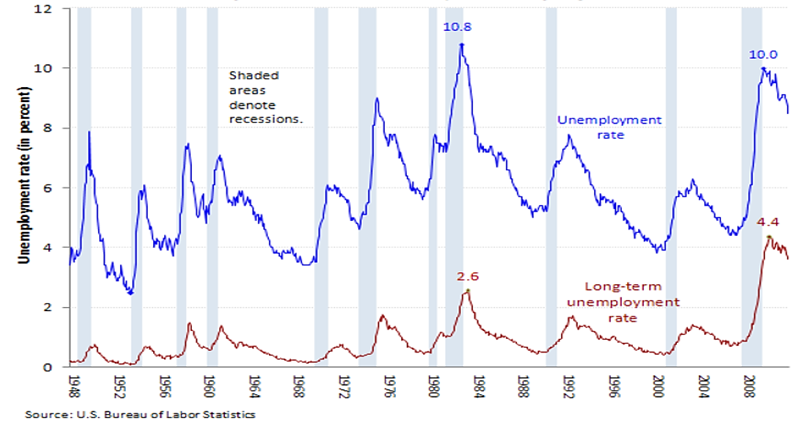
Figure 13: Unemployment rate and long-term unemployment rate, Jan 1948-Dec 2011 (all data from U.S. Bureau of Labor Statistics) [21].
In terms of inflation, in December 2008, the CPI decreased 0.7% on a seasonally adjusted basis, which was the third consecutive decline. According to the breakdown of the figure, the major cause of the decline in CPI was the decrease in energy prices, especially gasoline. Oil prices dropped to a low of $39.09 in February 2009 from their high of $134 in June 2008. The change in oil price was largely driven by a fall in global demand as the financial crisis has caused a sudden slowdown in the global economy.
The U.S. Economy Post the Global Financial Crisis. As the debt crisis deepened, all government agencies started to take action to save the economy.
The Fed responded to the crisis aggressively with a salute of programs that were designed to improve liquidity in the system. Firstly, the Fed decided to cut rates fast. In just one year, the Fed Fund Rate dropped from 5.25% in September 2007 to the lowest range possible, 0-0.25% in December 2008. Secondly, the Fed also started to use untraditional intervention methods, which include using forward guidance to guide the economy. The Fed mentioned that this extremely low rate will stay for an extended period. The language used in the forward guidance has reduced uncertainty in the economy so people could start to have a long-term plan without worrying about the unexpected changes in the fed fund rate shortly. However, both methods had only provided a small relief to the economy. Because the recession fear was too high, no one wanted to take any risks in the financial market. And this has caused a severe liquidity problem. To remedy this issue, the Fed took two more untraditional policy actions.3 One is that the Fed established the “Term Auction Facility (TAF)” in December 2007 to provide loans to depository institutions in a generally sound financial condition to meet demands for term funding. The Fed also established temporary central bank liquidity swap lines to help foreign banks fund their short-term investment. The other action is the large-scale asset purchase (LSAP) program, which allows the Fed to purchase US agency MBS and the housing debt from U.S. government agencies such as Fannie Mac and Freddie Mac. This program has changed the dynamic of the MBS market. Before the Fed’s announcement, these assets were seen as toxic assets due to their high default rate and opaque underlying structures. However, the Fed has lifted the burden on many financial institutions who has these assets on their balance sheets. The Fed bought up to $500 billion in agency MBS and $100 billion in agency debt before 2010. The Fed also purchased $300 billion in long-term Treasury securities afterward. And these actions together are now called Quantitative Easing 1.
The Whitehouse also employed fiscal stimulus programs such as increased government spending and tax cuts to further help the economy.
Despite all the aggressive actions taken by the Fed and the U.S. government, the recovery of the economy was much slower than anticipated. After two-quarters of a deep slump, the U.S. economy started to grow again in mid-2009 but the recovery speed was below the historical average. From the third quarter of 2009 to the second quarter of 2012, the GDP growth was less than 50% of the past average. The Congressional Budget Office believed that 2/3 of the slowness can be attributed to a slowdown of potential GDP growth and the remaining 1/3 can be attributed to the slow pace of growth in the ratio of real GDP to potential GDP (Figure 11). Some research4 believes that the fiscal austerity imposed by Republicans was the root cause for this slow recovery. Data shows that government spending per capita in the 27 quarters after the crisis was about 3.5% slower than it was during the Great Recession, which was also much lower than the government spending rate in the past few recessions.
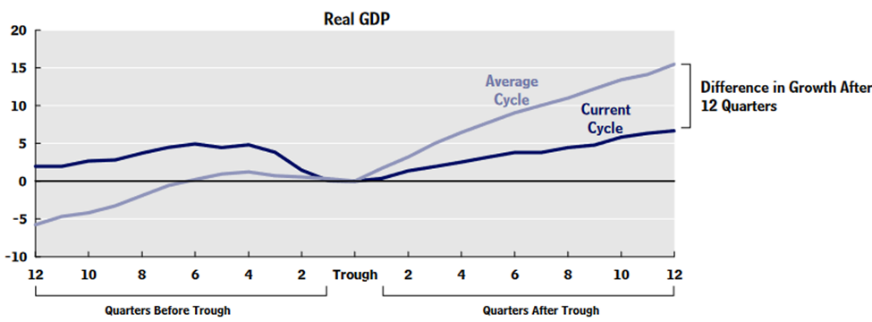
Figure 14: Gross domestic product before and after recession [24].
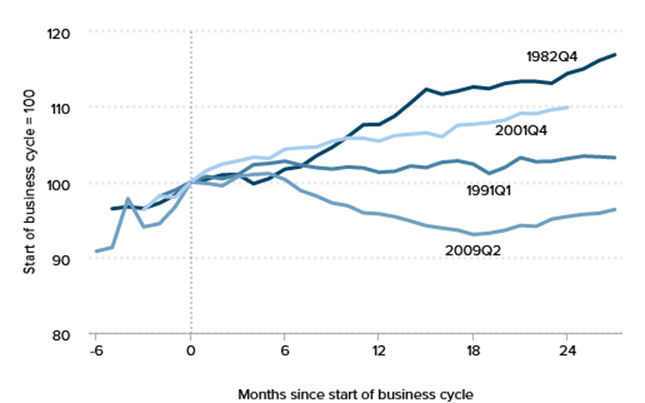
Figure 15: Change in per capita government spending over the last four business cycles [25].
For employment, the unemployment rate hit a 16-year low, 4.1%, in October 2017 after 10 years since the recession started. However, the total U.S. workforce shrank faster than before the crisis. And the long-term unemployment rate rose to a historical high.
In terms of CPI, the Fed was having difficulty raising the CPI rate. The CPI stayed low for a long period.
4. Conclusion
Across the board, the securitization and re-securitization of mortgages was a curse for the financial system in the early 20th century. Although the emergence of securitization had a positive impact and boosted the economy, the potential risks involved made the later losses sharply magnified and their losses far outweighed the gains.
The main positive impact of securitization is the increase in market liquidity. In the case of MBS and CDO, their issuance increased the liquidity of mortgages, transferred mortgage credit risk out, and drove financial institutions to inject cash flow into the market again to make mortgages so that the financial market boosted. However, there are problems with the structure of MBS and CDO themselves, making them carry extremely high potential risks, and these risks expand when there is a bubble in the housing market and eventually, they bring huge losses to financial institutions and the national economy.
Our group argues that MBS and CDO are underestimated in terms of default rate, which leads to their potential risk exceeding their predicted value. The first OLS linear regression model result shows the key effect caused by the unemployment rate and the housing price on the delinquency rate of residential mortgages, which is that the default rate could be affected by common factors so that it demonstrates the existence of a correlation between default rates. Then, based on the comparison of the expected losses that would be generated by CDO under different default rates of collateral securities, it shows that underestimating loan default rates leads to inaccurate bond risk ratings, in which the actual risk far exceeds the predicted level and CDO would generate larger expected losses. Furthermore, our group analyzes the evolving trend of real estate mortgages at that time, from the early 20th century to 2006. Since then, the U.S. housing market was booming, and home prices continued to grow. The banks believed that the possibility of default was extremely low because they could repay the mortgage by mortgaging the increase in house prices if the house prices rose, so they expanded the size of mortgage loans indiscriminately and a bubble formed in the housing market, which expanded the potential risk exposure of the securitization dramatically.
After concluding the high potential risk exposure of the securitization at that time, our group discussed the impact after the potential risk was eventually exposed. In 2006, the U.S. government raised the interest rate to control inflation, the low-income loan group could not continue to repay the loan, so the default rate rose sharply and the potential risk of MBS and CDO was exposed due to the bubble burst of the housing market. Finally, our group again uses OLS linear regression model to show that equity return capacity is negatively correlated with nonperforming loans and MBS asset size. Based on the regression result and the data of the financial crisis, it demonstrates that MBS and CDO amplify the impact of subprime loan default. When housing prices fall and the bubble-stacked U.S. housing market comes crashing down, MBS and CDO evaporated their value at a dramatic rate. All their related financial products are reduced to nothing so that the companies holding them in large amounts go bankrupt or suffer a huge loss in profit.
Furthermore, from a macro view, the magnitude of the 2008 financial crisis was deeper and larger than other recessions which are amplified by the securitization and left a deep dent in the economy which took almost a decade to recover. Although the development of securitization boosted the economy from 2004 to 2006, the prosperity was short-lived and vulnerable to interest rate hikes. Although the artificially low fed fund rate has led to a decade-long booming economy after the recession, it seems that the economy is still standing on shaky grounds and many people believe that the low-interest rate has caused another bubble in the economy. After reviewing the development of the 2008 GFC, we believe the root cause can be traced back to the very liberal financial regulatory policies used before 2008, which led to the misuse of securitized products by major financial institutions, and this mistake was not discovered so that the securitization eventually amplifies the shock to the financial system. Therefore, to avoid the same mistake in the future, regulatory agencies have tightened the regulatory requirements for banks. In response, banks have also adopted a more stringent risk management policy. By limiting the systematic risk in the financial system, our group believes the U.S. economy has become more resilient now.
References
[1]. Freddie Mac. (2008, February). FEDERAL HOME LOAN MORTGAGE CORPORATION FREDDIE MAC INFORMATION STATEMENT AND ANNUAL REPORT TO STOCKHOLDERS For the fiscal year ended December 31, 2007. https://www.freddiemac.com/governance/pdf/2007annualrpt.pdf.
[2]. Federal Reserve Bank of St. Louis. (2022). Federal Funds Effective Rate [Graph]. https://fred.stlouisfed.org/series/DFF
[3]. Nowacki, L. (2022, July 15). The Average Mortgage Length In The U.S. Rocket Mortgage.https://www.rocketmortgage.com/learn/average-mortgage-length#:%7E:text=The%20most%20common%20mortgage%20term,mortgage%2C%20is%20under%2010%20years.
[4]. Vickery, J., & Wright, J. (2013, May). TBA Trading and Liquidity in the Agency MBS Market. https://www.newyorkfed.org/medialibrary/media/research/epr/2013/1212vick.pdf.
[5]. FRED. (2000c). Unemployment Rate [Dataset]. https://fred.stlouisfed.org/series/UNRATE.
[6]. FRED. (2022, May 20). Delinquency Rate on Single-Family Residential Mortgages, Booked in Domestic Offices, All Commercial Banks [Dataset]. https://fred.stlouisfed.org/series/DRSFRMACBS.
[7]. FRED. (2000a). All-Transactions House Price Index for the United States [Dataset]. https://fred.stlouisfed.org/series/USSTHPI.
[8]. Joyce, N. (2020, August 26). Basel II.5, Basel III, and Other Post-Crisis Changes. CFA, FRM, and Actuarial Exams Study Notes. https://analystprep.com/study-notes/frm/part-2/operational-and-integrated-risk-management/basel-ii-5-basel-iii-and-other-post-crisis-changes/.
[9]. Wojtowicz, M. (2010). CDOs and the Financial Crisis: Credit Ratings and Fair Premia. SSRN Electronic Journal. https://doi.org/10.2139/ssrn.1568309.
[10]. Statista. (2022, June 27). Residential mortgage backed security issuance in the U.S. 2003–2021. https://www.statista.com/statistics/275746/rmbs-issuance-in-the-united-states/.
[11]. Moody’s Investor Service,. (2008, March). 2008 U.S. CDO Outlook and 2007 Review: Issuance Down in 2007 Triggered by Subprime Mortgages Meltdown; Lower Overall Issuance Expected in 2008. https://fcic-static.law.stanford.edu/cdn_media/fcic-docs/2008-03-03%202008%20US%20CDO%20Outlook%20and%202007%20Review%20-%20Issuance%20Down%20in%202007%20Triggered%20by%20Subprime%20Mortgages%20Meltdown,%20Lower%20Overall%20Issuance%20Expected%20in%202008.pdf.
[12]. FRED. (2000b). Nonperforming Total Loans (past due 90+ days plus nonaccrual) to Total Loans (DISCONTINUED) [Dataset]. https://fred.stlouisfed.org/series/NPTLTL.
[13]. FRED. (2000–2022). Balance Sheet: Total Assets: Securities: Mortgage-Backed Securities [Dataset]. https://fred.stlouisfed.org/series/QBPBSTASSCMRTSEC.
[14]. FRED. (2020, December 10). Return on Average Equity for all U.S. Banks (DISCONTINUED) [Dataset]. https://fred.stlouisfed.org/series/USROE.
[15]. Subprime mortgage crisis. (2022, August 1). In Wikipedia. https://en.wikipedia.org/wiki/Subprime_mortgage_crisis#:%7E:text=During%202007%2C%20lenders%20had%20begun,%2C%20a%2021%25%20increase%20vs.
[16]. Uzialko, A. (2022, August 11). The Return of CDOs: Is Another Economic Crisis on the Horizon? Business News Daily. https://www.businessnewsdaily.com/10353-cdo-financial-derivatives-economic-crisis.html
[17]. LEHMAN BROTHERS HOLDINGS INC. (2006, December). Securitized Products Outlook for 2007: Bracing for a Credit Downturn. https://web.stanford.edu/~jbulow/Lehmandocs/docs/DEBTORS/LBEX-DOCID%20245013.pdf
[18]. Credit: DonkeyHotey / CC BY 2.0. (2018, November 28). U.S. GDP growth. continues impressive run. American Farm Bureau Federation - The Voice of Agriculture. Retrieved August 14, 2022. https://www.fb.org/market-intel/u.s.-gdp-growth-continues-impressive-run.
[19]. Cengage. (n.d.). Principles of Macroeconomics Study Guide. https://college.cengage.com/economics/0170186016_tennant/student/review/review/tennant_4e_review_ch17.html.
[20]. U.S. Department of Labor Bureau of Labor Statistics. (2006, June). Charting the U.S. Labor Market in 2005. https://www.bls.gov/cps/labor2005/chartbook.pdf.
[21]. U.S. BUREAU OF LABOR STATISTICS. (2012, February). The Recession of 2007–2009: BLS Spotlight on Statistics. https://www.bls.gov/spotlight/2012/recession/.
[22]. Andrea Rubini(2019, June) The economic paradox of austerity after the 2008 crisis. https://www.researchgate.net/publication/333894677_The_Economic_Paradox_of_Austerity_after_the_2008_Crisis.
[23]. Jason Furman (2016,December 22) National Archives and Records Administration. Eight years of macroeconomic progress and the third estimate of GDP for the third quarter of 2016. National Archives and Records Administration. https://obamawhitehouse.archives.gov/blog/2016/12/22/eight-years-macroeconomic-progress-and-third-estimate-gross-domestic-product-third.
[24]. Congressional Budget Office. (2012, November). What Accounts for the Slow Growth of the Economy After the Recession? https://www.cbo.gov/system/files?file=2018-10/43707-SlowRecovery-one-column.pdf.
[25]. Josh Bivens (2016, August 11) Why is recovery taking so long-and who's to blame? Economic Policy Institute. https://www.epi.org/publication/why-is-recovery-taking-so-long-and-who-is-to-blame/.
Cite this article
Ran,R.;Niu,Z.;Zhang,Z.;Zhang,Y. (2023). Securitization: The “curse” of the Financial System during the 2008 Crisis. Advances in Economics, Management and Political Sciences,9,38-56.
Data availability
The datasets used and/or analyzed during the current study will be available from the authors upon reasonable request.
Disclaimer/Publisher's Note
The statements, opinions and data contained in all publications are solely those of the individual author(s) and contributor(s) and not of EWA Publishing and/or the editor(s). EWA Publishing and/or the editor(s) disclaim responsibility for any injury to people or property resulting from any ideas, methods, instructions or products referred to in the content.
About volume
Volume title: Proceedings of the 2nd International Conference on Business and Policy Studies
© 2024 by the author(s). Licensee EWA Publishing, Oxford, UK. This article is an open access article distributed under the terms and
conditions of the Creative Commons Attribution (CC BY) license. Authors who
publish this series agree to the following terms:
1. Authors retain copyright and grant the series right of first publication with the work simultaneously licensed under a Creative Commons
Attribution License that allows others to share the work with an acknowledgment of the work's authorship and initial publication in this
series.
2. Authors are able to enter into separate, additional contractual arrangements for the non-exclusive distribution of the series's published
version of the work (e.g., post it to an institutional repository or publish it in a book), with an acknowledgment of its initial
publication in this series.
3. Authors are permitted and encouraged to post their work online (e.g., in institutional repositories or on their website) prior to and
during the submission process, as it can lead to productive exchanges, as well as earlier and greater citation of published work (See
Open access policy for details).
References
[1]. Freddie Mac. (2008, February). FEDERAL HOME LOAN MORTGAGE CORPORATION FREDDIE MAC INFORMATION STATEMENT AND ANNUAL REPORT TO STOCKHOLDERS For the fiscal year ended December 31, 2007. https://www.freddiemac.com/governance/pdf/2007annualrpt.pdf.
[2]. Federal Reserve Bank of St. Louis. (2022). Federal Funds Effective Rate [Graph]. https://fred.stlouisfed.org/series/DFF
[3]. Nowacki, L. (2022, July 15). The Average Mortgage Length In The U.S. Rocket Mortgage.https://www.rocketmortgage.com/learn/average-mortgage-length#:%7E:text=The%20most%20common%20mortgage%20term,mortgage%2C%20is%20under%2010%20years.
[4]. Vickery, J., & Wright, J. (2013, May). TBA Trading and Liquidity in the Agency MBS Market. https://www.newyorkfed.org/medialibrary/media/research/epr/2013/1212vick.pdf.
[5]. FRED. (2000c). Unemployment Rate [Dataset]. https://fred.stlouisfed.org/series/UNRATE.
[6]. FRED. (2022, May 20). Delinquency Rate on Single-Family Residential Mortgages, Booked in Domestic Offices, All Commercial Banks [Dataset]. https://fred.stlouisfed.org/series/DRSFRMACBS.
[7]. FRED. (2000a). All-Transactions House Price Index for the United States [Dataset]. https://fred.stlouisfed.org/series/USSTHPI.
[8]. Joyce, N. (2020, August 26). Basel II.5, Basel III, and Other Post-Crisis Changes. CFA, FRM, and Actuarial Exams Study Notes. https://analystprep.com/study-notes/frm/part-2/operational-and-integrated-risk-management/basel-ii-5-basel-iii-and-other-post-crisis-changes/.
[9]. Wojtowicz, M. (2010). CDOs and the Financial Crisis: Credit Ratings and Fair Premia. SSRN Electronic Journal. https://doi.org/10.2139/ssrn.1568309.
[10]. Statista. (2022, June 27). Residential mortgage backed security issuance in the U.S. 2003–2021. https://www.statista.com/statistics/275746/rmbs-issuance-in-the-united-states/.
[11]. Moody’s Investor Service,. (2008, March). 2008 U.S. CDO Outlook and 2007 Review: Issuance Down in 2007 Triggered by Subprime Mortgages Meltdown; Lower Overall Issuance Expected in 2008. https://fcic-static.law.stanford.edu/cdn_media/fcic-docs/2008-03-03%202008%20US%20CDO%20Outlook%20and%202007%20Review%20-%20Issuance%20Down%20in%202007%20Triggered%20by%20Subprime%20Mortgages%20Meltdown,%20Lower%20Overall%20Issuance%20Expected%20in%202008.pdf.
[12]. FRED. (2000b). Nonperforming Total Loans (past due 90+ days plus nonaccrual) to Total Loans (DISCONTINUED) [Dataset]. https://fred.stlouisfed.org/series/NPTLTL.
[13]. FRED. (2000–2022). Balance Sheet: Total Assets: Securities: Mortgage-Backed Securities [Dataset]. https://fred.stlouisfed.org/series/QBPBSTASSCMRTSEC.
[14]. FRED. (2020, December 10). Return on Average Equity for all U.S. Banks (DISCONTINUED) [Dataset]. https://fred.stlouisfed.org/series/USROE.
[15]. Subprime mortgage crisis. (2022, August 1). In Wikipedia. https://en.wikipedia.org/wiki/Subprime_mortgage_crisis#:%7E:text=During%202007%2C%20lenders%20had%20begun,%2C%20a%2021%25%20increase%20vs.
[16]. Uzialko, A. (2022, August 11). The Return of CDOs: Is Another Economic Crisis on the Horizon? Business News Daily. https://www.businessnewsdaily.com/10353-cdo-financial-derivatives-economic-crisis.html
[17]. LEHMAN BROTHERS HOLDINGS INC. (2006, December). Securitized Products Outlook for 2007: Bracing for a Credit Downturn. https://web.stanford.edu/~jbulow/Lehmandocs/docs/DEBTORS/LBEX-DOCID%20245013.pdf
[18]. Credit: DonkeyHotey / CC BY 2.0. (2018, November 28). U.S. GDP growth. continues impressive run. American Farm Bureau Federation - The Voice of Agriculture. Retrieved August 14, 2022. https://www.fb.org/market-intel/u.s.-gdp-growth-continues-impressive-run.
[19]. Cengage. (n.d.). Principles of Macroeconomics Study Guide. https://college.cengage.com/economics/0170186016_tennant/student/review/review/tennant_4e_review_ch17.html.
[20]. U.S. Department of Labor Bureau of Labor Statistics. (2006, June). Charting the U.S. Labor Market in 2005. https://www.bls.gov/cps/labor2005/chartbook.pdf.
[21]. U.S. BUREAU OF LABOR STATISTICS. (2012, February). The Recession of 2007–2009: BLS Spotlight on Statistics. https://www.bls.gov/spotlight/2012/recession/.
[22]. Andrea Rubini(2019, June) The economic paradox of austerity after the 2008 crisis. https://www.researchgate.net/publication/333894677_The_Economic_Paradox_of_Austerity_after_the_2008_Crisis.
[23]. Jason Furman (2016,December 22) National Archives and Records Administration. Eight years of macroeconomic progress and the third estimate of GDP for the third quarter of 2016. National Archives and Records Administration. https://obamawhitehouse.archives.gov/blog/2016/12/22/eight-years-macroeconomic-progress-and-third-estimate-gross-domestic-product-third.
[24]. Congressional Budget Office. (2012, November). What Accounts for the Slow Growth of the Economy After the Recession? https://www.cbo.gov/system/files?file=2018-10/43707-SlowRecovery-one-column.pdf.
[25]. Josh Bivens (2016, August 11) Why is recovery taking so long-and who's to blame? Economic Policy Institute. https://www.epi.org/publication/why-is-recovery-taking-so-long-and-who-is-to-blame/.