


1. Introduction
Stock price crash risk is a core concern in both modern financial markets and corporate governance research. It is defined as the possibility of extreme negative fluctuations in a company's future stock price [1], often manifested as severe and abrupt declines.
Crucially, managerial withholding of adverse information leads to sudden price collapses upon eventual disclosure [2,3]. These crashes instantaneously erode investor wealth, particularly harming less-informed retail investors, thereby undermining market confidence and increasing systemic panic. Furthermore, such events raise financing costs (both equity and debt), damage corporate reputations, trigger regulatory scrutiny and litigation, and disrupt operational continuity. Moreover, Hutton et al. demonstrate that opaque reporting fosters the persistent accumulation of hidden negative news, heightening systemic fragility and triggering abrupt market declines once the information is released [2]. This chain reaction threatens market stability, impairs the efficiency of financial systems, and may even amplify systemic risks.
As an emerging market, our country is characterized by relatively opaque information, high information collection costs, and a relatively lenient regulatory environment [4]. In the context of China’s capital markets, these concerns are even more pronounced. The A-share market is characterized by a dominant presence of retail investors, who are particularly vulnerable to sentiment-driven market fluctuations, along with higher stock price synchronicity, lower accounting information transparency [5], elevated volatility, and pronounced information asymmetry. Consequently, given China’s vast economic scale and investor base, stock price crashes in this environment may result in severe wealth destruction and significant socio-economic impacts.
The risk of stock price crashes varying significantly across different industries in China is noteworthy. For example, the manufacturing industry, as a cyclical sector, is characterized by its heavy asset nature, high dependence on policies (such as capacity control and environmental regulations), and sensitivity to macroeconomic conditions. As a result, there is an increased likelihood of negative information clustering during economic downturns, leading to a heightened probability of stock price crashes. Conversely, industries like information transmission and software technology services, which feature rapid technological change, a high proportion of intangible assets, and significant informational asymmetry, make it easier for management to withhold adverse news related to technological setbacks or R&D failures. Once adverse news accumulates to a certain threshold, it may trigger more severe stock price crashes. Therefore, different industries, because of their unique characteristics, can create varying degrees of crash risk on stock price.
Previous researches have identified several critical drivers of stock price crash risk, including geopolitical shocks, which trigger sustained reductions in investment, employment, and equity prices [6], as well as corporate tax avoidance, which risks of firm-specific crashes [7]. From a China-specific perspective, Ren et al. extend this knowledge by linking controlling shareholders’ stock pledges to a heightened probability of crashes [8]. Despite extensive exploration of both external shocks and firm-level influences, an obvious gap remains in the literature with the impact of CEO’s power concentration of stock price crash risk. In particular, the influence of CEO power on stock price crash risk in Chinese firms remains inadequately explored, with both the mechanisms and empirical effects still under-examined.
As a crucial participant in corporate strategic policy-making and governance mechanisms, the allocation of CEO power and its economic consequences have always been the research focus in the domain of corporate governance. CEO power is manifested as the influence and control over corporate decisions. The various components of CEO power have been systematically defined by the academic community, and related studies have further revealed its dual effects in the growth of business entities and provided a theoretical foundation for in-depth exploration of the mechanism at specific situations.
Most existing studies generally contend that the composition of CEO power can be delineated from multiple dimensions. Structural Power, this is primarily evidenced by whether there is an overlap between the CEO and chairman roles (the dual - role). As CEO assumes this dual position, it directly enhances their control which is above board of directors. The structural arrangement offers the CEO with greater influence within the corporate governance structure [9,10]. Ownership Power, it is gauged by the CEO’s shareholding proportion in the company. A greater shareholding proportion implies a stronger alignment of the CEO’s interests alongside those of the firm. Consequently, as the stake increases, the CEO’s decision - making autonomy also rises [9,10]. This relationship underscored the necessity of equity ownership in building CEO power. Expert Power, the dimension depends on the CEO’s professional title, sector experience, and tenure. A CEO with a longer tenure or a higher professional title is more prone to amassing professional authority. Over time and with advanced professional qualifications, CEOs gain more influence based on their expertise [11,12]. Reputation Power,the CEO’s educational background and external part-time positions are associated with this factor. A higher educational level or a greater number of external part - time roles increase the likelihood of the CEO acquiring resources and trust. Zhang et al. and Wang et al. have investigated how these factors contribute to the CEO’s reputation and, subsequently, their power within the organization [13,14]. Organizational Power could be reflected by the percentage of directors who are not independent. The relatively high proportion of non-independent directors indicates a stronger dominance of the CEO over the board’s decisions. The CEO’s influence within the organizational decision-making framework is reflected by this aspect of power [15].
CEO power’s beneficial influence on a firm’s management and operations has been empirically verified across various domains. In the domain of innovation [9], drawing on the data from Chinese listed companies, indicating that in enterprises which do not have state-owed share CEOs’ characterized by equity ownership could higher education levels, longer tenure, and CEO duality significantly enhance corporate innovation performance. The core mechanism identified is that power concentration improves innovation decision-making efficiency. Shi et al. further demonstrate that CEO power derived from ownership [11], expertise, and reputation can effectively promote exploratory innovation, aiding firms in balancing ambidextrous innovation strategies. In the domain of digital transformation [13], examining family firms, find that CEO power significantly facilitates digital transformation by strengthening long-term orientation (e.g., increasing investments in R&D and employee training). This facilitating effect is particularly pronounced when the CEO belongs to the family (of the firm’s owners). In the domain of technological capital and R&D investment, Zhou et al. posit that board human capital depth is correlated with R&D investment in positive way, and moderate CEO power strengthens this relationship by integrating internal and external resources to enhance technological accumulation efficiency [15]. Wang et al. find that the board’s social capital tends to exert an inhibitory effect on R&D investment, and CEO power can alleviate this effect [14]. Among firms listed on the Growth Enterprise Market (GEM) , this effect is especially prominent, where powerful CEOs enhance innovation investment levels through optimized resource allocation. In the domain of corporate strategy and performance [16], using data from the GEM, show that the ownership power of the CEO is positively regulating the relationship of R&D investment with enterprise performance. Equity incentive mechanisms can alleviate agency problems and improve R&D efficiency. Shao et al. confirm that marketization levels and internal control can moderate ambidextrous innovation investment through CEO power, thereby strengthening the contribution of exploratory innovation to long-term firm performance [12].
However, when CEO power is excessively concentrated, it can also trigger governance failures and the buildup of risks within a firm. Regarding agency problems, research on the European banking sector indicates that powerful CEOs (e.g., those with long tenure or high shareholdings) may harm minority shareholders’ interests by reducing dividend payout ratios [10]. Some studies further substantiate that CEOs with concentrated power might manipulate incentive contracts or engage in fraudulent activities to pursue private gains, thereby exacerbating principal-agent conflicts [17,18].
Concerning risk implications, the effect exerted by CEO’s power on stock price crash risk is particularly significant. Paper writing by Al Mamun et al. reveals that CEOs with high control exhibit a greater tendency on withholding bad news (e.g., by providing less negative earnings guidance or increasing the probability of financial restatements), intensifying information asymmetry and consequently increasing stock price crash risk [19]. Zheng et al. supplement this finding, arguing that when CEO power is substantial, the risk preferences reflected by a high radio facial width-to-height ratio (fWHR) further amplify crash risk through channels such as frequent mergers and acquisitions (M&A) and the inefficiency of investment [20].
Collectively, these studies illuminate the “double-edged sword” effect of CEO power, providing crucial evidence for understanding its contingency on governance contexts.
Although the relation between CEO power and the risk on stock price faced by firms collapse has received attention, existing studies still have significant limitations: limitations in sample coverage, as early studies mainly concentrate on the US market in the 2000s and had limited explanatory power for emerging markets [7]; the neglect of industry heterogeneity, although Zheng et al. conducted research based on Chinese A-share data, they did not distinguish specific industries, resulting in the failure to capture the differences in CEO power’s effect across different industries [20].
From the perspective on the mechanism of action, the literature from this generation has revealed three main pathways through which the power of the CEO affects the likelihood of stock price collapse: First, the information concealment mechanism, where a high-power CEO uses earnings management (manipulating accruals, manipulating actual activities) or reducing negative information disclosure to hide bad messages. Once the accumulated risk reaches a critical threshold, it is released all at once, triggering a collapse [20]; Second, the excessive risk-taking mechanism, where the concentration of power makes the CEO more likely to implement high-risk strategies (such as aggressive mergers and acquisitions, excessive investment), and the delayed disclosure of inefficient investments or failed projects further exacerbates the risk [19,20]; Third, the agency conflict mechanism, where the high-power CEO sacrifices the interests of shareholders for personal gain (such as consumption during employment, control rights income), leading to the erosion of company value and the collapse of market confidence [10,18].
The study addresses limitations of existing literature in sample coverage and industry heterogeneity: past research mainly focused on the U.S. market in the 2000s with limited explanatory power for emerging markets [7], and even Zheng et al. who used Chinese A-share data did not distinguish specific industries [20], while this study takes China’s A-share market (characterized by opaque information, high retail investor proportion, and low accounting information transparency [5] ) as the context, examines the different influence between CEO power on stock price crash risk and considers industry (e.g., cyclical manufacturing vs. information transmission and software technology services), filling prior gaps. Second, it enriches the mechanism research of CEO power affecting stock price crash risk and expands corporate holding structure studies in governance: existing literature identifies three core pathways (information concealment [20], excessive risk-taking [19,20] , and agency conflict [10,18]) but overlooks corporate holding structures, while this paper takes the “one control, multiple holdings” model as an entry point to explore its constraint on CEO autonomous decision-making and impact on crash risk, supplementing intermediate mechanism research. Finally, it provides new empirical evidence for emerging market corporate governance and practical implications: empirical tests confirm that stronger CEO power significantly increases crash risk and the “One Control One” structure amplifies this effect by weakening internal oversight, supporting the “double-edged sword” effect of CEO power (e.g., beneficial effects in innovation and negative effects in agency problems [9-11] ) and offering references for optimizing power allocation and maintaining market stability in emerging markets like China.
This study finds that greater CEO power remarkably promotes risk on stock. Significant industry heterogeneity exists, and the “One Control One” structure amplifies this detrimental effect by weakening internal oversight. The structure of remainder is as follows: Section 2 presents the relevant literature and illustrates the hypotheses; Section 3 reviews the data, variable definitions, and empirical methodology; Section 4 describes the main results, additional analyses, and robustness checks; and Section 5 concludes with discussions and implications.
2. Literature review and hypothesis development
2.1. Literature review
Present research has shown that CEOs with different levels of power are associated with stock crash risk. Regarding the causal relationship between powerful CEOs and stock crash risk, Al Mamun et al. demonstrate that CEO power is positively correlated with the risk of stock price collapse, being measured by negative conditional yield skewness (NCSKEW) and the up-down volatility ratio (DUVOL) [19]. With high power, Ma and Wu note that formal authority enables CEOs to integrate information and reduce internal conflicts, overcoming organizational inertia and enhancing the positive effects of experience [21]. However, excessive informal power among CEOs may lead to overconfidence and disregard for suggestions, weakening the positive effects of experience and amplifying negative impacts. This relationship remains significant even the formula controlling for earnings management, tax avoidance behavior, CFO option incentives and CEO overconfidence [21]. After employing methods such as instrumental variables (including whether the founder has passed away or the number of living founders), fixed effect models, exogenous CEO turnover event analysis, and propensity score matching, the above positive correlation remains significant with robustness [21]. Thus, the correlation among powerful CEOs and stock crash risk is strongly established. Moreover, Xu et al. emphasize that internal alliances are significantly related with the risking proportion of stock price crash positively and that they are more important predictive factors compared to power indicators such as CEO tenure and dual positions [22].
However, concerning the relationship between CEO’s characteristics and risk om stock market, Zhao et al. highlight that CEO characteristics exhibit a non-linear relationship with the risk of stock price collapse through the gradient boosting tree model [23]. This association differs from that between CEOs and stock prices. Additionally, Saiyed et al. point out that CEO power has a negative moderating effect on the relationship which is inverted U-shaped between entrepreneurial orientation and enterprise performance [24]. Specifically, in cases of low CEO power, entrepreneurial orientation can lead to higher performance among the moderate level, while high CEO power weakens the positive impact of entrepreneurial orientation on performance [24]. In this way, CEOs may affect stock crash risk through excessive power that results in worse performance. Meanwhile, the above conclusion remains valid after conducting tests using random effect models, performance measurements with different lags, alternative CEO power indicators, and alternative performance indicators [24]. When clarifying CEO types, Zhao et al. use the K-means clustering algorithm to categorize CEOs into "leadership type" (characterized by older age, high power, high holdings, and salaries) and "reform type" (marked by high openness, overconfidence, and rich experience) to identify varying levels of influence [23].
The consequence of CEO’s power like dividend could also affect stock crash risk. So, regarding dividend factors related to CEOs, Onali et al. utilize variable selection and data collection to analyze that CEO shareholding, tenure, and dividend payout ratios are negatively correlated, while non-mandatory CEO replacement is positively correlated with dividends [10]. They also find that high shareholding and long tenure are negatively correlated with bank performance [10]. Furthermore, Onali et al. show that non-mandatory replacement is positively correlated with performance, indicating that powerful CEOs tend to maintain low dividends, which is detrimental to both performance and stock price stability [10]. Also, Hu mentions the performance of earnings every share and return on net assets in "one holding multiple" private companies is obviously lower than that of non-"one holding multiple" private companies [25]. Significant difference in performance between "one holding multiple" state-owned companies and non-"one holding multiple" state-owned ones does not exist [25]. Moreover, the extensive shareholding companies described by Berle and Means are not a common phenomenon becase they are only found in large companies in wealthy common-law countries whose shareholder protection is strong [26]. When it comes to the behavior of CEOs, the group effects exist as well. Xu et al. classified it into "true herd behavior" (ignoring private information and following others) and "false herd behavior" (based on common information or preferences) which could higher or lower the risk of stock crash risk [4]. Thus, powerful CEOs may possess characteristics that exert more significant effects on stock price crashes. Finally, Ma and Wu note that a CEO's prior experience has dual effects on breakthrough innovation, with an optimal level existing [21]. Existing research primarily focuses on European datasets. Therefore, the study will further explore the relationship between powerful CEOs and stock crash risk, particularly in China's new energy sector.
2.2. Hypothesis development
The association between CEO power and stock price crash risk is theoretically grounded in issues of corporate opacity and agency problems. Jin and Myers argue that opaque financial reporting enables managers to withhold firm-specific bad news [1]. As this concealed negative information accumulates and surpasses a critical threshold, managers are compelled to disclose it suddenly, resulting in a sharp stock price decline. Under the framework of principal-agent, when CEOs have significant power, they not only have the means but also the perceived legitimacy to use company resources for their own benefit and to conceal negative information from investors [19]. Within this context, powerful CEOs have even greater incentives and opportunities to withhold adverse information, thereby intensifying the risk of future price crashes.
CEO power—manifested through control structure—substantially enhances a CEO’s capacity for information concealment. La Porta et al. provided a profound analysis of the agency problems that arise when ultimate controllers govern multiple listed companies through mechanisms such as pyramid structures, internal capital markets, and direct family management [26]. These mechanisms (such as hierarchical holding systems, resource allocation by group headquarters, and family members serving as senior executives), while strengthening control rights [26], significantly weaken the decision-making autonomy of CEOs within multi-company systems, reducing them to strategic agents of the controlling shareholder. By logical inference, when the ultimate controller governs only a single listed company, such constraining mechanisms are absent: the elimination of pyramid layers means the CEO is no longer subject to multi-layered strategic directives, shortening the decision chain; the absence of internal capital markets allows the CEO to regain authority over investment and financing; family members may not occupy the CEO position, granting professional managers greater operational space. This serves as counter-evidence for the inevitability of significantly increased CEO power under a single control structure. At this point, the CEO's enhanced autonomy (such as over disclosure policies) may incentivize information concealment [1], while the failure of the original pyramid’s monitoring mechanisms further weakens governance, ultimately exacerbating agency problems and increasing the risk of stock price crashes.
Synthesis and Hypothesis: Single control by the actual controller (one control one) provide CEOs with both the incentive and the ability to control the disclosure of firm information. In the high-stakes, uncertain environment of China’s industries, the motivation to conceal adverse news to protect personal wealth, reputation, and firm stability is especially acute. This concentration of both power and incentive often leads to situations in which negative news remains concealed within the firm and gradually builds up over time. When this accumulation crosses a critical threshold, its abrupt revelation results in a severe stock price crash [1,2]. Therefore, we hypothesize:
H1: Greater CEO power increase stock price crash risk in China’s capital market
3. Methodology
In this part, the data source and the sample selection process will be described. Based on our assumptions and previous studies from other scholars, we describe how we define stock price crash risks and CEO power, then we will present other control variables. Our research uses 13 core variables and 14,074 main observations. We collected all the data through CSMAR and used it legally. Our sample focuses on all firms in China that are already registered on the stock market; we chose stock market data from 2018 to 2022 to complete our explanation. To make our research more robust, we excluded special treatment (ST) and financial sector A-shares, which have financial distress and abnormal operations. Specifically, we excluded firms with CEO turnover within the four years to ensure that we focus on one specific CEO in each firm, rather than different individuals.
3.1. Define stock price crash risk
For understanding stock price crash risk, we use three measurements to accomplish this goal. The data calculation process is based on Xu and selected by us [4]. The primary measurement we use is negative conditional return skewness (NCSKEW). This kind of measurement is inspired by Al Mamun et al. [19]. NCSKEW measures asymmetry (skewness) in a stock’s return distribution. Specifically, it quantifies the extent to which a stock’s returns are left-skewed, which refers to a higher possibility of extreme bad returns. Therefore, higher the NCSKEW’s value are, higher the crash risk will be. The calculation formula is as follows.
The next measurement of the risk in crash we use is the down-to-up volatility (DUVOL). DUVOL captures the negative’s relative volatility versus positive returns. It compares the standard deviation of "down" days (returns below the mean) to that of "up" days (returns above the mean). Same as NCSKEW, a higher DUVOL also represents a higher risk of crashing. Similarly, the calculation formula is showed below.
Our last measure is the Crash measure. The Crash indicator is defined as 1 if
3.2. Define CEO powers
The definition of CEO power is complex. Al Mamun et al. defined CEO power by three indicators: CEOFO, where the CEO is the firm’s founder; CEOFEPCB, where the CEO being the founder and either the president, chair, or both; and CEOPRCH, where the CEO is both chair and president [19]. They believe that the positions a CEO holds can indicate their power. Similarly, Ma & Wu defined CEO power as being divided into formal power (derived from organizational hierarchy, e.g., titles), such as being a founder or chairman, and informal power (stemming from personal relationships, expertise, and reputation) [21]. Saiyed et al. also support that CEO power includes structural power (formal titles) and ownership power (equity stakes), which enable CEOs to influence board decisions [24]. Some other scholars use “one controls many” to define the power of a CEO (La Porta et al.) [26]. Their findings suggest that pyramid structures and internal capital markets, such as family management, can weaken the true controller’s power and thereby reduce the CEO’s power. And as Cao stated, managerial power is the ability of management to execute its own will and this kind of power comes from the positions and ownership [27].
In line with the above arguments and for our study, we use “one controls one” to measure CEOs’ power, which equals 1 if the true controller of a firm controls only one listed company and zero otherwise. This measurement allows us to quantitatively assess the power of the CEO.
3.3. Control variables
To mitigate endogeneity concerns and address potential omitted variable bias, we added five additional control variables. RET is the first to discuss, which are the annual average weekly rate of return. Our second control variable is SIGMA that refers to Annualized standard deviation of weekly return. The third variable we use is ROA that shows the percentage of return on total assets. The fourth is RDSpendsum, which refers to the amount of research and investment that requires for the developments. The variable BETA (β) captures the systematic risk of an security, computed within the Capital Asset Pricing Model (CAPM) framework. The estimation utilizes a rolling one-year horizon of historical return data to measure the asset's sensitivity to market fluctuations.
All the data are specially collected from CSMAR and some being calculated to present. They show the thing that might influence risk on stock crash besides CEO power we define. Considering them will make our study more solid and they can also be used as some mean causes that impact the stock price crash risk.
3.4. Sample selection and descriptive statistics
Table 1 presents the descriptive statistics of main variables. The CEO power and control variables are measured during the period from 2018 to 2021, while the future stock price crash risk variables correspond to the period from 2019 to 2022. The core findings are summarized as follows:
|
Variable |
count |
mean |
min |
max |
sd |
p50 |
skewness |
|
CEO power variables |
|||||||
|
OneControlOnet-1 |
14179 |
0.7212 |
0.0000 |
1.0000 |
0.4484 |
1.0000 |
-0.9866 |
|
Crash risk variables |
|||||||
|
NCSKEWt |
14924 |
-0.4324 |
-5.2573 |
5.0205 |
0.7708 |
-0.3715 |
-0.3599 |
|
DUVOLt |
14924 |
-0.2906 |
-3.0582 |
3.1674 |
0.4719 |
-0.2869 |
0.0257 |
|
CRASHt |
14924 |
0.0935 |
0.0000 |
1.0000 |
0.2912 |
0.0000 |
2.7917 |
|
Other variables |
|||||||
|
NCSKEWt-1 |
13640 |
-0.3853 |
-5.2573 |
5.0205 |
0.8165 |
-0.3441 |
-0.1248 |
|
DUVOLt-1 |
13640 |
-0.2568 |
-3.0582 |
3.1674 |
0.5008 |
-0.2630 |
0.2209 |
|
CRASHt-1 |
13640 |
0.1049 |
0.0000 |
1.0000 |
0.3065 |
0.0000 |
2.5786 |
|
Rett-1 |
14546 |
0.0026 |
-0.2560 |
1.2823 |
0.0211 |
0.0018 |
22.0340 |
|
Sigmat-1 |
14546 |
0.0659 |
0.0000 |
2.2652 |
0.0346 |
0.0607 |
19.8957 |
|
RDSpendSumt-1 |
13275 |
2.80E+08 |
0 |
3.99E+10 |
1.21E+09 |
6.95E+07 |
13.81952 |
|
BETAt-1 |
13322 |
1.1017 |
-10.0056 |
12.5269 |
0.3527 |
1.1087 |
0.1883 |
|
ROAt-1 |
14555 |
0.0405 |
-0.9497 |
0.8918 |
0.0849 |
0.0416 |
-1.8228 |
The mean of OneControlOne is 0.72, confirming that there is a tendency for power to be concentrated. -0.433 and -0.291 are the average data of Negative Coefficient of Skewness and Down-to-Up respectively. Negative means for these two indicators align with crash risk theory, reflecting stronger downside volatility. When it comes to our control variables, the average stock return (Ret) is 0.26%. The mean volatility (Sigma) is 6.6% and the mean beta coefficient (BETA1Year1) is 1.102. These descriptive statistics are consistent with founds in prior experiments on the determinants of stock price crash risk.
3.5. Correlation matrix
This research undertakes a correlation analytical approach to probing into the pairwise relationships among key variables, especially focusing on the linkage between managerial power and stock price crash risk. Moreover, consistency of multiple indicators employed to gauge stock price crash risk. For Pearson and Spearman correlation coefficients, correlation outcomes and encompassing are presented in Table 2 (Correlation Matrix). It is crucial to note that the lower-left triangle of the table displays Pearson correlation coefficients along with their corresponding p-values. Pearson correlation is appropriate for evaluating linear relationships between variables that follow a normal distribution. In contrast, the upper-right triangle presents Spearman correlation coefficients and their p-values—this non-parametric measure is effective in capturing monotonic relationships and demonstrates robustness against deviations from normality and the presence of outliers. Throughout the analysis, statistical significance is indicated by *, **, and ***, signifying significance at the 10%, 5%, and 1% levels corresponding to each data. This notation convention applies consistently in subsequent sections.
|
One Control Onet-1 |
NCSKEWt |
DUVOLt |
CRASHt |
Rett-1 |
Sigma t-1 |
RDSpendSumt-1 |
Betat-1 |
Roat-1 |
|
|
One Control Onet-1 |
0.032 (0.001***) |
0.032 (0.001***) |
0.03 (0.001***) |
0.013 (0.150) |
0.133 (0.000***) |
-0.15 (0.000***) |
0.085 (0.000***) |
0.091 (0.000***) |
|
|
NCSKEWt |
0.023 (0.013**) |
0.861 (0.000***) |
0.434 (0.000***) |
0.105 (0.000***) |
0.034 (0.000***) |
0.019 (0.040**) |
-0.017 (0.063*) |
0.074 (0.000***) |
|
|
DUVOLt |
0.025 (0.007***) |
0.871 (0.000***) |
0.36 (0.000***) |
0.096 (0.000***) |
0.036 (0.000***) |
0.016 (0.095*) |
-0.005 (0.568) |
0.07 (0.000***) |
|
|
CRASHt |
0.03 (0.001***) |
0.391 (0.000***) |
0.324 (0.000***) |
-0.031 (0.001***) |
-0.032 (0.001***) |
-0.029 (0.002***) |
-0.022 (0.018**) |
0.006 (0.501) |
|
|
Rett-1 |
0.005 (0.602) |
0.108 (0.000***) |
0.097 (0.000***) |
-0.033 (0.000***) |
0.338 (0.000***) |
0.014 (0.128) |
-0.08 (0.000***) |
0.114 (0.000***) |
|
|
Sigmat-1 |
0.146 (0.000***) |
0.041 (0.000***) |
0.042 (0.000***) |
-0.034 (0.000***) |
0.305 (0.000***) |
-0.09 (0.000***) |
0.208 (0.000***) |
-0.103 (0.000***) |
|
|
RDSpendSumt-1 |
-0.132 (0.000***) |
0.044 (0.000***) |
0.039 (0.000***) |
-0.064 (0.000***) |
0.116 (0.000***) |
-0.049 (0.000***) |
-0.024 (0.011**) |
0.028 (0.003***) |
|
|
Betat-1 |
0.087 (0.000***) |
-0.016 (0.086*) |
-0.005 (0.575) |
-0.024 (0.009***) |
-0.092 (0.000***) |
0.271 (0.000***) |
0.074 (0.000***) |
0.014 (0.120) |
|
|
Roat-1 |
0.145 (0.000***) |
0.098 (0.000***) |
0.089 (0.000***) |
-0.002 (0.816) |
0.132 (0.000***) |
-0.074 (0.000***) |
0.115 (0.000***) |
0.011 (0.255) |
Note: *, **, *** indicate significance at 10%, 5%, and 1% levels respectively, and the same applies below. The lower left part of the table shows the Pearson correlation coefficients of the corresponding variables, while the upper right part shows the Spearman correlation coefficients of the corresponding variables.
Stock price crash risk which has core dependent variable of the investigation is quantified using three indicators widely recognized and adopted in existing literature: NCSKEWₜ, DUVOLₜ, and CRASHₜ. To guarantee the dependability of the dependent variable measurement, the analysis first verifies the consistency of these three indicators through correlation tests. As depicted in Table 2, the bivariate correlation results among the three crash risk indicators are as follows. For Pearson correlations, the coefficient between NCSKEWₜ and DUVOLₜ is 0.861 (p < 0.001), signifying a strong positive linear relationship. The Pearson correlation coefficient between NCSKEWₜ and CRASHₜ is 0.434 (p < 0.001), while that between DUVOLₜ and CRASHₜ is 0.360 (p < 0.001). All three Pearson coefficients are statistically significant at the 1% level. Regarding Spearman correlations, the non-parametric association among the indicators further confirms their consistency. The Spearman correlation coefficient between NCSKEWₜ and DUVOLₜ reaches 0.871 (p < 0.001), and the Spearman correlation coefficients between NCSKEWₜ and CRASHₜ, and between DUVOLₜ and CRASHₜ, are 0.391 (p < 0.001) and 0.324 (p < 0.001), respectively (α=0.01) . The high magnitude of these coefficients and their consistent statistical significance across both Pearson and Spearman tests demonstrate that NCSKEWₜ, DUVOLₜ, and CRASHₜ effectively reflect the identical latent construct representing "stock price crash risk." This consistency not just validates the robustness of the dependent variable measurement but also lays a solid foundation for subsequent regression analyses, such as utilizing alternative indicators for robustness checks.
This study uses One Control Oneₜ₋₁, the core independent variable, to reflect managerial power, and this variable is defined by whether the CEO concurrently who is board chair (i.e., CEO duality). Hypothesis H1 of this study posits that "higher managerial power is positively associated with greater stock price crash risk," and the correlation analysis among One Control Oneₜ₋₁ and the three crash risk indicators provides preliminary evidence to support this hypothesis. From the perspective of Pearson correlations, the coefficients between One Control Oneₜ₋₁ and the three crash risk indicators are as follows: the coefficient with NCSKEWₜ is 0.032 (p < 0.001, α=0.01), the coefficient with DUVOLₜ is 0.032 (p < 0.001, α=0.01), and the coefficient with CRASHₜ is 0.030 (p < 0.001, α=0.01). Our analysis reveals that all three coefficients are going forward and statistically prominent at the 0.01 level. It further indicates that when firms get higher managerial power (as reflected by One Control Oneₜ₋₁ = 1), their NCSKEWₜ, DUVOLₜ, and CRASHₜ values tend to be higher. This outcome aligns with the expectation that managerial power risks the stock price crashes. The Spearman correlation results further reinforce the positive association between managerial power and crash risk: the Spearman correlation coefficient between One Control Oneₜ₋₁ and NCSKEWₜ is 0.023 (p = 0.013, α=0.05), the coefficient between One Control Oneₜ₋₁ and DUVOLₜ is 0.025 (p = 0.007, α=0.01), and the coefficient between One Control Oneₜ₋₁ and CRASHₜ is 0.030 (p < 0.001, α=0.01). These non-parametric results are consistent with the Pearson correlations; the positive coefficients (ranging from 0.023 to 0.030) and their statistical significance (at either the 1% or 5% level) confirm that the monotonic relationship between managerial power and crash risk is not driven by extreme values or non-normal distributions of the variables.
While the absolute values of the correlation coefficients among One Control Oneₜ₋₁ and the crash risk indicators are relatively small (ranging from 0.023 to 0.032), this is consistent with the characteristics of corporate finance studies. In such research, dependent variables like the risk of a stock price crash which are typically influenced by a multitude of factors, including firm size, leverage, and profitability, meaning the marginal effect of a single independent variable such as managerial power is often modest. More importantly, the statistical significance of these correlations (α≦0.05) reflects that the positive relationship between managerial power and risking crash is not a random occurrence but a statistically reliable pattern. This preliminary evidence offers initial support for Hypothesis H1, which will undergo further testing and validation in subsequent multiple regression analyses that control for other confounding variables.
To obtain a more thorough understanding of the correlation among variables, this section also briefly discusses the correlations between control variables and the core constructs of managerial power and crash risk. The controlling variables included in this research are ROAₜ₋₁ (lagged return on assets, used to measure firm profitability), Betaₜ₋₁ (lagged systematic risk of stocks), RD SpendSumₜ₋₁ (lagged total R&D expenditure, used to measure innovation input), Sigmaₜ₋₁ (lagged annualized standard deviation of weekly stock returns, used to measure idiosyncratic risk), and Retₜ₋₁ (lagged annual stock return, used to measure past stock performance). Key observations derived from the correlation matrix are as follows:
With respect to control variables, their correlations with core constructs (managerial power measured by One Control Oneₜ₋₁ and stock price crash risk) are as shows: ROAₜ₋₁ (profitability) shows a positive correlation with One Control Oneₜ₋₁ (Pearson: 0.028, p=0.003; Spearman: 0.014, p=0.120) and a positive correlation with crash risk indicators NCSKEWₜ and DUVOLₜ (Pearson: 0.032, p<0.001 for both); Betaₜ₋₁ (systematic risk) has a strong positive correlation with crash risk indicators, such as a Pearson coefficient of 0.434 with CRASHₜ and 0.861 with NCSKEWₜ (both p<0.001); RD SpendSumₜ₋₁ (innovation input) is negatively correlated with One Control Oneₜ₋₁ (Pearson: -0.150, p<0.001) and CRASHₜ (Pearson: -0.090, p<0.001); Sigmaₜ₋₁ (idiosyncratic risk) is positively correlated with crash risk indicators (e.g., Pearson: 0.338 with CRASHₜ, p<0.001) and negatively correlated with One Control Oneₜ₋₁ (Pearson: -0.049, p<0.001). Notably, the absolute values of correlation coefficients between One Control Oneₜ₋₁ and all controlling variables do not exceed 0.2 (maximum 0.150 between One Control Oneₜ₋₁ and RD SpendSumₜ₋₁), far below the 0.7 threshold for severe multicollinearity, ensuring reliability for subsequent regression analyses.
The correlation analysis yields three key findings. First, the three indicators (NCSKEWₜ, DUVOLₜ, CRASHₜ) are strongly and significantly correlated with one another, with both Pearson and Spearman coefficients being exhibits statistical significance at the 1% significance threshold. This confirms the consistency and reliability of the dependent variable measurement. Second, managerial power (measured by One Control Oneₜ₋₁) is positively and correlated highlighting with all three crash risk indicators, with significance at either 1% or 5% level. This provides preliminary evidence that higher managerial power increases stock price crash risk, thereby supporting Hypothesis H1. Third, the control variables (such as ROAₜ₋₁, Betaₜ₋₁, and RD SpendSumₜ₋₁) exhibit logical correlations with both managerial power and crash risk, and no significant multicollinearity exists between the variables, and this establishes a valid groundwork for the next step of multiple regression analysis.
It is important to emphasize that correlation analysis only captures pairwise associations and cannot establish causal relationships. The causal link between managerial power and risky crash in A-share market, and marginal effect of managerial power after controlling for other factors, will be rigorously tested in subsequent multivariate regression models.
3.6. Specific model
To identify the true relationship between CEO power and stock price crash risk, we employ linear models with high-dimensional fixed effects for estimation. The formula we use is as follows:
In the formula,
4. Result
4.1. Baseline results
Employing linear models with high-dimensional fixed effects, we incorporate our main data and variables into the model. After different rounds of calculation, we obtain our main results, which are presented in the baseline result table below.
|
VARIABLES |
NCSKEW |
||||
|
(1) |
(2) |
(3) |
(4) |
(5) |
|
|
Powert-1 |
0.056*** |
0.045*** |
0.142*** |
0.045*** |
0.142*** |
|
(0.015) |
(0.016) |
(0.049) |
(0.016) |
(0.049) |
|
|
Sigmat-1 |
-0.229 |
1.450*** |
-0.229 |
1.450*** |
|
|
(0.421) |
(0.529) |
(0.421) |
(0.529) |
||
|
Rett-1 |
13.212*** |
6.576*** |
13.212*** |
6.576*** |
|
|
(1.162) |
(1.329) |
(1.162) |
(1.329) |
||
|
Roat-1 |
0.439*** |
0.203 |
0.439*** |
0.203 |
|
|
(0.099) |
(0.168) |
(0.099) |
(0.168) |
||
|
NCSKEWt-1 |
0.060*** |
-0.233*** |
0.060*** |
-0.233*** |
|
|
(0.009) |
(0.011) |
(0.009) |
(0.011) |
||
|
Betat-1 |
-0.014 |
0.150*** |
-0.014 |
0.150*** |
|
|
(0.025) |
(0.035) |
(0.025) |
(0.035) |
||
|
RDSpendSumt-1 |
0.017** |
-0.032 |
0.017** |
-0.032 |
|
|
(0.008) |
(0.031) |
(0.008) |
(0.031) |
||
|
NCSKEW bar |
0.637* |
-0.168 |
|||
|
(0.333) |
(0.334) |
||||
|
DUVOL bar |
-0.064 |
1.400*** |
|||
|
(0.479) |
(0.487) |
||||
|
CRASH bar |
-1.536** |
-0.329** |
|||
|
(0.661) |
(0.131) |
||||
|
Constant |
-0.475*** |
-0.084 |
-0.218 |
-0.474*** |
-0.922*** |
|
(0.012) |
(0.125) |
(0.147) |
(0.034) |
(0.060) |
|
|
Observations |
14,074 |
11,632 |
11,170 |
11,632 |
11,170 |
|
R-squared |
0.001 |
0.023 |
0.357 |
0.023 |
0.357 |
|
Firm FE |
NO |
NO |
YES |
NO |
YES |
|
Year FE |
NO |
NO |
NO |
YES |
YES |
Table 3 is about main regression outcomes by using NCSKEW, which is selected from one of our definitions of stock price crash risk. It is presented in Table 2 that CEO power shows positive link and significant relationship with stock price crash risk. During the process, we first directly test the relation between CEO power and stock price crash risk, which shows a positive significance, but the R-squared is too small. Then we add our control variables, which changed the result between power and stock price crash risk. Next, we fix for year and firm fixed effects one after one, and finally, we make our move to include all the control variables and fixed effects in the regression model. We can see that the positively significant result is always maintained. A 1-unit increase in CEO power raises future crash risk by 14.2%. From Table 2, we can find that a 1-unit increase in the annual average weekly rate of return raises future crash risk by 657%, and a 1-unit increase in the rate of return on total assets will raise the future crash risk by 20%. This indicates that high-profit firms face higher crash risk. It can also be found that the NCSKEW of last year has a significantly negative impact on this year’s NCSKEW, so a 1-unit increase in prior crash risk decreases current risk by 23%, which we believe occurs because a previous stock crash increases the firm’s and then government’s attention. In the end, it makes the next year’s stock price crash risk lower.
4.2. Additional results
In the additional results part, we identify the causal relationship between CEO power and stock price crash risk by calculating the average treatment effect using implementing regression adjustment. Economically, we directly quantify the net causal effect of CEO power (the treatment variable) on another definitions of stock price crash risk (the outcome variable), isolating interference from other variables (e.g., Sigma, Ret). The specific result after calculation are obtained in table4 below.
|
NCSKEW |
DUVOL |
CRASH |
|
|
VARIABLES |
Coef. |
Coef. |
Coef. |
|
Power |
.0904*** |
.0476*** |
.0144*** |
|
(.015) |
(.009) |
(.0055) |
From the ATE results above, we can see a strongly significant and positive relationship between CEO power and stock price crash risk. This strong relationship indicates that whether the CEO has concentrated power or not does significantly affect crash risk. Additionally, we estimate ATE for three crash risk metrics (continuous: NCSKEW/DUVOL + binary: CRASH) to prevent distortions arising from measurement differences. As an additional test, the teffects method we use has considered the AI robust standard errors mentioned by Abadie & Imbens [28].
4.3. Robustness tests
To prove that our research is robust, we should use a different definition of stock price crash risk. If we see the result remains significantly positive, then we can believe that the relationship we discuss between CEO power and crash risk is true and robust. Therefore, we changed the variable NCSKEW to two other variables and, following the same calculation process as in the baseline results, we obtained and present our robustness check results in the table below.
|
Dependent Variables |
DUVOL |
CRASH |
||||
|
VARIABLES |
(1) |
(2) |
(3) |
(4) |
(5) |
(6) |
|
Powert-1 |
0.032*** |
0.027*** |
0.075** |
0.019*** |
0.019*** |
0.052*** |
|
(0.009) |
(0.010) |
(0.030) |
(0.006) |
(0.006) |
(0.019) |
|
|
Sigmat-1 |
-0.329 |
0.652** |
-0.533*** |
-1.189*** |
||
|
(0.258) |
(0.329) |
(0.159) |
(0.205) |
|||
|
Rett-1 |
8.060*** |
5.786*** |
-0.261 |
1.008* |
||
|
(0.712) |
(0.827) |
(0.438) |
(0.516) |
|||
|
Roat-1 |
0.225*** |
0.173* |
0.008 |
0.210*** |
||
|
(0.061) |
(0.105) |
(0.037) |
(0.065) |
|||
|
NCSKEWt-1 |
0.038*** |
-0.110*** |
-0.005 |
-0.047*** |
||
|
(0.006) |
(0.007) |
(0.003) |
(0.004) |
|||
|
Betat-1 |
0.006 |
0.119*** |
-0.018* |
0.046*** |
||
|
(0.015) |
(0.022) |
(0.009) |
(0.013) |
|||
|
RDSpendSumt-1 |
0.009* |
-0.036* |
-0.008*** |
0.017 |
||
|
(0.005) |
(0.019) |
(0.003) |
(0.012) |
|||
|
NCSKEW bar |
1.022*** |
-0.038 |
||||
|
(0.204) |
(0.126) |
|||||
|
DUVOL bar |
-0.701** |
0.182 |
||||
|
(0.294) |
(0.180) |
|||||
|
CRASH bar |
-1.754*** |
-0.123 |
||||
|
(0.405) |
(0.249) |
|||||
|
Constant |
-0.316*** |
0.076 |
-0.595*** |
0.081*** |
0.174*** |
0.047** |
|
(0.008) |
(0.077) |
(0.037) |
(0.005) |
(0.047) |
(0.023) |
|
|
Observations |
14,074 |
11,632 |
11,170 |
14,074 |
11,632 |
11,170 |
|
R-squared |
0.001 |
0.022 |
0.337 |
0.001 |
0.004 |
0.300 |
|
Firm FE |
NO |
NO |
YES |
NO |
NO |
YES |
|
Year FE |
NO |
NO |
YES |
NO |
NO |
YES |
Note: Standard errors in parentheses
*** p<0.01, ** p<0.05, * p<0.1
First, we changed NCSKEW to another continuous variable: DUVOL . We can see that after considering all the controlling variables and the fixed effects, the relationship still exists. Second, we used a binary variable: CRASH, and just as with NCSKEW and DUVOL, it still shows a strong connection. Basing on the regression results shown in Table 4, it is shown that changing the key variables does not alter the impact of CEO power. In this way, our research is robust.
4.4. Industry analysis
|
Label |
Industry |
|
BD(Energy-related) |
Mining Industry and Power, Heat, Gas, Water, Production and Supply Industry |
|
C |
Manufacturing Industry |
|
E |
Construction Industry |
|
K |
Real Estate Industry |
|
MI |
Scientific Research and Technical services Information Transmission, Software and Information Technology Services |
|
R |
Cultural, Sports and Entertainment Industries |
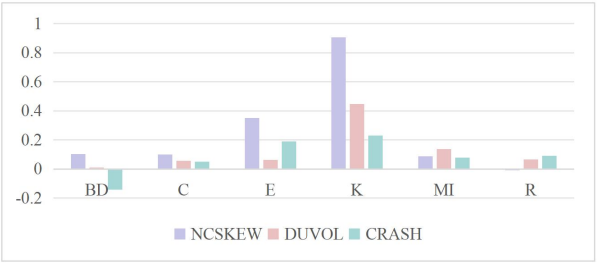
When it comes to different industries, we mainly focus on the BD, C, E, G, K, MI and R industry (Industry category from China Securities Regulatory Commission). After putting the controlling variables and fix effects such as firm and year, the study still shows some linear association between OneControlOne and NCSKEW, DUVOL and CRASH as below.
|
Industry |
NCSKEW |
DUVOL |
CRASH |
|
BD |
0.105 |
0.008 |
-0.141 |
|
C |
0.093 |
0.053 |
0.047 |
|
E |
0.351 |
0.061 |
0.189 |
|
G |
0.21 |
0.169 |
0.009 |
|
K |
0.741 |
0.334 |
0.179 |
|
MI |
0.077 |
0.105 |
0.077 |
|
R |
-0.01 |
0.064 |
0.091 |
Table 7 shows the significant linear association between BD industry and CRASH at -0.0141, C industry and CRASH at 0.047, K industry and NCSKEW at 0.741. Moreover, since BD industry relates to the energy, C industry is manufacturing part and K part is the Real Estate Industry we summarize that in industrial entity, CEO’s power level would is a necessary part in the stock market crash.
|
NCSKEW |
DUVOL |
CRASH |
NCSKEW |
DUVOL |
CRASH |
|
|
Industry |
BD |
C |
||||
|
OCO |
0.103 (0.199) |
0.008 (0.122) |
-0.143* (0.082) |
0.098 (0.064) |
0.056 (0.040) |
0.049** (0.024) |
|
Control |
√ |
√ |
√ |
√ |
√ |
√ |
|
Firm FE |
√ |
√ |
√ |
√ |
√ |
√ |
|
Obs |
479 |
479 |
479 |
7,956 |
7,956 |
7,956 |
|
Industry |
E |
K |
||||
|
OCO |
0.351 (0.260) |
0.061 (0.149) |
0.189** (0.084) |
0.907** (0.431) |
0.447* (0.264) |
0.230 (0.169) |
|
Control |
√ |
√ |
√ |
√ |
√ |
√ |
|
Firm FE |
√ |
√ |
√ |
√ |
√ |
√ |
|
Obs |
253 |
253 |
253 |
106 |
106 |
106 |
|
Industry |
MI |
R |
||||
|
OCO |
0.088 (0.178) |
0.135 (0.108) |
0.078 (0.067) |
-0.010 (0.532) |
0.064 (0.302) |
0.091 (0.164) |
|
Control |
√ |
√ |
√ |
√ |
√ |
√ |
|
Firm FE |
√ |
√ |
√ |
√ |
√ |
√ |
|
Obs |
1018 |
1018 |
1018 |
133 |
133 |
133 |
Table 8 integrates the primary dataset and relevant variables into our empirical specification, utilizing high-dimensional fixed effects linear models. Through a series of iterative estimation procedures, we derive the core empirical findings showing above.
The result highlights the relationship between BD industry and CRASH, R industry and NCSKEW is negative, which is opposite from our baseline result showing before. That means when the power of CEO decreases in the BD industry’s company or R industry, the stock crash risk would develop. In this way, people could consider granting the CEO greater authority in Mining Industry and Power, Heat, Gas, Water, Production and Supply Industry and Cultural, Sports and Entertainment Industries. Then strengthen the supervision of the power of CEOs in other industries at the same time. Also, the result shows that the Chinese market has greater regulatory control over the BD and R industries. Therefore, even if the CEO's power level increases, stock price crash would get less risk because of the stronger regulatory measures.
5. Conclusion
Stock price crash risk, usually shows as a sudden-declines, is a critical concern in financial markets and governance, eroding wealth and destabilizing systems. This risk is mostly pronounced in China's emerging A-share market due to opaque information environments, retail investor dominance, and high information asymmetry. While CEO power concentration can enhance innovation and performance, it may also enable bad news hoarding, encourage excessive risk-taking, and exacerbate agency conflicts, thereby increasing crash risk. Existing research lacks sufficient exploration of its impact in China, especially regarding industry heterogeneity and the constraining role of unique corporate control structures such as "one controls multiple".
Based on our research, we have, first, proven our hypothesis: greater CEO power increases stock price crash risk in China’s capital market. Greater CEO power—achieved through concurrent positions and exclusive control (i.e., “one controls one”)—enhances both the incentive and the ability to conceal negative firm information. In China’s highly uncertain institutional environment, this combination accelerates the number of undisclosed bad news, which, when suddenly revealed, leads to severe stock price crashes. Thus, CEO power heightens crash risk. Second, attention should be given to high-return firms. Conventional wisdom might suggest that low-return firms pose greater risks; however, our results related to the RET variable indicate that firms with high returns actually present higher crash risk in the subsequent period. Third, the government or firms should adopt constraining strategies after a market crash, as indicated by the significantly negative relationship between NCSKEWt-1 and current crash risk. After controlling for firm fixed effects, the R-squared increased substantially, leading us to conclude that the lagged crash risk measure itself exerts a meaningful outcome on a firm’s next round’s crash risk. Therefore, it is sure if a company takes actions to impose constraints following a crash, the risk in the next period will actually decrease.
References
[1]. JIN, L., & MYERS, S. (2006). R2 around the world: New theory and new tests☆. Journal of Financial Economics, 79(2), 257–292.
[2]. Hutton, A. P., Marcus, A. J., & Tehranian, H. (2009). Opaque financial reports, R2, and crash risk. Journal of Financial Economics, 94(1), 67–86.
[3]. Kousenidis, D. V., Ladas, A. C., & Negakis, C. I. (2014). Accounting conservatism quality of accounting information and crash risk of stock prices. The Journal of Economic Asymmetries, 11, 120–137. https: //doi.org/10.1016/j.jeca.2014.09.001
[4]. Xu, N., Yu, S., & Yi, Z. (2013). Institutional investors’ herding behavior and stock price crash risk. Journal of Management World. (7), 31–43.
[5]. Jiang, J., Qiu, J., Zhu, R., & Hu, H. (2020, March). Investor attention and stock price crash risk: Mitigation or aggravation? Securities Market Herald. 69-78.
[6]. Caldara, D., & Iacoviello, M. (2018). Measuring Geopolitical Risk. International Finance Discussion Paper, 2018(1222), 1–66.
[7]. Kim, J.-B., Li, Y., & Zhang, L. (2011). Corporate tax avoidance and stock price crash risk: Firm-level analysis. Journal of Financial Economics, 100(3), 639–662.
[8]. Ren, H., Xu, Y., & Wu, J. (2024). Controlling shareholders’ stock pledges and stock price crash risks. Finance Research Letters, 68, 105956. https: //doi.org/10.1016/j.frl.2024.105956
[9]. Tan, Q. M., Liu, N., & Dong, X. F. (2015). CEO power, property rights nature, and innovation performance. Journal of Harbin Institute of Technology (Social Sciences Edition), 17(3), 126–134. https: //doi.org/10.16822/j.cnki.hitskb.2015.03.017
[10]. Onali, E., Galiakhmetova, R., Molyneux, P., & Torluccio, G. (2016). CEO power, government monitoring, and bank dividends. Journal of Financial Intermediation, 27, 89–117. https: //doi.org/10.1016/j.jfi.2015.08.001
[11]. Shi, H. B., & Yang, D. (2017). The impact of CEO power allocation on enterprise ambidextrous innovation. Soft Science, 31(11), 49–51, 61. https: //doi.org/10.13956/j.ss.1001-8409.2017.11.11
[12]. Shao, Y. H., Ding, Q., & Bao, Q. (2022). CEO power intensity and enterprise ambidextrous innovation investment decisions: Moderating effects of marketization level and internal control. Science & Technology Progress and Policy, 39(4), 131–140.
[13]. Zhang, W. J., Li, K., & Wang, S. M. (2018). The internal mechanism of board capital on corporate innovation under the moderating role of CEO power. Management Review, 30(4), 70–82. https: //doi.org/10.14120/j.cnki.cn11-5057/f.2018.04.007
[14]. Wang, N., He, J., & Huang, J. (2017). The impact of board capital and CEO power on R& D investment: Evidence from GEM listed companies. Commercial Research, (1), 108–117. https: //doi.org/10.13902/j.cnki.syyj.2017.01.014
[15]. Zhou, J., Jin, Y. Y., & Yuan, D. L. (2013). The impact of board human capital and CEO power on enterprise R&D investment: Empirical evidence from high-tech listed companies in Shanghai and Shenzhen. Science of Science and Management of S.& T., 34(3), 170–180.
[16]. Liu, J. M., & Zhou, S. (2018). The impact of R&D innovation investment on GEM enterprise performance from the perspective of CEO power. Journal of Southwest University of Political Science & Law, 20(3), 118–126.
[17]. Morse, A., Nanda, V. K., & Seru, A. (2008). Are incentive contracts rigged by powerful ceos? SSRN Electronic Journal. https: //doi.org/10.2139/ssrn.687504
[18]. KHANNA, V., KIM, E. H., & LU, Y. (2015). CEO connectedness and corporate fraud. The Journal of Finance, 70(3), 1203–1252. https: //doi.org/10.1111/jofi.12243
[19]. Al Mamun, M., Balachandran, B., & Duong, H. N. (2020). Powerful CEOs and stock price crash risk. Journal of Corporate Finance, 62, 101582. https: //doi.org/10.1016/j.jcorpfin.2020.101582
[20]. Zheng, Z., Li, D., Zhong, T., Wang, T, & He, L. (2023). CEO facial structure and stock pricecrash risk, Accounting & Finance, 63(S1), 873-905. https: //doi.org/10.1111/acfi.13069
[21]. Ma, D., & Wu, W. (2024). Experience as a double-edged sword: CEO experience and power on breakthrough innovation. Management Decision. https: //doi.org/10.1108/md-12-2023-2268
[22]. Xu, L., Rao, Y., Cheng, Y., & Wang, J. (2020). Internal coalition and stock price crash risk. Journal of Corporate Finance, 64, 101640. https: //doi.org/10.1016/j.jcorpfin.2020.101640
[23]. Zhao, T., Wei, H., & Li, H. (2022). CEO characteristics and stock price crash risk warning. Journal of Fujian Business University, 42–49. CNKI. https: //doi.org/10.19473/j.cnki.1008-4940.2022.05.006
[24]. Saiyed, A. A., Tatoglu, E., Ali, S., & Dutta, D. K. (2023). Entrepreneurial orientation, CEO power and firm performance: An upper echelons theory perspective. Management Decision, 61(6). https: //doi.org/10.1108/md-05-2022-0641
[25]. Hu, J. (2009). “One control many” companies: Empirical analysis and theoretical explanation. Securities Market Herald, 8, 51–58.
[26]. La Porta, R., Lopez de Silanes, F., & Shleifer, A. (1998). Corporate ownership around the world. SSRN Electronic Journal, 54(2). https: //doi.org/10.2139/ssrn.103130
[27]. Cao, Y. (2025). Managerial power, bad news withholding and stock price crash risk. CNKI. https: //doi.org/10.27660/d.cnki.gzczu.2023.000605
[28]. Abadie, A., & Imbens, G. W. (2016). Matching on the estimated propensity score. Econometrica, 84(2), 781–807. https: //doi.org/10.3982/ecta11293
Cite this article
Li,J.;Teng,S.;Xu,M.;Yan,J. (2025). CEO Power and Stock Price Crash Risk: Evidence from Chinese Industries. Advances in Economics, Management and Political Sciences,241,40-58.
Data availability
The datasets used and/or analyzed during the current study will be available from the authors upon reasonable request.
Disclaimer/Publisher's Note
The statements, opinions and data contained in all publications are solely those of the individual author(s) and contributor(s) and not of EWA Publishing and/or the editor(s). EWA Publishing and/or the editor(s) disclaim responsibility for any injury to people or property resulting from any ideas, methods, instructions or products referred to in the content.
About volume
Volume title: Proceedings of ICFTBA 2025 Symposium: Global Trends in Green Financial Innovation and Technology
© 2024 by the author(s). Licensee EWA Publishing, Oxford, UK. This article is an open access article distributed under the terms and
conditions of the Creative Commons Attribution (CC BY) license. Authors who
publish this series agree to the following terms:
1. Authors retain copyright and grant the series right of first publication with the work simultaneously licensed under a Creative Commons
Attribution License that allows others to share the work with an acknowledgment of the work's authorship and initial publication in this
series.
2. Authors are able to enter into separate, additional contractual arrangements for the non-exclusive distribution of the series's published
version of the work (e.g., post it to an institutional repository or publish it in a book), with an acknowledgment of its initial
publication in this series.
3. Authors are permitted and encouraged to post their work online (e.g., in institutional repositories or on their website) prior to and
during the submission process, as it can lead to productive exchanges, as well as earlier and greater citation of published work (See
Open access policy for details).
References
[1]. JIN, L., & MYERS, S. (2006). R2 around the world: New theory and new tests☆. Journal of Financial Economics, 79(2), 257–292.
[2]. Hutton, A. P., Marcus, A. J., & Tehranian, H. (2009). Opaque financial reports, R2, and crash risk. Journal of Financial Economics, 94(1), 67–86.
[3]. Kousenidis, D. V., Ladas, A. C., & Negakis, C. I. (2014). Accounting conservatism quality of accounting information and crash risk of stock prices. The Journal of Economic Asymmetries, 11, 120–137. https: //doi.org/10.1016/j.jeca.2014.09.001
[4]. Xu, N., Yu, S., & Yi, Z. (2013). Institutional investors’ herding behavior and stock price crash risk. Journal of Management World. (7), 31–43.
[5]. Jiang, J., Qiu, J., Zhu, R., & Hu, H. (2020, March). Investor attention and stock price crash risk: Mitigation or aggravation? Securities Market Herald. 69-78.
[6]. Caldara, D., & Iacoviello, M. (2018). Measuring Geopolitical Risk. International Finance Discussion Paper, 2018(1222), 1–66.
[7]. Kim, J.-B., Li, Y., & Zhang, L. (2011). Corporate tax avoidance and stock price crash risk: Firm-level analysis. Journal of Financial Economics, 100(3), 639–662.
[8]. Ren, H., Xu, Y., & Wu, J. (2024). Controlling shareholders’ stock pledges and stock price crash risks. Finance Research Letters, 68, 105956. https: //doi.org/10.1016/j.frl.2024.105956
[9]. Tan, Q. M., Liu, N., & Dong, X. F. (2015). CEO power, property rights nature, and innovation performance. Journal of Harbin Institute of Technology (Social Sciences Edition), 17(3), 126–134. https: //doi.org/10.16822/j.cnki.hitskb.2015.03.017
[10]. Onali, E., Galiakhmetova, R., Molyneux, P., & Torluccio, G. (2016). CEO power, government monitoring, and bank dividends. Journal of Financial Intermediation, 27, 89–117. https: //doi.org/10.1016/j.jfi.2015.08.001
[11]. Shi, H. B., & Yang, D. (2017). The impact of CEO power allocation on enterprise ambidextrous innovation. Soft Science, 31(11), 49–51, 61. https: //doi.org/10.13956/j.ss.1001-8409.2017.11.11
[12]. Shao, Y. H., Ding, Q., & Bao, Q. (2022). CEO power intensity and enterprise ambidextrous innovation investment decisions: Moderating effects of marketization level and internal control. Science & Technology Progress and Policy, 39(4), 131–140.
[13]. Zhang, W. J., Li, K., & Wang, S. M. (2018). The internal mechanism of board capital on corporate innovation under the moderating role of CEO power. Management Review, 30(4), 70–82. https: //doi.org/10.14120/j.cnki.cn11-5057/f.2018.04.007
[14]. Wang, N., He, J., & Huang, J. (2017). The impact of board capital and CEO power on R& D investment: Evidence from GEM listed companies. Commercial Research, (1), 108–117. https: //doi.org/10.13902/j.cnki.syyj.2017.01.014
[15]. Zhou, J., Jin, Y. Y., & Yuan, D. L. (2013). The impact of board human capital and CEO power on enterprise R&D investment: Empirical evidence from high-tech listed companies in Shanghai and Shenzhen. Science of Science and Management of S.& T., 34(3), 170–180.
[16]. Liu, J. M., & Zhou, S. (2018). The impact of R&D innovation investment on GEM enterprise performance from the perspective of CEO power. Journal of Southwest University of Political Science & Law, 20(3), 118–126.
[17]. Morse, A., Nanda, V. K., & Seru, A. (2008). Are incentive contracts rigged by powerful ceos? SSRN Electronic Journal. https: //doi.org/10.2139/ssrn.687504
[18]. KHANNA, V., KIM, E. H., & LU, Y. (2015). CEO connectedness and corporate fraud. The Journal of Finance, 70(3), 1203–1252. https: //doi.org/10.1111/jofi.12243
[19]. Al Mamun, M., Balachandran, B., & Duong, H. N. (2020). Powerful CEOs and stock price crash risk. Journal of Corporate Finance, 62, 101582. https: //doi.org/10.1016/j.jcorpfin.2020.101582
[20]. Zheng, Z., Li, D., Zhong, T., Wang, T, & He, L. (2023). CEO facial structure and stock pricecrash risk, Accounting & Finance, 63(S1), 873-905. https: //doi.org/10.1111/acfi.13069
[21]. Ma, D., & Wu, W. (2024). Experience as a double-edged sword: CEO experience and power on breakthrough innovation. Management Decision. https: //doi.org/10.1108/md-12-2023-2268
[22]. Xu, L., Rao, Y., Cheng, Y., & Wang, J. (2020). Internal coalition and stock price crash risk. Journal of Corporate Finance, 64, 101640. https: //doi.org/10.1016/j.jcorpfin.2020.101640
[23]. Zhao, T., Wei, H., & Li, H. (2022). CEO characteristics and stock price crash risk warning. Journal of Fujian Business University, 42–49. CNKI. https: //doi.org/10.19473/j.cnki.1008-4940.2022.05.006
[24]. Saiyed, A. A., Tatoglu, E., Ali, S., & Dutta, D. K. (2023). Entrepreneurial orientation, CEO power and firm performance: An upper echelons theory perspective. Management Decision, 61(6). https: //doi.org/10.1108/md-05-2022-0641
[25]. Hu, J. (2009). “One control many” companies: Empirical analysis and theoretical explanation. Securities Market Herald, 8, 51–58.
[26]. La Porta, R., Lopez de Silanes, F., & Shleifer, A. (1998). Corporate ownership around the world. SSRN Electronic Journal, 54(2). https: //doi.org/10.2139/ssrn.103130
[27]. Cao, Y. (2025). Managerial power, bad news withholding and stock price crash risk. CNKI. https: //doi.org/10.27660/d.cnki.gzczu.2023.000605
[28]. Abadie, A., & Imbens, G. W. (2016). Matching on the estimated propensity score. Econometrica, 84(2), 781–807. https: //doi.org/10.3982/ecta11293