


1. Introduction and Statement of Problem
The problem we are trying to solve is the positive impact of data analytics on NBA teams. The National Basketball Association (NBA) is one of the top professional sports leagues in the US and Canada. The league has 30 clubs, 29 based in the US and one in Canada. It is the world's top men's professional basketball league. At the same time, relevant technologies have developed significantly recently. Analyzing data collections to identify trends and make judgments about the information they contain is known as data analytics (DA). Data analytics is increasingly carried out using specialist hardware and software.
This is an issue because, in most people's opinion, athletes' training is essential to the sports industry. However, with the development of the times and technology, even the sports industry data can be counted, quantified, and analyzed. This can help athletes, teams, and management reach their goals more efficiently. We have already seen some success stories in the sports industry using advanced data analytics technology. For example, Golden State Warriors have used data to help the players and the management board to make beneficial decisions through the 2010s. As a result, the team has won 4 championships since 2010. Thus, we also believe that data analytics could provide various advantages to the entire association in different ways, such as helping the players, managers, and broadcasting companies.
2. Research Methods
To find out the improvements and differences the data tools brought to the NBA, we look for the current application of the original extensive data statistics and data mining system in the NBA and its effects.
2.1. Main Discussion
Since the 1980s, the American Professional Basketball League (NBA) has used data management technology [1]. All players' on-site data, such as scores, rebounds, assists, blocks, steals, errors, and fouls, are listed [2][9]. The detailed data statistics of the NBA can provide not only the query work of a single player but also compare the performance of two players, including the performance of two players in opposing positions. For example, James can get 28 points per game, and Kobe can get 27 points. However, when the two meet, Kobe can get 30 points per game, and James can only get 24 points [11].
One way to collect the statistics is by using the Sportive camera system, which is installed in basketball arenas to monitor the location of the players and the ball 25 times per second in real time. Stats Perform the first organization to provide optical monitoring to the professional sports business and the NBA. In addition, the latest edition of Sportive has breakthroughs in computer vision and interactive learning, contributing to the company's market leadership.
After more than 30 years of accumulation and improvement, the NBA's data statistics and management are more mature and prosperous. Moreover, it can also provide analysis, including on-field efficiency and scoring area. In 2013, the NBA used the Sportive extensive data system and turned data into hotcakes [1]. The Sportive system, initially used for military purposes, has now appeared in the NBA arena. It can track the basketball-related actions of all players on the court, such as shooting, passing, touching the ball, covering, and running distance, and it presents these actions in the form of data. Unexpectedly, basketball also needs technology. Through the creation of the Sportive system, basketball players have become stronger and stronger. When this technology was born, the Mavericks first cited it and successfully reached the finals one year later in the 2005-2006 season. Then Sportive gradually became known to all basketball teams, and sportive was also accepted [1]. In 2009, the Spurs, Rockets, and Thunder successively applied the sports system to training and competitions. The same year, during the NBA Finals between the Lakers and the magic, the magic installed this system at their home. This was the first time the sportive system was introduced in the NBA finals. This means that the sportive system has been accepted by the NBA and has become exclusive to the NBA. This technology provides a basis for coaches to guide, train, and select players and allows sharing of data with broadcasters. The seemingly useless data can be valuable assets to bring considerable marketing value. [3]
Another illustration is how the Golden State Warriors reversed their fortunes after a multiyear span of relatively dismal performance. The Warriors were able to turn their fortunes around and improve their win-loss records after partnering with an analytics business to analyze data gathered from the arena's player-tracking cameras [10]. One of the most crucial findings is that the more three-point shots Warriors star guard Stephen Curry attempted from around the court, the greater the team's chances of winning [11]. The Warriors won NBA titles in 2015, 2017, and 2018, but in the 2019-20 season, cut short due to the coronavirus, they ended with the league's worst record. Despite this, the Warriors won each of these three championships.
The Warriors rely significantly on various data analysis tools, but Stats Performs among their favorites. Basketball coaches and analysts benefit from the capacity to monitor data, and Statistics may provide advanced statistics based on various variables, such as speed, distance, player separation, and ball control. They combine a vast historical database with player and ball tracking, yielding the most comprehensive and sophisticated basketball statistics. [8]
Similarly, to the Warriors, the Los Angeles Clippers have their favorite data analysis system. The Clippers CourtVision program offers a real-time depiction of basketball plays, the ability to enter a shot based on the probability of a ball passing through the hoop, and more. Because of these features, spectators may have a deeper understanding of the game, and Clippers CourtVision can simulate the experience of watching a live game. Due to the development of innovative technologies such as Clippers CourtVision, the franchise value of the Los Angeles Clippers has increased dramatically during the last five years. Big Data and Predictive Analytics were not considered essential until 2014, and there are now many work opportunities in this field. In 2015, the Los Angeles Clippers significantly focused on data analytics and technological innovation, and the club took a substantial stride forward by purchasing Clippers CourtVision. The Los Angeles Clippers currently generate roughly two billion six hundred million dollars annually. [7]
SportRadar is another company that collects and analyzes data and provides it to the NBA for reference. SportRadar is a full-service sports data, betting, trading, and player management platform company that collects and analyzes data and then creates services for media, oddsmakers, and sports leagues worldwide. SportRadar also offers real-time statistics and live game results. It also owns BetRadar, a platform of tools for bookmakers, including in-game and pre-match odds suggestions, results, market monitoring, and trading service. NBA and SportRadar have a long-term partnership so that the NBA would provide data to SportRadar, and also SportRadar themselves have data journalists on the court to collect data in each NBA game.
We can tell that the NBA pays much attention to using data to analyze their games and players. There are many stat's NBA uses to analyze the performance of their players, for example, Player Efficiency Rating (PER), Win Shares (WS), Offensive/Defensive Efficiency, etc. Data calculate all these stats. Below are some stats NBA uses to analyze their players. [3]
2.2. Player Efficiency Rating (PER)
Its goal is to measure a player's productivity per minute. Its statistical point value system adds all of a player's positive contributions to the team and subtracts all negative ones. Its advantage is that it considers a player's time and pace of play in a game to make it easier to compare different players. Its disadvantage is that there is no reliable defensive data to enter the formula. It is well known that steals and blocks cannot 100% define a player's influence on defense in a basketball game. For example, Alan Iverson was a three-time steals leader in NBA history (2001,2002,2003) [6]. However, he was only 6'0", liked to steal by gambling, and was not considered a defensive player in his whole career. Therefore, under the system of PER, an excellent offensive player can usually get a higher PER value than a good defensive player.
The formula below shows the calculation of uPer. Super is a big segment of PER. The value of PER= \( aPER*(15/l{g_{aPER}}). (aPER =(pace adjustment)* uPER) \) [13].
uPer = (1/MP)*
[3P + 2/3 * AST + (2 – factor * (team_AST / team_FG)) * FG
+(FT * 0.5 * (1 + (1 – team_AST / team_FG)) + (2/3) * (team_AST / team_FG))
-(VOP * TOV – VOP * DRB% * (FGA – FG)
-VOP * 0.44 * (0.44 * (0.44 + (0.56 * DRB% )) * (FTA – FT)
+VOP * (1 – DRB%) * (TRB – ORB) + VOP * STL + VOP * DRB% * BLK
-PF * ((lg_FT / lg_PF) – 0.44 * (lg_FTA / lg_PF) *VOP)]
A good player usually has a high PER value (Figure 1). However, overall, PER does not map the player's abilities, especially on the defensive end. In most cases, as a team coach or boss, PER can usually only be used as reference data, but it is not crucial.
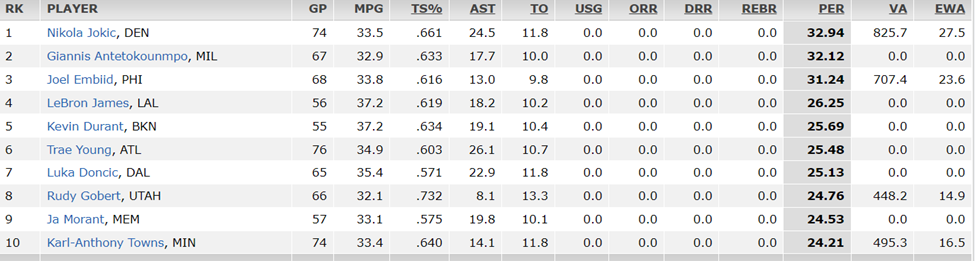
Figure 1: 2021-22 PER rank [13].
2.3. Win Shares (WS)
WS is used to calculate how many victories players contribute to the team. WS can be divided into OWS (Offensive Win Share) and DWS (Defensive Win Share). Its advantage is that it reflects the player's influence on the offensive end, defensive end, and team wins. It is an easy value to understand, but no stats are perfect; it does not mean the high Win Shares player always be the best player on the team.
OWS and DWS formulas could be found below. And \( WS = OWS+DWS \) .
Formula of OWS:
(points produced) – 0.92 * (league points per possession) * (offensive possessions)
0.32 * (league points per game) * ((team pace) / (league pace))
(marginal offence) / (marginal points per win)
Formula of DWS:
(player minutes players / team minutes played) * (team defensive possessions) *
(1.08 * (league points per possession) – ((defensive rating) / 100))
0.32 * (league points per game) * ((team pace) / (league pace))
(marginal defense) / (marginal points per win)
Even if a good player does not have an incredible stat but is making an excellent contribution to his team's wins, his WS value could not be low. For example, as team management, the WS has more reference value than PER. For example, Memphis Grizzles traded Rudy Gay to Toronto Raptors in 2013. At that time, Rudy Gay was considered the best player in Memphis Grizzlies by most fans and media, but few of them noticed that Rudy Gay's WS was only 4.0 in his last season at Memphis Grizzlies [4].
2.4. Actual Shooting Percentage (TS%)
Actual Shooting Percentage refers to the number of points a player gets with each shot, which includes two-pointers, three-pointers, and free throws. The advantage of TS% is that it considers free throws compared to Field Goal Percentage. In the modern NBA, players are better at taking advantage of the rules to create fouls. Hence, free throws become a significant proportion of the total scores of a player. For example, James Harden is considered one of the best scorers in the NBA, and he is also a good player at creating free throws. In the 2016-17 season, James Haden made a total of 881 free throws. [4]
The TS% formula is in figure 5 below. We can see that this formula gives different weights to 2-pointers, 3-pointers, and free throws, which also makes TS% more able to reflect a player's scoring efficiency and ability.
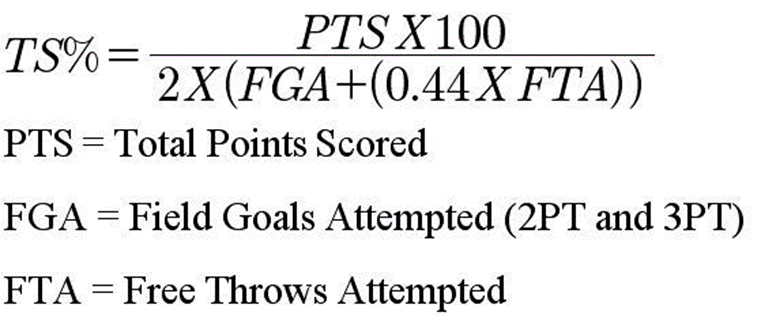
Figure 2: Formula of true shooting percentage.
TS% is simple data. Hence, if a team needs a good scorer, TS% is one of the best values to consider.
2.5. Shot Locations/Shot Charts
This stat can be used to look at a player's shooting percentage in different basketball court areas.
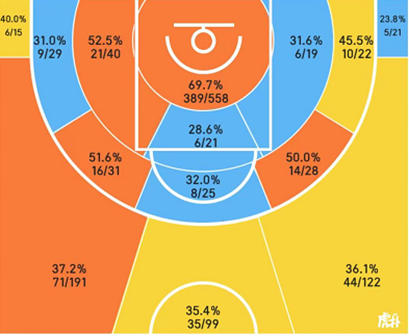
Figure 3: Lebron James Shot chart in 2022-2023.
Even though it is just a simple chart, the shot chart has been used a lot in the tactical design of NBA coaches. For example, in figure 6, the Lebron James shooting percentage on the left side of the court was significantly higher than on the right. Hence, Frank Vogel devised many offensive tactics for Lebron James from the left side in the 2022-23 season.
3. Conclusion
We also believe that big data technologies will significantly aid the NBA in the future. For example, the team could use the data analytics model to predict the ticket strategy. At the same time, more advanced indexes could be invented so that the players' performances could be better measured. Moreover, players can wear special equipment to monitor their physical conditions in training and games. In the future, we expect the team to recognize the risks of potential injuries, as the figure below shows.
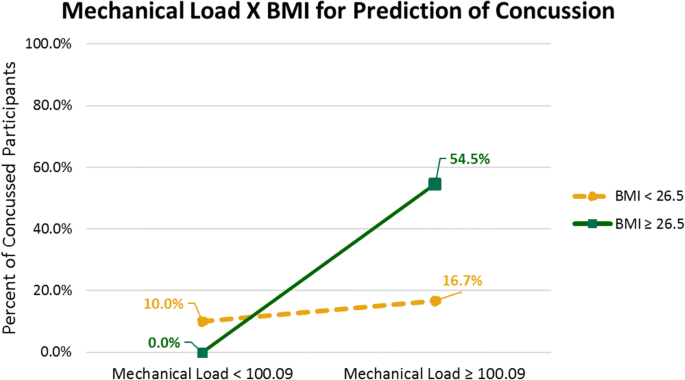
Figure 4 shows the relationship between the prediction of concussion and the mechanical load & BMI. Again, this kind of analysis could help teams recognize potential injuries.
The NBA has been processing data on the field utilizing data analysis technology since the 1980s. The specific NBA data allow players to compare their performance in addition to looking up statistics. The NBA again made big data famous in 2013 using SportVU technology. Big data technology allows for sharing the data with broadcasters and gives coaches a foundation on which to direct, develop, and choose players. In addition, the seemingly meaningless data can be transformed into priceless resources to generate significant marketing value. Thus, data analytics could help those NBA players, teams, and broadcasting companies.
Acknowledgment
Rui Tang, Yuhao Jin, Yuan Gao, and Nanjun Zheng contributed equally to this work and should be considered co-first authors.
References
[1]. Cai, L.; Zhao, C.; Wang, X. "Situation and lessons of application of NBA big data technology," 2021 International Conference on Information Technology and Contemporary Sports (TCS), 2021, pp. 228-231, doi: 10.1109/TCS52929.2021.00054.
[2]. Haefner, J. 9 Stats That Every Serious Basketball Coach Should Track. Retrieved 6 August 2022, from https://www.breakthroughbasketball.com/stats/9_stats_basketball_coach_should_track.html
[3]. SportVU Basketball - Stats Perform. Retrieved 6 August 2022, from https://www.statsperform.com/team-performance/basketball/optical-tracking/
[4]. Hollinger’s NBA Player Stats - ESPN Insider - National Basketball Association - ESPN. ESPN.Com, www.espn.com, http://www.espn.com/nba/hollinger/statistics. Accessed 5 Aug. 2022.
[5]. Nylon Calculus: Reinventing PER. FanSided, fansided.com, 31 Jan. 2017, https://fansided.com/2017/01/31/nylon-calculus-reinventing-per/.
[6]. StatMuse. “Allen Iverson Defensive Rating | StatMuse. StatMuse, www.statmuse.com, https://www.statmuse.com/nba/ask/allen-iverson-defensive-rating. Accessed 5 Aug. 2022.
[7]. Pezzana, C. (2021). The NBA and Data Analytics. Retrieved 6 August 2022, from https://www.linkedin.com/pulse/nba-data-analytics-carlo-pezzana
[8]. Hayhurst, C. (2020). How NBA Data Analytics is Changing the Sport. Retrieved 6 August 2022, from https://www.dell.com/en-us/perspectives/tech-takes-the-court-nba-teams-turn-to-data-and-analytics-for-a-competitive-edge/
[9]. Sports Analytics 101: An Intro to Advanced Stats • Hudl Blog. (2016). Retrieved 6 August 2022, from https://www.hudl.com/blog/sports-analytics-101-an-intro-to-advanced-stats
[10]. Ken, B. (2015). Warriors 'wearable' weapon? Devices to monitor players while on the court. Retrieved 6 August 2022, from https://www.cbssports.com/nba/news/warriors-wearable-weapon-devices-to-monitor-players-while-on-the-court/
[11]. 2021-22 NBA Player Stats: Advanced | Basketball-Reference.Com. Basketball-Reference.Com, www.basketball-reference.com, https://www.basketball-reference.com/leagues/NBA_2022_advanced.html. Accessed 5 Aug. 2022.
Cite this article
Tang,R.;Jin,Y.;Gao,Y.;Zheng,N. (2023). The Positive Impacts of Data Analytics on NBA Teams. Advances in Economics, Management and Political Sciences,11,196-201.
Data availability
The datasets used and/or analyzed during the current study will be available from the authors upon reasonable request.
Disclaimer/Publisher's Note
The statements, opinions and data contained in all publications are solely those of the individual author(s) and contributor(s) and not of EWA Publishing and/or the editor(s). EWA Publishing and/or the editor(s) disclaim responsibility for any injury to people or property resulting from any ideas, methods, instructions or products referred to in the content.
About volume
Volume title: Proceedings of the 2nd International Conference on Business and Policy Studies
© 2024 by the author(s). Licensee EWA Publishing, Oxford, UK. This article is an open access article distributed under the terms and
conditions of the Creative Commons Attribution (CC BY) license. Authors who
publish this series agree to the following terms:
1. Authors retain copyright and grant the series right of first publication with the work simultaneously licensed under a Creative Commons
Attribution License that allows others to share the work with an acknowledgment of the work's authorship and initial publication in this
series.
2. Authors are able to enter into separate, additional contractual arrangements for the non-exclusive distribution of the series's published
version of the work (e.g., post it to an institutional repository or publish it in a book), with an acknowledgment of its initial
publication in this series.
3. Authors are permitted and encouraged to post their work online (e.g., in institutional repositories or on their website) prior to and
during the submission process, as it can lead to productive exchanges, as well as earlier and greater citation of published work (See
Open access policy for details).
References
[1]. Cai, L.; Zhao, C.; Wang, X. "Situation and lessons of application of NBA big data technology," 2021 International Conference on Information Technology and Contemporary Sports (TCS), 2021, pp. 228-231, doi: 10.1109/TCS52929.2021.00054.
[2]. Haefner, J. 9 Stats That Every Serious Basketball Coach Should Track. Retrieved 6 August 2022, from https://www.breakthroughbasketball.com/stats/9_stats_basketball_coach_should_track.html
[3]. SportVU Basketball - Stats Perform. Retrieved 6 August 2022, from https://www.statsperform.com/team-performance/basketball/optical-tracking/
[4]. Hollinger’s NBA Player Stats - ESPN Insider - National Basketball Association - ESPN. ESPN.Com, www.espn.com, http://www.espn.com/nba/hollinger/statistics. Accessed 5 Aug. 2022.
[5]. Nylon Calculus: Reinventing PER. FanSided, fansided.com, 31 Jan. 2017, https://fansided.com/2017/01/31/nylon-calculus-reinventing-per/.
[6]. StatMuse. “Allen Iverson Defensive Rating | StatMuse. StatMuse, www.statmuse.com, https://www.statmuse.com/nba/ask/allen-iverson-defensive-rating. Accessed 5 Aug. 2022.
[7]. Pezzana, C. (2021). The NBA and Data Analytics. Retrieved 6 August 2022, from https://www.linkedin.com/pulse/nba-data-analytics-carlo-pezzana
[8]. Hayhurst, C. (2020). How NBA Data Analytics is Changing the Sport. Retrieved 6 August 2022, from https://www.dell.com/en-us/perspectives/tech-takes-the-court-nba-teams-turn-to-data-and-analytics-for-a-competitive-edge/
[9]. Sports Analytics 101: An Intro to Advanced Stats • Hudl Blog. (2016). Retrieved 6 August 2022, from https://www.hudl.com/blog/sports-analytics-101-an-intro-to-advanced-stats
[10]. Ken, B. (2015). Warriors 'wearable' weapon? Devices to monitor players while on the court. Retrieved 6 August 2022, from https://www.cbssports.com/nba/news/warriors-wearable-weapon-devices-to-monitor-players-while-on-the-court/
[11]. 2021-22 NBA Player Stats: Advanced | Basketball-Reference.Com. Basketball-Reference.Com, www.basketball-reference.com, https://www.basketball-reference.com/leagues/NBA_2022_advanced.html. Accessed 5 Aug. 2022.