


1. Introduction
It took Japan 60 years to develop from a small, trade-closed country to one of the top three economies in the world. The war was the catalyst that turned Japan's economic development around during this period. During World War I, there was significant military demand for foreign goods in Europe, and Japan achieved its first expansion and development of its domestic economic market, driven by this international trade. During the Korean War, Japan relied on export trade from external markets to maintain its pre-war GNP and develop its infrastructure [1]. Investments in infrastructure stimulated Japan's economic market and paved the way for the rapid economic growth that followed.
In 1968, Japan grew to become the second largest economy in the world. However, it was here that the Japanese economy peaked and began to show a downward trend. Due to its dependence on export business, exchange rate fluctuations hit Japan hard, and the GDP growth rate dropped sharply. The Japanese government attempted to mitigate the appreciation of the yen and the decline in the export industry through a monetary policy of lowering interest rates. The consequences of the Japanese bubble economy finally festered in 1991. Japan experienced a major recession that has continued to the present.
In quantitative analysis, using GDP to measure economic growth in Japan, household consumption, gross fixed capital, government spending and exports are all positively correlated with GDP under the expenditure approach. Thus, when investment (transportation, infrastructure) increases, it brings capacity improvements in the quality of goods and services and contributes to the economy's growth. In addition, imports and export are another vital component that affects GDP. Since external markets need to use Japanese exports to improve their domestic living standards, demand in the Japanese export market has been high [1,2]. When goods and services sold abroad are greater than those purchased from foreign producers, GDP increases and a trade surplus is generated. Thus, as a significant exporter, Japan’s export industry positively influenced economic development for a time. In conclusion, this paper analyzes the changes of the Japanese economy after the bubble economy, focusing on the impact of household consumption, investment and export on the economy and speculating on the elements that can stimulate economic development.
2. Literature Review
The critical factors influencing Japan's GDP are consumption, investment, and the export industry. In 2006, Horioka [2] analyzed the growth rate and found that household consumption continues to drive the Japanese economy and considerably influences its economic development. In the same year, Zou suggested through the GMM model that the trend of private investment is roughly synchronized with GDP [3]. Hirata and Otsu 2016, analyzing the trade correlation between Japan and the Asian tigers after detrending, found that the import and export trade has influenced the Japanese economy since 1996[4].
Since the Japanese economic bubble burst in 1990, Japan has entered a period of economic depression. Before the crisis, Zou analyzed that private investment grew faster than GDP using the GMM model. However, after the bubble burst, excess fixed equipment, employment problems, and liabilities affected the growth of investment. Investment began to grow negatively, falling 58% in a decade, slowing the Japanese economy. Before Japan's "disappearing decade", household consumption contributed the most and had the third most prominent impact on GDP, with an average annual growth rate of 1.56%, or 1.14% of GDP, giving a slight boost to the economy. However, when faced with unforeseen financial crisis situations, Japanese people generally choose to diversify their savings and reduce their consumption to gain security [2,2]. Therefore, Japan needs to address or prevent the pessimistic attitude toward future economic security to dissuade people from saving and thus promote consumption.
In terms of exports, Artis and Okubo demonstrate through a gravity model that declining transportation costs and weakening geography have affected the synchronization of business cycles [5]. Therefore, Hirata & Otsu, in their analysis of the economic correlation between Japan and other Asian markets, eliminate the uncontrollability of potential wedges through the Hodrick-Prescott filter to make the conclusions more generalizable [2-3]. In growth rate analysis, they found that the four Asian tigers grew faster than the trend while Japan gradually slowed down. The two economic developments are in opposite states and are not correlated. After filtering by HP Filter, the cross-country business cycle correlation changed from negative to positive in 1996. The economic development of both countries gradually influenced each other, and the international net export trade also began to influence the Japanese economy.
Following the above literature, this article will examine the relationship between GDP and consumption, investment and exports from 1996 to 2021. The article will use the HP Filter to derive the trendiness of the annual data and use the cyclical component of variables to analyze the data fluctuations after the detrending.
3. Methodology & Data
This article uses the expenditure method to calculate the GDP of Japan. GDP is the domestic growth product, the total amount of money the country receives for final goods and services.
\( y=C+I+G+(EX-IM) \) (1)
\( y:GDP C:Consumption I:Investment \)
\( G:Government EX:Export IM:Import \)
GDP comprises consumption, investment, government spending and net exports (exports- imports). These generated figures are flexible values that can change annually depending on production. The data are taken from constant values provided by International Financial Statistics (IFS) based on the 2015 Japanese Yen to allow for comparability across years and reduce errors due to inflation. In addition, this paper uses a detrending approach to determine the cyclicality of the data set and to find their effects after removing the trends.
\( Cyclical component=(\ \ \ of Variable-\ \ \ of Variable Trend)÷\ \ \ of Variable \) (2)
A cyclical component is a regular or periodical fluctuation around a trend. The Hodrick-Prescott filtering technique is used here to estimate the trend lines of the variables. The trend represents a general direction of the development of the variable, excluding any fluctuations or outliers. The HP Filter separates trends from short-term business cycles (Hodrick and Prescott, 1997). For variables with frequently fluctuating data, the HP Filter trend line will be a smooth and closer arc to the original data development than a linear trend line. The study variables are GDP, consumption, investment and export.
3.1. Gross Domestic Product
Since the bubble crisis in 1991, the Japanese economy has been in a continuous downturn. As the Figure 1 shows, GDP has been flat for more than 20 years, accompanied by some minor fluctuations, and shown an overall mild upward trend. These short-term downturns may have been influenced by natural disasters, financial crises, and epidemics.
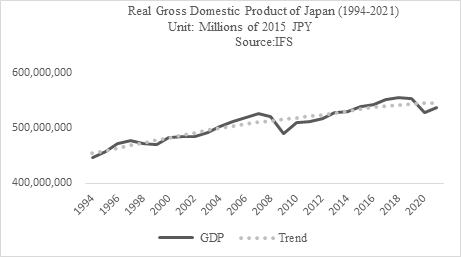
Figure 1: GDP and trend, Japan.
3.2. Consumption
As shown in Figure 2, the consumption line generally follows its trend line, with similar fluctuations and declines to GDP, showing overall steady slow growth. From 1994 to 2021, consumption grew by less than 50 trillion of 2015 JPY. This trend also shows that Japanese people tend to be conservative in their fiscal allocation and less enthusiastic about consumption after the economic crisis [2-4]. Society enters a low-desire period.
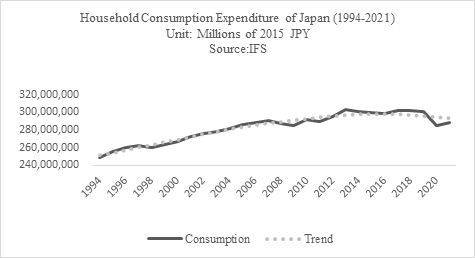
Figure 2: Consumption and trend, Japan.
3.3. Investment
Unlike GDP and consumption, the investment line shows a fluctuating downward trend over these 27 years. According to Figure 3, investment has decreased by nearly $1 billion, from about 140 trillion in 1994 to about 30 trillion in 2021. In addition, affected by the financial crisis that emerged in 2007, the amount of investment showed a significant downward trend from 2008 till 2011, when it slowly began to rebound to an upward trend.
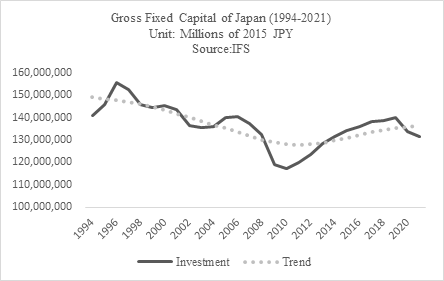
Figure 3: Investment and trend, Japan.
3.4. Export
Among these four variables, the value of exports demonstrates the most positive and significant development. Although the source data from Figure 4 frequently fluctuate above and below the trend line, the general change shows an upward trend. In 1994, nearly 30 trillion of the trade revenue came from exports of goods and services, while in 2021, exports almost tripled to 102 trillion. Due to the lack of turnover to sunk costs required for exports, in 2009 and 2020, the financial crisis and epidemics caused a significant decrease in the value of exports [6]. These figures recovered rapidly in the years following the crisis (2010 and 2021), and the total trade value returned to its pre-crisis level.
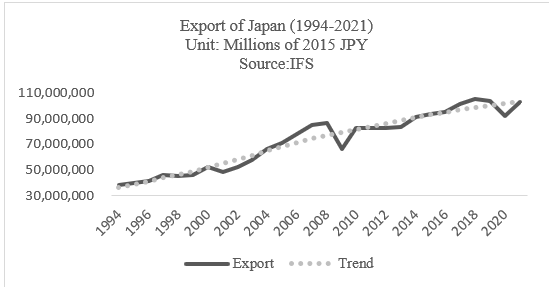
Figure 4: Export and trend, Japan.
4. Result & Discussion
In the Japanese economy, consumption, investment and exports are essential elements that contribute to the development of GDP. In Table 1, by analyzing the ratio of each variable to GDP from 1994 to 2021, household consumption is found as an essential component in constructing GDP. On an annual average, 56% of GDP is contributed by consumption, occupying the largest share of GDP for 27 consecutive years. In terms of investment, it accounts for an average of 27% of GDP per year. Segmentation between investment and GDP shows that the impact of investment on the economy has been decreasing yearly since 1994. The volume of exports is the smallest in GDP, averaging 14% per year. However, the impact of exports on GDP is increasing yearly, from 8.58% in 1994 alone to a 10.53% increase in 2021.
Table 1: Consumption, Investment, Export share of GDP from 1994 to 2021 (Data by author).
Year | Consumption share of GDP | Investment share of GDP | Export share of GDP |
1994 | 55.86% | 31.60% | 8.58% |
1995 | 55.76% | 31.78% | 8.71% |
1996 | 55.13% | 32.91% | 8.85% |
1997 | 54.90% | 31.96% | 9.74% |
1998 | 55.24% | 30.99% | 9.63% |
1999 | 56.02% | 30.76% | 9.85% |
2000 | 55.35% | 30.12% | 10.83% |
2001 | 56.27% | 29.60% | 10.08% |
2002 | 56.97% | 28.15% | 10.87% |
2003 | 56.47% | 27.55% | 11.73% |
2004 | 55.99% | 27.04% | 13.13% |
2005 | 55.84% | 27.35% | 13.82% |
2006 | 55.59% | 27.09% | 15.04% |
2007 | 55.19% | 26.12% | 16.11% |
2008 | 55.24% | 25.43% | 16.57% |
2009 | 58.04% | 24.26% | 13.46% |
2010 | 57.06% | 23.00% | 16.14% |
2011 | 56.75% | 23.51% | 16.12% |
2012 | 57.11% | 23.83% | 15.92% |
2013 | 57.45% | 24.33% | 15.74% |
2014 | 56.76% | 24.79% | 17.16% |
2015 | 55.77% | 24.97% | 17.44% |
2016 | 55.11% | 25.07% | 17.58% |
2017 | 54.77% | 25.05% | 18.44% |
2018 | 54.58% | 25.00% | 19.02% |
2019 | 54.42% | 25.31% | 18.79% |
2020 | 54.01% | 25.29% | 17.38% |
2021 | 53.82% | 24.50% | 19.11% |
Average share of GDP | 55.77% | 27.05% | 14.14% |
In addition, to further understand GDP and variables, application of cyclical component data was used to discover the distribution of their data changes and the post-depression trends between variables and GDP. Applying cyclical standard deviation is one way to measure the distribution of a data set relative to the mean. A standard deviation close to a value of zero means that the data is concentrated around the mean, while a larger value of standard deviation indicates that the data is more different from the mean and the distribution of the curve is more spread out.
According to Table 2:
GDP Cyclical SD is 0.0185. The data variation of GDP in this period is slight compared to the mean. The data distribution curve can be very narrow.
Consumption Cyclical SD is 0.0129. The data are concentrated around the mean. This concentrated distribution also represents little change in spending on consumption over the thirty years.
Investment Cyclical SD is 0.0383. Compared to GDP and Consumption, the data distribution for investment is a bit more spread out, but the distribution is still compressed.
Export Cyclical SD is 0.0696. Compared with the former three variables, the data set of export will be more dispersed, representing the unstable annual export output and the high variability of the data.
As the cyclical standard deviation of each factor is specified, the magnitude of fluctuations of GDP with its variables can be quantified.
4.1. Consumption
According to Figure 5, the change in consumption is similar to the change in GDP. Except in 2002 and 2015, when the trends were opposite, overall consumption fluctuated 0.7 times more than GDP.
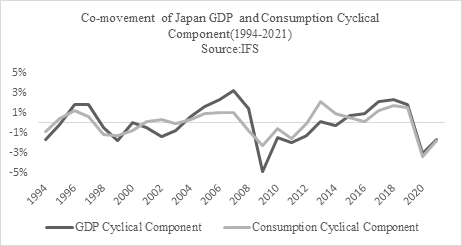
Figure 5: Co-movement of GDP and consumption cyclical component, Japan.
4.2. Investment
In the cyclical fluctuations of GDP and investment in Figure 6, the average variation of investment is 2.1 times greater than that of GDP. In 2006, both experienced a slight increase, with GDP increasing by 2.31% over expectations and investment being 5.35% higher than forecast, which is about 2.3 times higher than GDP.
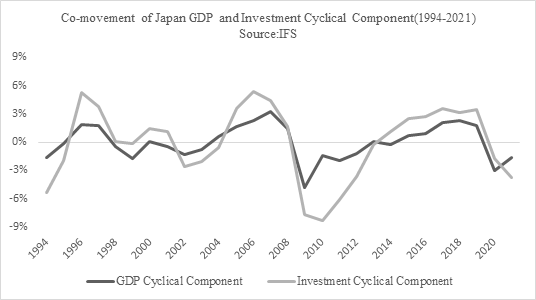
Figure 6: Co-movement of GDP and investment cyclical component, Japan.
4.3. Exports
According to Figure 7, the export change is not similar to the change in GDP, where exports fluctuate 3.8 times more than GDP. For example, the growth of both GDP and exports from 2008 to 2009 was below the trend value due to the global economic and financial crisis. The cyclical value of Japanese GDP fell from 1. 43% to -4.80% (a difference of 6.23%), while investment fell from 11.98% to -16.74% (a difference of 28.72%).
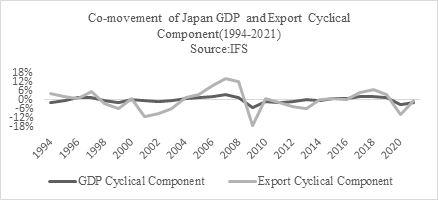
Figure 7: Co-movement of GDP and export cyclical component, Japan.
Furthermore, by analyzing data on cyclical components of the variables can be used to interpret the correlation between GDP and consumption, GDP and investment, and GDP and exports. A correlation value close to 0 implies no correlation between the variables. A value near -1 implies a strong inverse relationship between A and B (i.e., if A increases, then B decreases). A value near 1 means that A and B have a strong positive correlation and change together. From Table 2, of the three pairs, GDP has the strongest correlation with investment at 0.87, close to 1. Thus, if an investment is trending up, then GDP will also rise. In contrast, the correlation between GDP and consumption is slightly weaker at 0.79. However, they also show a strong positive relationship. Changes in consumption have a homogeneous effect on changes in GDP.
Table 2: Cyclical standard deviation, Fluctuation and Correlation.
GDP Cyclical SD | 0.0185 |
Consumption Cyclical SD | 0.0129 |
Investment Cyclical SD | 0.0383 |
Export Cyclical SD | 0.0696 |
Consumption SD/ GDP SD | 0.70 |
Investment SD/ GDP SD | 2.07 |
Export SD/ GDP SD | 3.76 |
Corr. between GDP and Consumption | 0.79 |
Corr. between GDP and Investment | 0.87 |
Corr. between GDP and Export | 0.80 |
According to the analysis, Japan can increase GDP by stimulating exports in the short run and focusing on consumption in the long run. In the short run, stimulating exports can present an immediate increase in GDP due to the high volatility of exports in GDP. The government can increase credit availability to exporters and simplify export regulations [7]. In the long run, since consumption is more stable with GDP. Stimulating it will ensure that GDP will also rise steadily. The government can cut taxes and income taxes, thus stimulating people's demand and boosting consumption.
5. Conclusion
To summarize, from 1994 to 2021, the Japanese economy enters a slow upward phase. Consumption, investment and exports are the main variables affecting GDP. Among them, the share of consumption in GDP is the most stable. The government should introduce relevant benefits to encourage citizens to consume and lay the foundation for long-term benign economic development. The volume of exports is volatile, but the share of GDP is increasing year by year, bringing the possibility of new growth to the economy.
References
[1]. Okita, S. (1951). Japan’s Economy and the Korean War. Far Eastern Survey, no. 14: 141–44.
[2]. Horioka, C. Y. (2006). The causes of Japan's 'Lost Decade': The role of household consumption. Japan and the World Economy, Volume18 Issue4: 378-400.
[3]. Zou, Y. (2006). Empirical studies on the relationship between public and private investment and GDP growth. Journal of Applied Economics, 38: 1259-1270.
[4]. Hirata, H., & Otsu, K. (2016). Accounting for the economic relationship between Japan and the Asian tigers. Journal of the Japanese and International Economies, Volume 41: 57-68.
[5]. Artis, M., & Okubo, T. (2011). The intranational business cycle in Japan. Oxford Economic Papers, Volume 63 Issue 1: 111- 133.
[6]. Kiendrebeogo, Y., & Véganzonès-Varoudakis, M.-A. (2018). How do financial crises impact exports? https://blogs.worldbank.org/trade/how-do-financial-crises-impact-exports.
[7]. Belloc, M., & Maio, M. D. (2013). Successful strategies to help developing countries boost exports. https://www.theigc.org/blog/successful-strategies-to-help-developing-countries-boost-exports/.
Cite this article
Guo,J. (2023). Elements Affect Japan GDP Growth. Advances in Economics, Management and Political Sciences,12,117-125.
Data availability
The datasets used and/or analyzed during the current study will be available from the authors upon reasonable request.
Disclaimer/Publisher's Note
The statements, opinions and data contained in all publications are solely those of the individual author(s) and contributor(s) and not of EWA Publishing and/or the editor(s). EWA Publishing and/or the editor(s) disclaim responsibility for any injury to people or property resulting from any ideas, methods, instructions or products referred to in the content.
About volume
Volume title: Proceedings of the 2nd International Conference on Business and Policy Studies
© 2024 by the author(s). Licensee EWA Publishing, Oxford, UK. This article is an open access article distributed under the terms and
conditions of the Creative Commons Attribution (CC BY) license. Authors who
publish this series agree to the following terms:
1. Authors retain copyright and grant the series right of first publication with the work simultaneously licensed under a Creative Commons
Attribution License that allows others to share the work with an acknowledgment of the work's authorship and initial publication in this
series.
2. Authors are able to enter into separate, additional contractual arrangements for the non-exclusive distribution of the series's published
version of the work (e.g., post it to an institutional repository or publish it in a book), with an acknowledgment of its initial
publication in this series.
3. Authors are permitted and encouraged to post their work online (e.g., in institutional repositories or on their website) prior to and
during the submission process, as it can lead to productive exchanges, as well as earlier and greater citation of published work (See
Open access policy for details).
References
[1]. Okita, S. (1951). Japan’s Economy and the Korean War. Far Eastern Survey, no. 14: 141–44.
[2]. Horioka, C. Y. (2006). The causes of Japan's 'Lost Decade': The role of household consumption. Japan and the World Economy, Volume18 Issue4: 378-400.
[3]. Zou, Y. (2006). Empirical studies on the relationship between public and private investment and GDP growth. Journal of Applied Economics, 38: 1259-1270.
[4]. Hirata, H., & Otsu, K. (2016). Accounting for the economic relationship between Japan and the Asian tigers. Journal of the Japanese and International Economies, Volume 41: 57-68.
[5]. Artis, M., & Okubo, T. (2011). The intranational business cycle in Japan. Oxford Economic Papers, Volume 63 Issue 1: 111- 133.
[6]. Kiendrebeogo, Y., & Véganzonès-Varoudakis, M.-A. (2018). How do financial crises impact exports? https://blogs.worldbank.org/trade/how-do-financial-crises-impact-exports.
[7]. Belloc, M., & Maio, M. D. (2013). Successful strategies to help developing countries boost exports. https://www.theigc.org/blog/successful-strategies-to-help-developing-countries-boost-exports/.