


1 Introduction
1.1 Research Background and Significance
As the covid-19 stroke, people were imposed to follow the epidemic prevention policies, including social isolation. Under the restrictions toward social interaction, depressed people dispel melancholy by drinks [1]. Serving as examples of people drinking more alcohol, there were reports stating that Australian and Canadian liquor sales have apparent increments during the epidemic [2, 3]. Moreover, with the lessons drawn from cases associated with alcoholic abuse and alcoholic-related harms back in Beijing’s 2003 SARS outbreak, public concern has arisen regarding the increasing alcohol consumption after the Covid-19 pandemic [4]. Therefore, there is an urgent need for studying the pattern of liquor sales up to now and forecasting for the near future.
On the other hand, MOUTAI is a strong competitor in liquor sales industry. Its brand reputation draws people’s attention to a great extent, especially investors and entrepreneurs in the industry. Therefore, the pattern of MOUTAI’s stock price is of great concern. Moreover, MOUTAI, an outstanding illustration of Chinese traditional liquor flavor, takes advantage of its unique production environment and technique. The brand gains popularity and prosperity throughout China and worldwide [5]. Hence, the MOUTAI stock could give an effective overview of the liquor sales overall. For the method used in this study, ARIMA model is one of the most effective prediction models up to now. Its utilization in time series analysis fully shows it capacity in fitting existing data and forecasting.
1.2 Literature Review
ARIMA model forecasting has been compared to simple exponential smoothing model and Holt two-parameter exponential smoothing model in the study of property crime for one district, and the conclusion is that the forecast error is the smallest for ARIMA model, which demonstrate the preciseness and effectiveness of the specific model among other models [6]. ARIMA model also has distinct advantage in forecasting for time series that has a clear seasonal pattern [7]. In a paper studying the oil palm price using three different ARIMA models, the main indicator of accuracy the study uses is MAPE [8].
However, ARIMA models are meant to extract and model the correlations before and after a sequence. Therefore, if there is no linear correlation between the forecast errors throughout, which refers to white noise, the best ARIMA model is identified. As a result, conventional error diagnostic cannot function the best for ARIMA models, instead AIC or BIC. In this paper, further research is carried out by fitting various ARIMA models to the series and examining AIC values for determination of the best-fitting ARIMA model.
1.3 Research Contents and Framework
This paper uses ARIMA model to fit the closing price time-series of MOUTAI’s stock and do forecasting over the future horizon. After adjustments of the raw data are carried out, various ARIMA models are fitted to the data, and their AIC values are examined to find the best-fitting model. The model with the smallest AIC value is expressed, and the forecasts from the specific model are presented and analyzed. After the results are demonstrated, the possible factors of the main patterns found in the data and the forecasting results are evaluated. Advises are given towards the consumers and investors of MOUTAI products and stock.
The framework of this paper includes four sections: First, Data transformations: in this section, one first differencing and a log transformation are carried out toward the raw data, the closing price of MOUTAI’s stock, in order to make the series stationary. Second, an introduction of ARIMA model and forecasting: the common composition of ARIMA models is illustrated; moreover, the important steps in ARIMA modelling are introduced. Third, result analysis: the process finding the best-fitting ARIMA model is shown, and the forecasts from the specific model are analyzed. Final is discussion and conclusion: discussion regarding causation of the patterns of the data and the forecasting results is carried out.
2 Method
2.1 Data Collection and Data Adjustment
The raw data, closing price of Moutai stock, is adopted from the website https://cn.investing.com, collected daily. The currency in which the data is collected is CNY (https://cn.investing.com/). The data used to construct the model and forecast over the future horizon start from March 21st, 2012 and end with September 1st, 2022. The figure 1 shown below presents the raw data in the selected interval. The closing price of MOUTAI stock is of uniform variance, has an overall increasing trend, and has a peak around the beginning of 2021. There is no apparent seasonal pattern nor cyclic pattern shown in the plot of the data.
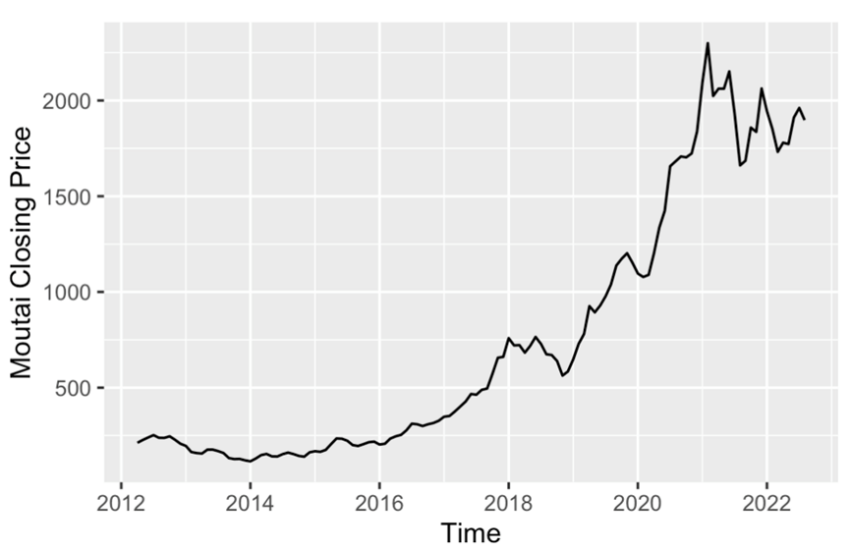
Fig. 1 the closing price of MOUTAI stock
Since the raw data is not stationary, one first differencing and then a log transformation of the differenced data are applied. The result from a Box-Ljung test is shown in Table 1. According to the very small p-value, the data is likely to be stationary.
Table 1. Box-Ljung test
X-squared | df | p-value |
14.364 | 4 | 0.006219 |
Moreover, Figure 2 shown below presents the adjusted data, which also shows that the transformed data is of uniform variance and thus stationary.
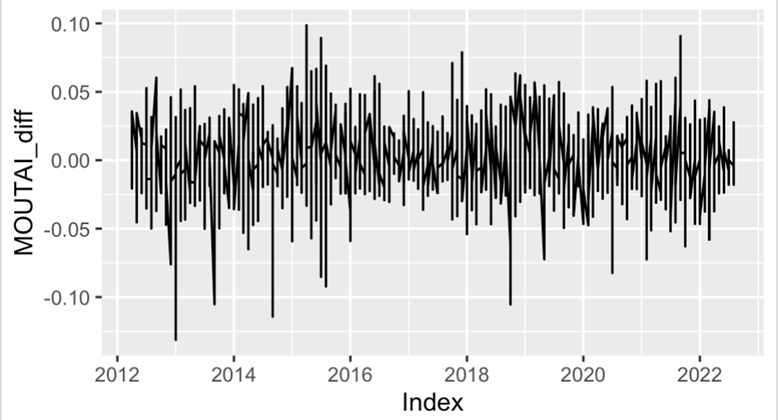
Fig. 2 The data after one first differencing and a log transformation
2.2 ARIMA
ARIMA model is the combination of AR model (Autoregressive model) and MA model (Moving average model). The expression of AR model can be written as:
\( {y_{t}}=c+{∅_{1}}{y_{t-1}}+{∅_{2}}{y_{t-2}}+⋯{∅_{p}}{y_{t-p}}+{ε_{t}} \) (1)
which means that the observations have correlations to p of its lags, the past values of the variable [9].
MA models can be expressed in the form of:
\( {y_{t}}=c+{ε_{t}}+{θ_{1}}{ε_{t-1}}+{θ_{2}}{ε_{t-2}}+⋯{θ_{q}}{ε_{t-q}} \) (2)
In which the observation is the weighted moving-average of the errors of its past q observations [9,10]. The error εt in both models is normally distributed white noise with mean zero and variance one.
As the combination of the two models, ARIMA model would be described by three main parameters, written in the form of (p,d,q), where p is the parameter describing the AR part, d is the degree of first differencing involved, and q is the parameter for MA model.
In utilization of ARIMA model in time series analysis, the main procedure is as follows: First, the series should be stationary, and so proper times of first differencing should be applied if it is not stationary; the series should also receive seasonal differencing adjustment if there is a seasonal pattern in the data. Second, Adjusting the p and q values of ARIMA model until getting the smallest possible AIC value. Third, the model could be identified as the best-fitting model if the residuals are like white noise. ACF plot and portmanteau test of the residuals could be carried out to examine whether the residuals of the data is white noise. If it is white noise, more than 95% the autocorrelations of the residuals should be within the bounds in ACF plots, representing the critical values which are equal to \( ±\frac{1.96}{\sqrt[]{T}} \) in value.
3 Results
3.1 ARIMA Model Estimation
Adjustment of p and q values is applied to get the most fitting ARIMA model to the series. The various ARIMA models are shown in Table 2.
Table 2. Various ARIMA models
ARIMA (p,d,q) model | Zero/Non-zero mean | AIC value |
ARIMA (2,0,2)(1,0,1) | Non-zero mean | -296.8581 |
ARIMA (0,0,0) | Non-zero mean | -292.0827 |
ARIMA (1,0,0)(1,0,0) | Non-zero mean | -303.3601 |
ARIMA (0,0,1)(0,0,1) | Non-zero mean | -303.1353 |
ARIMA (0,0,0) | Zero mean | -287.1364 |
ARIMA (1,0,0) | Non-zero mean | -303.8288 |
ARIMA (1,0,0)(0,0,1) | Non-zero mean | -303.1218 |
ARIMA (1,0,0)(1,0,1) | Non-zero mean | -301.6319 |
ARIMA (2,0,0) | Non-zero mean | -302.9755 |
ARIMA (1,0,1) | Non-zero mean | -302.5422 |
ARIMA (0,0,1) | Non-zero mean | -304.1864 |
ARIMA (0,0,1)(1,0,0) | Non-zero mean | -303.2979 |
ARIMA (0,0,1)(1,0,1) | Non-zero mean | -301.4519 |
ARIMA (0,0,2) | Non-zero mean | -302.8966 |
ARIMA (1,0,2) | Non-zero mean | -301.2693 |
ARIMA (0,0,1) | Zero mean | -301.8089 |
According to Table 1, the best model is ARIMA (0,0,1) with zero mean since it has the smallest AIC value. The model ARIMA (0,0,1) with zero mean can be expressed as a MA (1) model as follows:
\( {y_{t}}=c + {ε_{t}}+0.3248{ε_{t-1}} \) (3)
which demonstrates that the transformed data is strongly correlated with the error of its last observation.
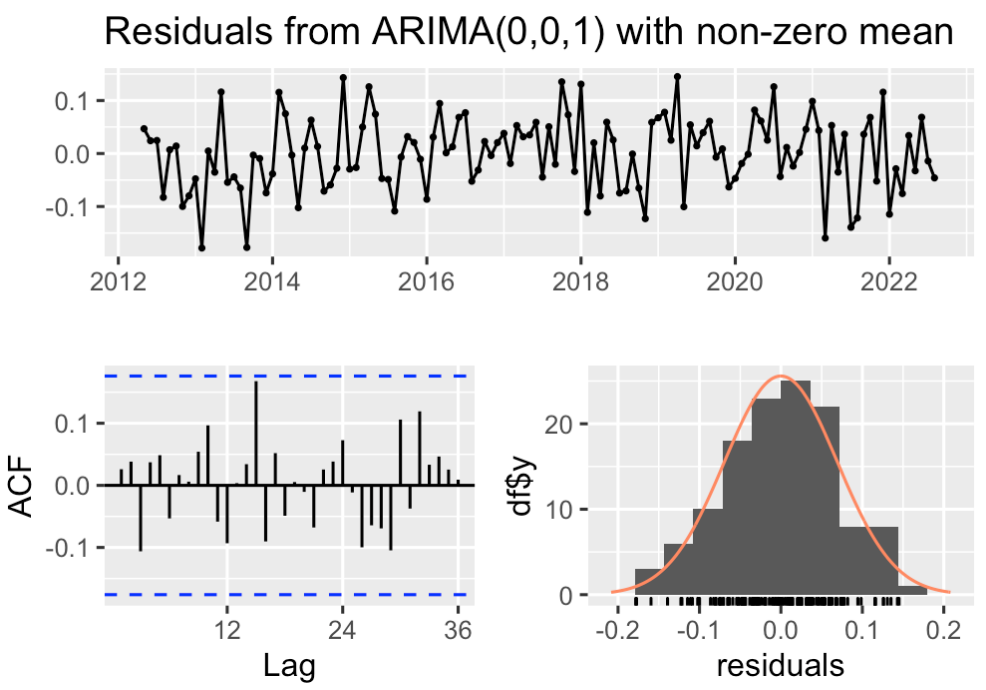
Fig.3. The residuals tests
According to the Figure 3, because more than 95% of the autocorrelations are within the thresholds shown by the blue lines in the ACF plot, and the residuals are of normal distribution, the residuals are identified as white noise.
On the other hand, based on the relatively large p-value shown in Table 3, the results from a portmanteau test for the residuals, the residuals also can be classified as white noise.
Table 3. Ljung-Box test
Q* | df | p-value |
14.012 | 23 | 0.9265 |
3.2 Forecasting
The forecasting is carried out by the forecast function in R, as shown in the Figure 6. This essence of the model that each observation is strongly correlated to the error of its last observation leads to the apparent patterns in the forecasts: the forecasting results are the same after the first forecast value. Even though, the prevailing pattern in previous observations should not be dismissed.
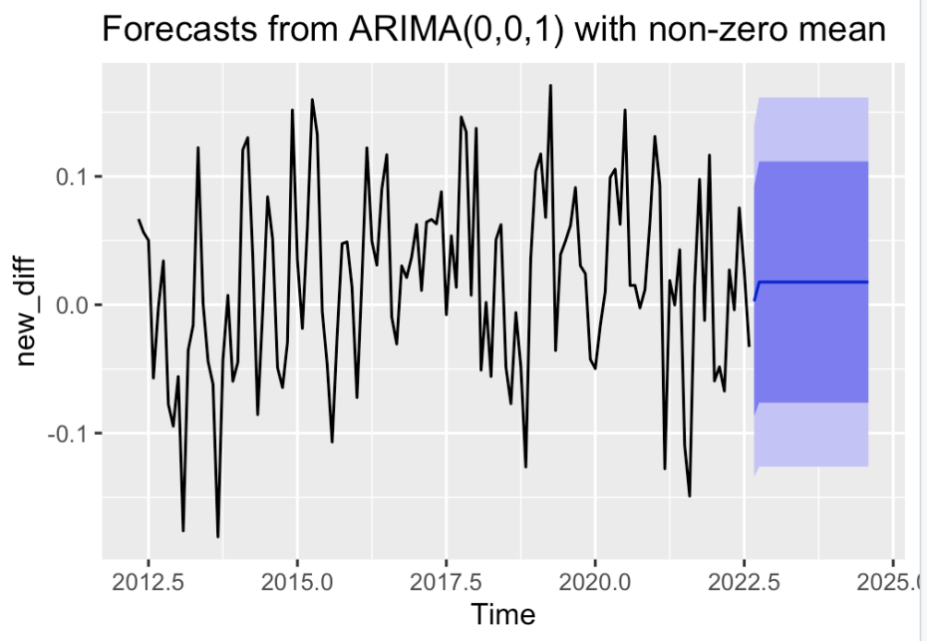
Fig. 4. Forecasting from ARIMA (0,0,1) model
The prediction intervals are shown in Table 4.
Table 4. The point forecasts from ARIMA (0,0,1) model
Low 80% | Low 95% | Upper 80% | Upper 95% | |
Sep 2022 | -0.08665727 | -0.1339776 | 0.09212307 | 0.1394434 |
Oct 2022 | -0.07631967 | -0.1260740 | 0.11165653 | 0.1614108 |
Nov 2022 | -0.07631967 | -0.1260740 | 0.11165653 | 0.1614108 |
Dec 2022 Jan 2022 | -0.07631967 -0.07631967 | -0.1260740 -0.1260740 | 0.11165653 0.11165653 | 0.1614108 0.1614108 |
Feb 2023 | -0.07631967 | -0.1260740 | 0.11165653 | 0.1614108 |
Mar 2023 | -0.07631967 | -0.1260740 | 0.11165653 | 0.1614108 |
Apr 2023 | -0.07631967 | -0.1260740 | 0.11165653 | 0.1614108 |
May 2023 | -0.07631967 | -0.1260740 | 0.11165653 | 0.1614108 |
Jun 2023 | -0.07631967 | -0.1260740 | 0.11165653 | 0.1614108 |
Jul 2023 | -0.07631967 | -0.1260740 | 0.11165653 | 0.1614108 |
Aug 2023 Sep 2023 | -0.07631967 -0.07631967 | -0.1260740 -0.1260740 | 0.11165653 0.11165653 | 0.1614108 0.1614108 |
Oct 2023 | -0.07631967 | -0.1260740 | 0.11165653 | 0.1614108 |
Nov 2023 | -0.07631967 | -0.1260740 | 0.11165653 | 0.1614108 |
Dec 2023 | -0.07631967 | -0.1260740 | 0.11165653 | 0.1614108 |
Jan 2024 | -0.07631967 | -0.1260740 | 0.11165653 | 0.1614108 |
Feb 2024 | -0.07631967 | -0.1260740 | 0.11165653 | 0.1614108 |
Mar 2024 | -0.07631967 | -0.1260740 | 0.11165653 | 0.1614108 |
Apr 2024 | -0.07631967 | -0.1260740 | 0.11165653 | 0.1614108 |
May 2024 | -0.07631967 | -0.1260740 | 0.11165653 | 0.1614108 |
Jun 2024 | -0.07631967 | -0.1260740 | 0.11165653 | 0.1614108 |
Jul 2024 | -0.07631967 | -0.1260740 | 0.11165653 | 0.1614108 |
Aug 2024 | -0.07631967 | -0.1260740 | 0.11165653 | 0.1614108 |
4 Discussion
From the ARIMA modeling and forecasting, MOUTAI’s stock price is being predicted over the future 24 months horizon. The variance of the forecasts is within the range bounded by previous observations, referring to the not much fluctuations over the MOUTAI stock price. Moreover, the closing price remains an increasing trend regarding the interval in this study, and reached a peak near the start of 2021.
What might be suggested to the investors of MOUTAI stock would be that the value of this stock has an continued increasing trend since at least 2012 and will reach new heights after the strike of covid-19. The possible cause of this might be the fact that people were forced to be at home due to the lock downs, and thus were emotionally annoyed, a situation which could be pacified by having alcoholic treats to them. Therefore, MOUTAI stock is reflecting an ongoing increment in sales.
5 Conclusion
This study uses ARIMA model regarding time series analysis to forecast for MOUTAI’s stock price. First, the series is adjusted to stationary by first diffencing and log transformation. And then, various ARIMA model are fitted to the data while the smallest AIC value is desired. After the determination of the fact that the best fitting model in this case would be ARIMA (0,0,1) model with zero mean, forecast is carried out and the prediction intervals are shown.
The forecasting gives an overview of the continued pattern shown in the previous observation, which is an increasing trend in the stock price and an unusual peak due to the strike of covid-19. The possible cause for the prevailing patterns of the data is discussed: people’s desire for drinking because of depression due to lock downs and the overall epidemic situation.
The shortages for this study are stated below. Firstly, more previous observations could be taking into account. The model is more likely to fit better to the data, and thus it might have better performance in forecasting future observations. Secondly, the forecasts could be addressed more sophisticated. Due to the unpredictability of some unusual events, in this case the epidemic, the stock price fluctuates dramatically in a relatively short amount of time. Hence, more variables regarding this issue could be considered to avoid the effect of unusual events. In the future, since it would always be a compelling subject either for the investors and the public, more studies could be carried out concerning the liquor sales and its stock prices. People would consume this kind of products in daily lives in increasing amounts whenever depressions strike or there are things worth celebrating. Therefore, the subject would never fall out of style and even be heatedly regarded.
Even though, people should also be cautious about excessive alcoholic consumption due to the negative effects it may have on physical and mental health. The government should also help alleviate the situation by further restraining the pandemic. Accordingly, people could access to the essential social interactions with other people and thus better maintain their health condition.
References
[1]. Calina, Daniela, et al. "COVID-19 pandemic and alcohol consumption: Impacts and interconnections." Toxicology reports 8: 529-535. (2021)
[2]. Colbert, Stephanie, et al. "COVID‐19 and alcohol in Australia: industry changes and public health impacts." Drug and alcohol review (2020).
[3]. Stockwell, Tim, et al. "Alcohol sales in Canadian liquor outlets as a predictor of subsequent COVID-19 infection rates: a time-series analysis." Addiction (2022).
[4]. Ramalho, Rodrigo. "Alcohol consumption and alcohol-related problems during the COVID-19 pandemic: a narrative review." Australasian Psychiatry 28.5: 524-526. (2020)
[5]. Xu, Y., and K. Ji. "Moutai (Maotai): production and sensory properties." Alcoholic Beverages: 315-330. (2012)
[6]. P. Chen, H. Yuan and X. Shu, "Forecasting Crime Using the ARIMA Model," 2008 Fifth International Conference on Fuzzy Systems and Knowledge Discovery, 627-630, (2008).
[7]. Fattah, Jamal, et al. "Forecasting of demand using ARIMA model." International Journal of Engineering Business Management 10: 1847979018808673 (2018).
[8]. Nochai, Rangsan, and Titida Nochai. "ARIMA model for forecasting oil palm price." Proceedings of the 2nd IMT-GT Regional Conference on Mathematics, Statistics and applications (2006).
[9]. Hyndman, Rob J., and George Athanasopoulos. "Autoregressive models." de Forecasting: Principles and Practice, otexts (2018).
[10]. Eom, K. B. . "Analysis of Acoustic Signatures from Moving Vehicles Using Time-Varying Autoregressive Models." Multidimensional Systems and Signal Processing 10(4), 357-378(1999).
Cite this article
Duan,S. (2023). MOUTAI Stock Price Prediction Based on ARIMA Model. Advances in Economics, Management and Political Sciences,14,34-41.
Data availability
The datasets used and/or analyzed during the current study will be available from the authors upon reasonable request.
Disclaimer/Publisher's Note
The statements, opinions and data contained in all publications are solely those of the individual author(s) and contributor(s) and not of EWA Publishing and/or the editor(s). EWA Publishing and/or the editor(s) disclaim responsibility for any injury to people or property resulting from any ideas, methods, instructions or products referred to in the content.
About volume
Volume title: Proceedings of the 2nd International Conference on Business and Policy Studies
© 2024 by the author(s). Licensee EWA Publishing, Oxford, UK. This article is an open access article distributed under the terms and
conditions of the Creative Commons Attribution (CC BY) license. Authors who
publish this series agree to the following terms:
1. Authors retain copyright and grant the series right of first publication with the work simultaneously licensed under a Creative Commons
Attribution License that allows others to share the work with an acknowledgment of the work's authorship and initial publication in this
series.
2. Authors are able to enter into separate, additional contractual arrangements for the non-exclusive distribution of the series's published
version of the work (e.g., post it to an institutional repository or publish it in a book), with an acknowledgment of its initial
publication in this series.
3. Authors are permitted and encouraged to post their work online (e.g., in institutional repositories or on their website) prior to and
during the submission process, as it can lead to productive exchanges, as well as earlier and greater citation of published work (See
Open access policy for details).
References
[1]. Calina, Daniela, et al. "COVID-19 pandemic and alcohol consumption: Impacts and interconnections." Toxicology reports 8: 529-535. (2021)
[2]. Colbert, Stephanie, et al. "COVID‐19 and alcohol in Australia: industry changes and public health impacts." Drug and alcohol review (2020).
[3]. Stockwell, Tim, et al. "Alcohol sales in Canadian liquor outlets as a predictor of subsequent COVID-19 infection rates: a time-series analysis." Addiction (2022).
[4]. Ramalho, Rodrigo. "Alcohol consumption and alcohol-related problems during the COVID-19 pandemic: a narrative review." Australasian Psychiatry 28.5: 524-526. (2020)
[5]. Xu, Y., and K. Ji. "Moutai (Maotai): production and sensory properties." Alcoholic Beverages: 315-330. (2012)
[6]. P. Chen, H. Yuan and X. Shu, "Forecasting Crime Using the ARIMA Model," 2008 Fifth International Conference on Fuzzy Systems and Knowledge Discovery, 627-630, (2008).
[7]. Fattah, Jamal, et al. "Forecasting of demand using ARIMA model." International Journal of Engineering Business Management 10: 1847979018808673 (2018).
[8]. Nochai, Rangsan, and Titida Nochai. "ARIMA model for forecasting oil palm price." Proceedings of the 2nd IMT-GT Regional Conference on Mathematics, Statistics and applications (2006).
[9]. Hyndman, Rob J., and George Athanasopoulos. "Autoregressive models." de Forecasting: Principles and Practice, otexts (2018).
[10]. Eom, K. B. . "Analysis of Acoustic Signatures from Moving Vehicles Using Time-Varying Autoregressive Models." Multidimensional Systems and Signal Processing 10(4), 357-378(1999).