


1. Introduction
Walt Disney Co. (later referred to as Disney), with its well-known characters such as the Mickey Mouse and its popular theme parks all over the world, is certainly no stranger to many families. Disney’s success is not limited only to its attractions and famous characters and works; Disney’s business model also proves to be extremely profitable and sustainable, even during the COVID-19 pandemic when so many other entertainment businesses have suffered tremendously. In 2020, when the pandemic hit the world the most, Disney generated a revenue of $65,388 million, which was only a 6.06% decrease compared to 2019, and in 2021, Disney saw a 3.10% increase in revenue, to $67,418 million. Disney’s holdings in both sites and attractions, such as theme parks, resorts, and cruises, as well as linear networks and online streaming services, are important in keeping its revenue steady, as the decline in revenue of one segment can be offset by the increase of another [1][2].
Starting in the first quarter of 2021, Disney had reorganized its business segments into Disney Parks, Experiences and Product (DPEP) segment, and Disney Media and Entertainment Distribution (DMED) segment, and has been providing a breakdown of revenue and operating income for these segments. Prior to this, the company had operated with the following segments: Media Networks; Parks, Experiences and Products; Studio Entertainment; and Direct-to-Consumer & International. This paper will primarily discuss the change in revenue and related events in the two segments, and analyze how Disney has been able to sustain itself quite effectively with the combination of the two segments, during the pandemic.
2. Decline in Revenue in Disney Parks, Experiences, and Products (DPEP) Segment
Starting from the year 2020, the globe was greatly impacted by the COVID-19 pandemic. The pandemic and the measures taken to prevent it had a great impact on theme parks all over the world. According to the 2020 Theme Index and Museum Index: The Global Attractions Attendance Report, published by TEAxAECOM, there was a 67.2% decrease in the attendance to the top 25 amusement and theme parks worldwide in 2020. These 25 parks included not only all of Disney’s holdings, but also its competitors, such as the Universal Studios and Chimelong [3].
The DPEP segment of Disney received the most severe impact, as its theme parks were shut down or forced to operate at a minimal capacity, tours and cruises suspended, and retail stores closed. Among the five Disney theme parks and resorts, all operated only partially in 2020.
Table 1: Weeks of operation by Disney resorts, 2020 to 2021.
Disney Resorts | 2020 | 2021 |
Walt Disney World Resort | 36 | 52 |
Disneyland Resort | 24 | 22 |
Disneyland Paris | 35 | 19 |
Hong Kong Disneyland Resort | 22 | 40 |
Shanghai Disney Resort | 38 | 52 |
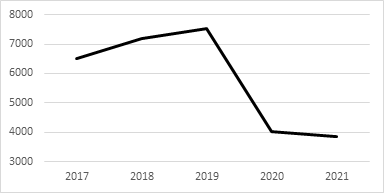 Table 1 shows the estimated weeks of operation in the five Disney Resorts in 2020 and 2021. In 2019, before the pandemic, the resorts opened 365 days a year (366 if it was a leap year). However, in 2020, there was a significant decrease in the weeks of operation, with an average of 31 weeks of operation a year, and this change was largely due to COVID-19-related measures that limited operation hours and capacity. In addition, the situation remained dire in 2021, as the resorts were still operating at a limited operation time.
Figure 1: Revenue from theme park admissions, in million dollars.
The shortened operation time, as demonstrated above, would lead to a decrease in revenue from theme park admissions, which makes up about 23.2% of Disney’s total DPEP revenue, as of 2021.
Figure 1 demonstrates a gradual increase in revenue generated from Disney’s theme park admissions, from 2017 to 2019, before the pandemic, indicating an optimistic trend in revenue. However, this revenue experienced a significant decrease of 46.45% in 2020 and a slight decrease of 4.71% in 2021, largely due to the shortened operation time, as demonstrated in Table 1.
The shortened operation time would also lead to a decrease in earnings from all relevant revenues, including revenues generate from the parks and experiences merchandise, food and beverage. Though in the 2021 annual report, the company stated that the decrease in revenues from theme park admissions was “partially offset by an increase of 8% from higher average ticket prices,” Disney nonetheless suffered tremendously from the shortened hours of operation.
 Additionally, Disney’s hotels, cruises, and guided tours also suffered tremendously.
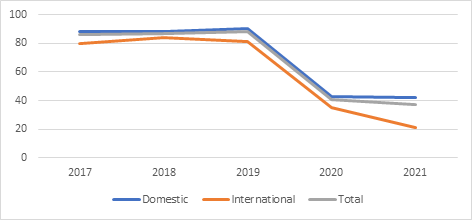
Figure 2: Disney’s hotel occupancy in percentage.
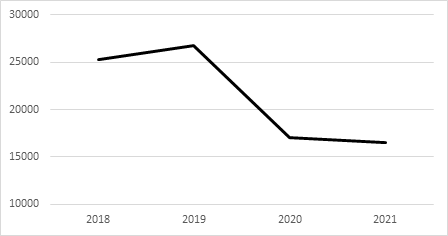 Figure 2 demonstrates that there was a sharp decrease in occupancy rate (defined as the number of room nights occupied by guests, as a percentage of available hotel room nights) from 2019 to 2020, across all Disney hotels. This observation is in accordance with the public’s caution in travel and governments’ quarantine regulations and travel ban in 2020. However, 2021 witnessed a different trend among hotels in different locations, as the occupancy rate for Disney’s hotels outside of the United States continued to drop significantly, while the occupancy in the United States seemed to remain at a steady, but low rate.
Figure 3: Revenue of DPEP, in millions dollars.
Figure 3 demonstrates a significant drop (36.4% decrease) in DPEP revenue from 2019 to 2020, which is largely explained by the shortened operation times of theme parks and the suspension or limits on capacity of Disney’s cruises and tours and a 3% decrease in DPEP’s revenue from 2020 to 2021. Luckily, Disney’s DPEP revenue recovers significantly in 2022, largely due to the reopening of parks and loosening of COVID prevention measures, as its third quarter revenue of 2022 represents a 70% increase from that of 2021, from $4341 to $7394 million [4].
3. Revenue in Disney Media and Entertainment Distribution
Similarly, Disney’s other segment, DMED, was also greatly impacted by COVID-19. DMED’s significant lines of business include the content sales/licensing sector (which includes the sale and licensing of film and television content, theatrical and music distribution, home entertainment distribution, and the staging and licensing of live entertainment events), direct-to-consumer (DTC) platforms including Disney+, Hulu and ESPN+, and linear networks (such as domestic and international channels, including ABC, ESPN and Disney).
3.1. Decline in Revenue of Content Sales/Licensing
It is natural to assume that Disney, just like other theater companies of Broadway and production companies of Hollywood, would be hurt the same way by COVID-19. It was true, as theatrical releases were shortened or cancelled, live theater performances were suspended, and most film and television production were delayed. The following graph demonstrates the trend in revenues generated from theatrical distribution (rentals from licensing Disney’s motion pictures to theaters) from 2017 to 2021. It is not surprising to find such a significant decline in 2020 and 2021, as movie theaters were closed, and audience members chose to stay at home to enjoy their favorite movies.
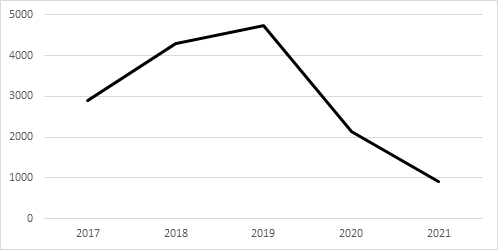 Figure 4: Revenue of Disney’s theatrical distribution, in million dollars.
Figure 4 shows the changes in revenue generated by Disney’s theatrical distributions, from 2017 to 2021. While there was a gradual increase in revenue from 2017 to 2019, before the pandemic, this revenue decreased significantly for 54.85% in 2020 and 56.89% in 2021.
3.2. Increase in Revenue of DTC Services
While a portion of Disney’s DMED segment suffered severely under COVID-19, the DTC services actually benefitted from the pandemic, as manifested in the increase in the number of subscribers and revenue.
 While theatrical distribution fell dramatically during the pandemic, global shares of digital services and the number of subscribers to these services actually skyrocketed. The Motion Picture Association reported that, in 2020, digital home entertainment market grew for 33% in the United States, and 30% globally, while the consumer spending grew 23% to $68.8 billion. At the same time, global online video subscriptions rose 26%, to 1.1 billion from 2019 to 2020, and 2021 also witnessed a 14% increase in subscription, to a total of 1.3 billion [5][6].
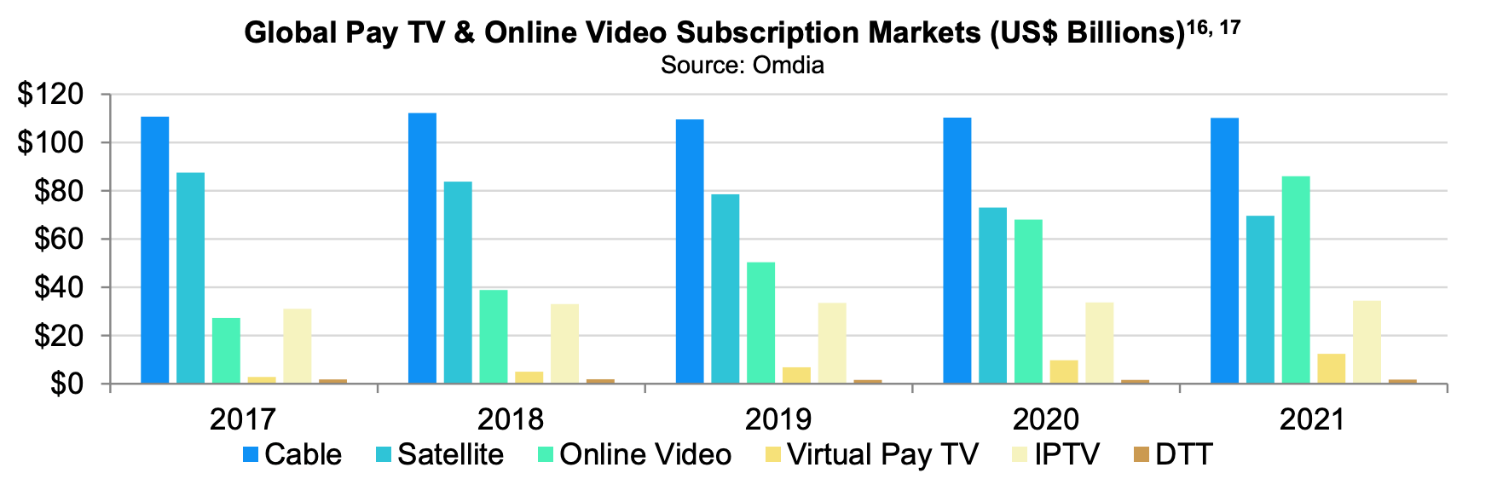
Figure 5: Global pay TV & online video subscription markets (US$ Billions).
Figure 5, taken directly from MPA’s 2021 theme report, shows that the share of online video subscription in the global pay television and online subscription markets has surpassed satellite TV in 2021, becoming the second largest share of the market, while cable networks remained the largest in the market.
As the online video subscription market grew, Disney’s DTC services also witnessed a boom in its subscribers and revenue. Disney’s DTC business sector includes streaming services of Disney+, Disney+ Hotstar, ESPN+, Star+, and Hulu. Disney+, a subscription-based service that was launched in November 2019 in the United States, received 73.7 million paid subscribers in 2020, just a year after its launch, and witnessed a 60% increase in its paid subscribers in 2021. At the same time, ESPN+’s paid subscribers almost tripled in 2020, and grew for 66% in 2021. Hulu also saw a 20% and 28% increase in paid subscribers in 2020 and 2021, respectively. An increase in paid subscription would also come with an increase in revenue. In 2020, Disney’s DTC services generated a revenue of $10,552 billions, which accounted for 16.14% of its total revenue, and that proportion rose to 24.21% in 2021.
More importantly, each of Disney’s DTC services caters to a different demographic, maximizing the customers it could reach. On one hand, ESPN+ features sports content including UFC, NFL and MLB. On the other hand, Disney+ focuses more on producing family-oriented content, including most works from Disney’s main studios and film and television libraries, such as Walt Disney Pictures, Pixar, Marvel Studios, and Lucasfilm. At the same time, Hulu, which Disney acquired a majority stake in 2019, produces, or co-produces award-winning television series such as The Handmaid’s Tale, and caters towards an older age group.
However, Disney’s DTC services have reported a loss of $2913 million in 2020, and a loss of $1679 million in 2019, which was due to the ongoing expansion and distribution costs of Disney+ and the new programming rights acquired by ESPN+. Nonetheless, with the steady rise of subscribers and revenue and the gradual decline in operating losses, the future of Disney’s DTC services’ remains optimistic, as the company has expected to become profitable in 2024 [7].
3.3. Steady Revenue Generated by Linear Network
Disney’s linear network holdings include domestic and international cable networks such as Disney, ESPN, ABC, and National Geographic. During the pandemic, this segment experienced the least impact, and its steady revenue managed to offset the decline in revenue in the other segments. From 2020 to 2021, this business sector of Disney generated a 2% increase in revenue, though its operating income experienced a 11% decrease, largely due to an increase in production and programming costs. Nonetheless, the revenue generated from linear networks remained steady in 2020 and 2021, and accounted for 41,67 % of its total revenue in 2021.
4. Future Implications and Prediction
Starting in 2022, the impact of COVID-19 on Disney began to diminish. The most significant change is found in the DPEP segment, where domestic theme parks, resorts, and cruise ships have started to operate without significant COVID-19-related restrictions and regulations, though some of the international counterparts of Disney continue to be affected by the local government regulations. At the same time, Disney’s film and television productions have resumed and Disney has been able to release produced films and works. Additionally, in the third quarter of 2022, Disney reported a total of 221 million subscribers of their DTC services, surpassing the subscriber count of 220 million of Netflix, which was arguably what used to be the most well-known and profitable online streaming site [8]. Therefore, revenues reported in the third quarter of 2022 of the DMED and DPEP segments grew for 11% and 70%, respectively, and as the impact COVID-19 dwindles gradually, Disney’s revenue will no doubt increase even more in the future.
Moreover, Disney is also actively trying to expand its business and looking into new technologies to enhance the experience of their customers, as the company has released “Golden Moments” NFTs, inspired by its intellectual property from Disney, Pixar, and Star Wars last year [9]. Additionally, in February 2022, Disney appointed an executive to oversee its metaverse strategy, indicating that Disney might be taking a further step in using the latest technology to enhance its customers’ experience [10].
5. Conclusion
Unlike other similar entertainment businesses that had suffered more disastrously from the pandemic, Disney seemed to have experienced a lesser impact, as its revenue remained steady, largely thanks to its insightful investment in different sectors of business. On one hand, Disney holds theme parks, resorts, and cruises, which remained extremely profitable before the pandemic. On the other hand, while these sectors were heavily affected during the pandemic, Disney’s holdings in streaming services, through both the Internet and the television, were able to generate steady revenues, and its online streaming sites (DTC services) were actually benefitted by the pandemic. Moreover, Disney’s reserve of countless intellectual properties enables it to endlessly expand and come up with new products, from rides and parades in their theme parks, to IP-inspired merchandise, to the production of television and film that could be consumed both in theaters and online, and to new opportunities that could have come up with the advancements in technologies. Therefore, it is reasonable to conclude that Disney’s business model proves to be effective and sustainable in the face of emergencies such as the COVID-19 pandemic.
References
[1]. Walt Disney Corporation. (2020). Annual Report 2020. https://thewaltdisneycompany.com/app/uploads/2021/01/2020-Annual-Report.pdf
[2]. Walt Disney Corporation. (2021). Annual Report 2021. https://thewaltdisneycompany.com/app/uploads/2022/01/2021-Annual-Report.pdf
[3]. Themed Entertainment Association. TEA/AECOM 2020 Theme Index and Museum Index: The Global Attractions Attendance Report. https://aecom.com/wp-content/uploads/documents/reports/AECOM-Theme-Index-2020.pdf
[4]. Walt Disney Corporation. (2022). Q3 FY22 Earnings Report.
[5]. https://thewaltdisneycompany.com/app/uploads/2022/08/q3-fy22-earnings.pdf
[6]. Motion Picture Association. 2020 Theme Report. https://www.motionpictures.org/wp-content/uploads/2021/03/ MPA-2020-THEME-Report.pdf
[7]. Motion Picture Association. 2021 Theme Report. https://www.motionpictures.org/wp-content/uploads/2022/03/ MPA-2021-THEME-Report-FINAL.pdf
[8]. Childs, Kevin: “Disney+ Expected to Lose Money Until 2024,” CBR.com, 10 Dec. 2020. https://www.cbr.com/ disney-plus-lose-money-2024/
[9]. Q.ai - Powering a Personal Wealth Movement: “Disney Surpasses Netflix Subscriber Count: What Does That Mean for Investors?” Forbes, 27 Sept. 2022. https://www.forbes.com/sites/qai/2022/09/27/disney-surpasses-netflix-subscriber-count-what-does-that-means-for-investors/?sh=542b35f55e0b
[10]. Neeson, James: “Disney Star Wars NFTS, Golden Moments Collection on Veve,” NFT News Today, 3 May. 2022. https://nftnewstoday.com/2022/05/03/disney-star-wars-nfts-golden-moments-collection-on-veve/
[11]. Chimielewski, Dawn: “EXCLUSIVE Disney names executive to oversee metaverse strategy -memo,” Reuters, 15 Feb. 2022. https://www.reuters.com/business/media-telecom/exclusive-disney-names-executive-oversee-metaverse-strategy-memo-2022-02-15/
Cite this article
Xiang,Y. (2023). An Analysis of Disney’s Revenue during the COVID-19 Pandemic. Advances in Economics, Management and Political Sciences,14,372-378.
Data availability
The datasets used and/or analyzed during the current study will be available from the authors upon reasonable request.
Disclaimer/Publisher's Note
The statements, opinions and data contained in all publications are solely those of the individual author(s) and contributor(s) and not of EWA Publishing and/or the editor(s). EWA Publishing and/or the editor(s) disclaim responsibility for any injury to people or property resulting from any ideas, methods, instructions or products referred to in the content.
About volume
Volume title: Proceedings of the 2nd International Conference on Business and Policy Studies
© 2024 by the author(s). Licensee EWA Publishing, Oxford, UK. This article is an open access article distributed under the terms and
conditions of the Creative Commons Attribution (CC BY) license. Authors who
publish this series agree to the following terms:
1. Authors retain copyright and grant the series right of first publication with the work simultaneously licensed under a Creative Commons
Attribution License that allows others to share the work with an acknowledgment of the work's authorship and initial publication in this
series.
2. Authors are able to enter into separate, additional contractual arrangements for the non-exclusive distribution of the series's published
version of the work (e.g., post it to an institutional repository or publish it in a book), with an acknowledgment of its initial
publication in this series.
3. Authors are permitted and encouraged to post their work online (e.g., in institutional repositories or on their website) prior to and
during the submission process, as it can lead to productive exchanges, as well as earlier and greater citation of published work (See
Open access policy for details).
References
[1]. Walt Disney Corporation. (2020). Annual Report 2020. https://thewaltdisneycompany.com/app/uploads/2021/01/2020-Annual-Report.pdf
[2]. Walt Disney Corporation. (2021). Annual Report 2021. https://thewaltdisneycompany.com/app/uploads/2022/01/2021-Annual-Report.pdf
[3]. Themed Entertainment Association. TEA/AECOM 2020 Theme Index and Museum Index: The Global Attractions Attendance Report. https://aecom.com/wp-content/uploads/documents/reports/AECOM-Theme-Index-2020.pdf
[4]. Walt Disney Corporation. (2022). Q3 FY22 Earnings Report.
[5]. https://thewaltdisneycompany.com/app/uploads/2022/08/q3-fy22-earnings.pdf
[6]. Motion Picture Association. 2020 Theme Report. https://www.motionpictures.org/wp-content/uploads/2021/03/ MPA-2020-THEME-Report.pdf
[7]. Motion Picture Association. 2021 Theme Report. https://www.motionpictures.org/wp-content/uploads/2022/03/ MPA-2021-THEME-Report-FINAL.pdf
[8]. Childs, Kevin: “Disney+ Expected to Lose Money Until 2024,” CBR.com, 10 Dec. 2020. https://www.cbr.com/ disney-plus-lose-money-2024/
[9]. Q.ai - Powering a Personal Wealth Movement: “Disney Surpasses Netflix Subscriber Count: What Does That Mean for Investors?” Forbes, 27 Sept. 2022. https://www.forbes.com/sites/qai/2022/09/27/disney-surpasses-netflix-subscriber-count-what-does-that-means-for-investors/?sh=542b35f55e0b
[10]. Neeson, James: “Disney Star Wars NFTS, Golden Moments Collection on Veve,” NFT News Today, 3 May. 2022. https://nftnewstoday.com/2022/05/03/disney-star-wars-nfts-golden-moments-collection-on-veve/
[11]. Chimielewski, Dawn: “EXCLUSIVE Disney names executive to oversee metaverse strategy -memo,” Reuters, 15 Feb. 2022. https://www.reuters.com/business/media-telecom/exclusive-disney-names-executive-oversee-metaverse-strategy-memo-2022-02-15/