


1. Introduction
In recent years, with the development of technology and the awakening of people's environmental awareness, the electric vehicle market has begun to flourish. Figure 1 illustrates the annual plug-in car sales evolution [1]. From 2011 to 2017, sales of plug-in vehicles had grown by leaps and bounds in three major regions, namely Europe, the US, and China. However, due to the complex international situation, different countries are facing different challenges. In some regions such as the Middle East, where oil exports are the main production capacity, it is difficult to see signs of electric vehicles on the rise. Other cases like the supply of chips required for electric vehicles are insufficient, and problems such as import difficulties also frequently appear in some countries. It seems too early to say that electric vehicles will replace traditional fuel vehicles.
Although the details vary widely, some common features are relatively obvious in the three main regions that account for more than 90% of the EV market currently. Institutional, technological, and market demand windows of opportunity emerge and interact in the industry catching up. Under the background of the overall market, it will be more meaningful to consider the influencing factors in these countries through the analysis of macro data.
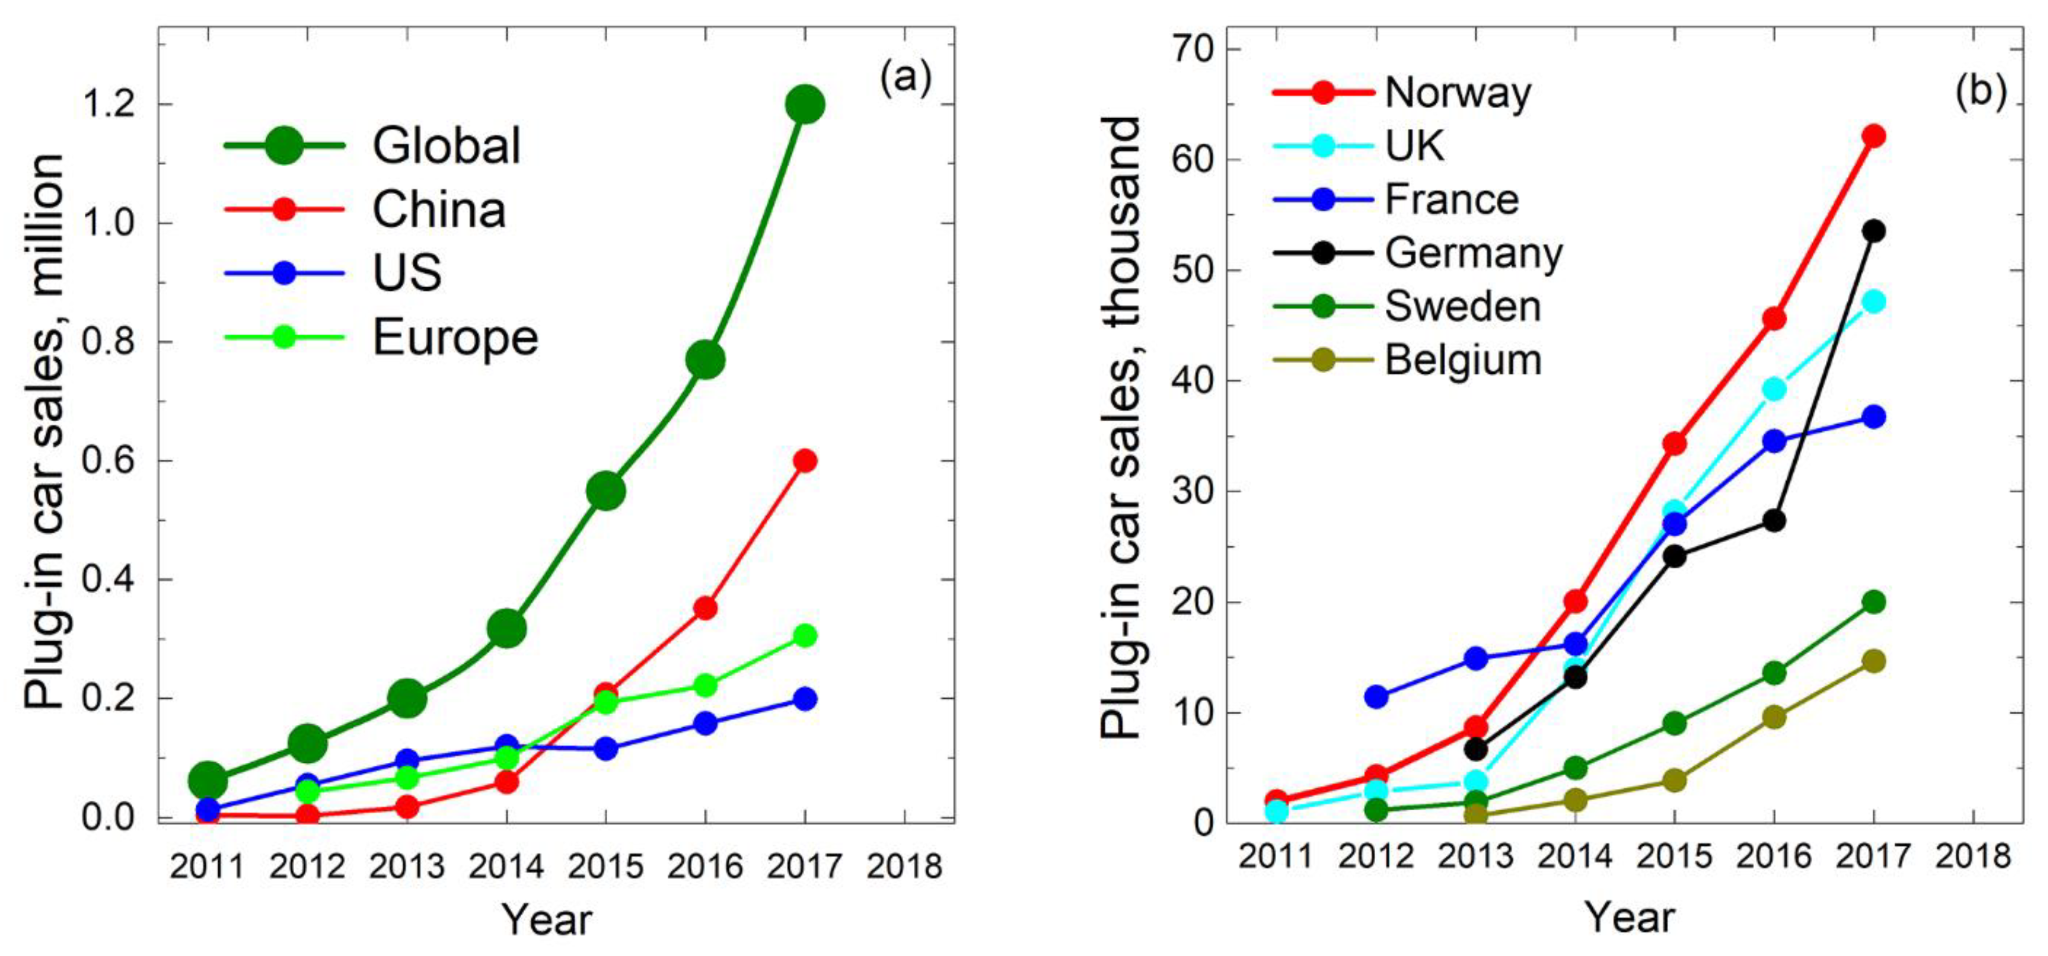
Figure 1: Annual plug-in car sales evolution: (a) worldwide, China, the United States, and Europe with (b) the specification for major European plug-in car markets [1].
2. Factors
According to previous research and intuitional suggestions, the factors affecting the sale of electric vehicles can be considered in mainly four categories: policy factors, environment factors, technological factors, economic factors. For economic factors, for example, the price of electricity and its relative price to fuel is an important factor affecting the sale of electrical vehicles because electric vehicles are the substitute commodity to fuel cars, and national GDP is also a very important factor because it measures the overall macroeconomics prosperity. For technological factors, it’s considered that the number of charging facilities, driving distance and time might have a significant influence on consumer’s choice [2]. For environmental factors, for example, the Paris climate agreement which has posed the restrictions and goals of carbon dioxide emission, might also be highly correlated to the electric vehicle market. For policy factors, however, it’s much more complicated as it’s hard to find uniformed and comparable data which means it’s harder to quantify. With all the factors above, this essay is going to do a linear multiple-variable regression which chooses the sale of electric vehicles as the dependent variable and these above factors as independent variables. And it’s going to be done separately by country and region. The regression model could be written as the following:
\( logsales={β_{1}}electricprice+{β_{2}}GDP+{β_{3}}Chargingpiles+u\ \ \ (1) \)
Where \( {β_{1}}{, β_{2}}{, β_{3}} \) represents the coefficients of each factor and u represents the error term.
3. EU Market
For the EU market, the company for electric vehicle selling is not very concentrated compared to the China and US market. Tesla is still the largest source but other European companies such as Volkswagen, Fiat or Peugeot also have a large share of the EV sales.
To discuss the factors affecting the EV sales, the regression based on these factors also applies. However, two regressions are necessary here, one regression is done by data from different countries in the EU within the same time period while another one is done by data from the same country of different time horizons. Because both time horizon and geographic factors are important, and it provides a broader view of two dimensions analysis.
Firstly, the regression among 12 different EU countries should be runned (Germany, Austria, Ireland, Italy, Netherlands, Hungary, Poland, Lithuania, Estonia, Czechia, Finland, Portugal) in the second season of 2021, with the factors being electric prices, charging facilities and GDP. The regression result is shown as Table 1 below:
Table 1: Regression results with factors affecting on EV sales for EU market (1).
F (3,8) | 1408.59 | |||
Prob > F | 0.0000 | |||
R-squared | 0.9981 | |||
Adj R-squared | 0.9974 | |||
logsales | Coef. | Std.Err. | t | P > |t| |
electricityprice | -1745.354 | 3759.043 | -0.46 | 0.655 |
GDP | 0.0010 | 0.0004 | 2.32 | 0.049 |
chargingpiles | 0.4684 | 0.0207 | 22.61 | 0.000 |
cons | 575.7472 | 709.7752 | 0.81 | 0.441 |
Secondly, the same regression ranging from January 2017 to December 2020 in Germany should be done as well, as Germany is the biggest EV market in the EU and has a significantly higher market than all other EU countries. The same regression applies, still, with these factors as the independent variables (note that CO2 emission can also be added in the regression model). The regression result is shown as Table 2 below:
Table 2: Regression results with factors affecting on EV sales for EU market (2).
F (4,43) | 79.97 | |||
Prob > F | 0.0000 | |||
R-squared | 0.8851 | |||
Adj R-squared | 0.8705 | |||
logsales | Coef. | Std.Err. | t | P > |t| |
electricityprice | -68775.04 | 16116.62 | -4.27 | 0.000 |
GDP | 5356.427 | 1641.475 | 3.26 | 0.002 |
chargingpiles | 7.8352 | 1.3992 | 5.60 | 0.000 |
co2emission | -109565.9 | 15963.15 | -6.86 | 0.000 |
cons | 3099795 | 598702.3 | 5.18 | 0.000 |
As it can be seen from Table 1 and Table 2, both regressions are significant by parameters and both indicate the same result: The electric sales are positively related to GDP, charging facilities and negatively related to electric price and CO2 emission. Because charging facilities measure the convenience of EV usage so the more charging facilities there are, the more people will be willing to buy them [3].
4. US Market
The U.S. is the third largest market in the global electric vehicle industry. In 2020, the U.S. sold about 260,000 EVs, ranking third in the global market after China and Europe. According to Statista, the energy demand for EVs in the U.S. will also be lower than in China and Europe in 2030[4].
The US is one of the countries that developed and used electric cars earlier in the world. However, different presidents have different policies on this industry, and the market is greatly affected by the policy. Nowadays, Biden announced a $2.3 trillion government budget, of which $174 billion would be devoted to developing the EV industry [5]. These greatly promote the development of this industry in the US in the future.
When building the model, based on the previous analysis, in our multiple linear regression, the dependent variable is electric vehicle sales, and the independent variables are electricity price, GDP and the number of charging piles. Since Tesla accounts for more than 60% of the market in the US, the monthly sales volume of Tesla is used as the representative of market sales. Electricity prices use average prices in U.S. cities, with data from FRED [6]. GDP uses the nominal GDP and the data is also from FRED [7]. The number of chargers uses the national total in the US, according to Statista [8]. Table 3 shows that the overall model is significant. In this model, the coefficient of electricity price is negative, while it of GDP and the number of chargers is positive. This means that sales volume is negatively correlated with electricity price, and positively correlated with GDP and the number of chargers.
Table 3: Regression results with factors affecting on EV sales for US market.
F (3,62) | 51.35 | |||
Prob > F | 0.0000 | |||
R-squared | 0.7130 | |||
Adj R-squared | 0.6992 | |||
logsales | Coef. | Std.Err. | t | P > |t| |
logprice | -5.2006 | 2.1526 | -2.42 | 0.019 |
logGDP | 8.2041 | 1.7463 | 4.70 | 0.000 |
logchargers | 0.2767 | 0.1263 | 2.19 | 0.032 |
cons | -85.0427 | 19.2727 | -4.41 | 0.000 |
5. China Market
For the China market, since China accounts for the most carbon dioxide emissions globally, the government desperately needs solutions to this problem [9]. Under this circumstance, the development of EVs has become China's national strategy. From 2018 to 2021, the investment amount in electric vehicles increased year by year, ranking first in the world. In 2021, a total of 3.2 million EVs were sold in the Chinese mainland market, accounting for half of the global EV sales and 15% of all new car sales. What’s more, the sales growth rate of electric vehicles also showed a significant increase In June 2022, China's electric vehicle sales increased by 132% year-on-year, far exceeding the global average [10].
Table 4: Regression results with factors affecting on EV sales for China market.
F (3,62) | 71.27 | |||
Prob > F | 0.0000 | |||
R-squared | 0.7752 | |||
Adj R-squared | 0.7643 | |||
logsales | Coef. | Std.Err. | t | P > |t| |
electricityprice | -27.0394 | 6.4407 | -4.20 | 0.000 |
GDP | 0.00002 | 2.61e-06 | 6.91 | 0.000 |
chargingpiles | 0.00001 | 2.37e-06 | 6.26 | 0.000 |
cons | 20.0556 | 3.3063 | 6.07 | 0.000 |
Using the same model and the same period of time, Table 4 shows the performance of influencing factors and sales in the China market. The results perform well. All three influencing factors take a vital role in sales, with a relatively high value of R-squared. Among them, electricity price and sales show a negative correlation, while the other two, GDP and the number of charging piles, show a positive correlation with sales. This is in line with the expected results.
6. Conclusion
In conclusion, initially, the EV industry is currently in the stage of rapid growth and has good development. Secondly, this industry is moving in a greener direction as a whole. In terms of market volume, from a regional perspective, China is the absolute leader now. From the perspective of car companies, Tesla has the largest market share in each region in the world. In the models of three regions, the positive or negative correlations of each independent variable with dependent variable are the same. However, the significance of t-test corresponding to each variable is different in different regions. In the case of the US, China and Germany, the GDP in the model has a large impact on sales in China and Germany, but a relatively small impact in the US. This confirms that the market environment of the electric vehicle industry in the US is not as good as that in Germany and China.
Acknowledgment
All authors contributed equally to this work and should be considered co-first authors.
References
[1]. Pelegov, D. V., & Pontes, J. (2018). Main drivers of battery industry changes: Electric vehicles—A market overview. Batteries, 4(4), 65.
[2]. Yong, T., & Park, C. (2017). A qualitative comparative analysis on factors affecting the deployment of electric vehicles. Energy Procedia, 128, 497-503.
[3]. Thiel, C., Julea, A., Acosta Iborra, B., De Miguel Echevarria, N., Peduzzi, E., Pisoni, E., ... & Krause, J. (2019). Assessing the impacts of electric vehicle recharging infrastructure deployment efforts in the European Union. Energies, 12(12), 2409
[4]. Electric vehicles worldwide. (2022) Statista. http:// study_id11578_electric-vehicles-statista-dossier.pd
[5]. Lim, S., Dolsak, N., Prakash, A., & Tanaka, S. (2022). Distributional concerns and public opinion: EV subsidies in the U.S. and Japan. Energy Policy, 164, 112883–. https://doi.org/10.1016/j.enpol.2022.112883
[6]. Fred.stlouisfed.org. (2022) Federal Reserve Economic Data | FRED. https://fred.stlouisfed.org/
[7]. FRED. (2022) Federal Reserve Economic Data | FRED | St. Louis Fed. https://fred.stlouisfed.org/
[8]. Electric vehicle charging stations and outlets in US. (2022) Statista. http:// statistic_id416750_electric-vehicle-charging-stations-and-outlets-in-us---january-2022.pdf
[9]. Ritchie, H., Roser, M., & Rosado, P. (2020). CO₂ and greenhouse gas emissions. Our world in data.
[10]. Stats.gov.cn. (2022) National Bureau of Statistics of China. http://www.stats.gov.cn/
Cite this article
Yan,Z.;Zhao,R.;Liu,B. (2023). Electric Vehicle Industry in Three Main Regions:United States, China, and EU Countries. Advances in Economics, Management and Political Sciences,17,181-185.
Data availability
The datasets used and/or analyzed during the current study will be available from the authors upon reasonable request.
Disclaimer/Publisher's Note
The statements, opinions and data contained in all publications are solely those of the individual author(s) and contributor(s) and not of EWA Publishing and/or the editor(s). EWA Publishing and/or the editor(s) disclaim responsibility for any injury to people or property resulting from any ideas, methods, instructions or products referred to in the content.
About volume
Volume title: Proceedings of the 2nd International Conference on Business and Policy Studies
© 2024 by the author(s). Licensee EWA Publishing, Oxford, UK. This article is an open access article distributed under the terms and
conditions of the Creative Commons Attribution (CC BY) license. Authors who
publish this series agree to the following terms:
1. Authors retain copyright and grant the series right of first publication with the work simultaneously licensed under a Creative Commons
Attribution License that allows others to share the work with an acknowledgment of the work's authorship and initial publication in this
series.
2. Authors are able to enter into separate, additional contractual arrangements for the non-exclusive distribution of the series's published
version of the work (e.g., post it to an institutional repository or publish it in a book), with an acknowledgment of its initial
publication in this series.
3. Authors are permitted and encouraged to post their work online (e.g., in institutional repositories or on their website) prior to and
during the submission process, as it can lead to productive exchanges, as well as earlier and greater citation of published work (See
Open access policy for details).
References
[1]. Pelegov, D. V., & Pontes, J. (2018). Main drivers of battery industry changes: Electric vehicles—A market overview. Batteries, 4(4), 65.
[2]. Yong, T., & Park, C. (2017). A qualitative comparative analysis on factors affecting the deployment of electric vehicles. Energy Procedia, 128, 497-503.
[3]. Thiel, C., Julea, A., Acosta Iborra, B., De Miguel Echevarria, N., Peduzzi, E., Pisoni, E., ... & Krause, J. (2019). Assessing the impacts of electric vehicle recharging infrastructure deployment efforts in the European Union. Energies, 12(12), 2409
[4]. Electric vehicles worldwide. (2022) Statista. http:// study_id11578_electric-vehicles-statista-dossier.pd
[5]. Lim, S., Dolsak, N., Prakash, A., & Tanaka, S. (2022). Distributional concerns and public opinion: EV subsidies in the U.S. and Japan. Energy Policy, 164, 112883–. https://doi.org/10.1016/j.enpol.2022.112883
[6]. Fred.stlouisfed.org. (2022) Federal Reserve Economic Data | FRED. https://fred.stlouisfed.org/
[7]. FRED. (2022) Federal Reserve Economic Data | FRED | St. Louis Fed. https://fred.stlouisfed.org/
[8]. Electric vehicle charging stations and outlets in US. (2022) Statista. http:// statistic_id416750_electric-vehicle-charging-stations-and-outlets-in-us---january-2022.pdf
[9]. Ritchie, H., Roser, M., & Rosado, P. (2020). CO₂ and greenhouse gas emissions. Our world in data.
[10]. Stats.gov.cn. (2022) National Bureau of Statistics of China. http://www.stats.gov.cn/