


1. Introduction
The real estate industry, as a pillar industry in China, plays a significant role in the development of the national economy, which was born in the market in the 1980s. The shortage of commercial housing supply that has been accumulated over several decades has led to the unprecedented prosperity of the real estate market, which has also cast a strong speculative color on this industry. With China's macro-control policies put from 1994 to 1997, all kinds of real estate development enterprises (e.g., Vanke Group and Evergrande Group) born in the unprecedented real estate bubble, were thoroughly baptized. Some enterprises were able to seek vitality from the market pressure brought by the vacancy of commercial housing making the industry become mature after learning from experience. In the 21st century, the real estate companies that only focus on the success of residential development have achieved considerable success through transforming them focus on the commercial real estate. Vanke and Evergrande Group, which were once the leaders of the real estate industry, have ended differently [1-4].
Nowadays, the performance of Vanke and Evergrande Group in the real estate market has been highly concerned and valued by the domestic and foreign industry becoming the center of many scholars' attention. Many research achievements have been made. Since the first half of 2021, the overwhelming news about Evergrande's bankruptcy has swept through. From the perspective of the financial statements, it seems that it is not owing to insolvency. The extreme lack of cash flow leads to this problem. Evergrande Group ranks at the bottom of the cash to debt ratio in various real estate enterprises. Systematic problems have always been one of the most important factors in Evergrande's long-term high debt ratio, which is easy to cause the depletion of liquidity and great economic trauma to the company [1]. Evergrande group is currently facing a dilemma which is the shortage of funds caused by a single financing means. It resulted in the inability to pay commercial bills when they are due, thus greatly increasing Evergrande's debt burden. On the contrary, through the analysis of Vanke Group's financial statements in the first quarter of 2020 and 2021, Vanke Group did not experience a decline in its performance. The profits, sales amount and revenue maintained a steady growth. Moreover, Vanke Group's net debt ratio of 15% and abundant cash flow have maintained a positive and high credit rating for ten consecutive years, making Vanke a model of stable operation of real estate enterprises. Besides, it has diversified financing channels, such as fast selling to recover funds from property buyers, bank loans, issuing convertible bonds, real estate trusts, stock issuance, and seeking cooperation. Maintaining a good relationship between banks and enterprises and actively expanding financing channels not only reduce enterprise risks, but also meet the needs of their own development [5-10].
Based on the background of the economic downturn and the real estate market becoming more and more sluggish, this article compares two typical real estate companies (Evergrande and Vanke group) with different development status in the real estate market by using data analysis, chart analysis, difference analysis and other methods. Looking forward to summarizing the financial model and financial structure that are constructive to real estate enterprises today from the difference between financing model, management structure and capital flow. This article is divided into three sections. First, this article analyzes the differences between the two companies. Then, it compares the average values of various indicators between the two companies and real estate industry after obtaining the differences between Evergrande and Vanke in financial models. In the last section, the article proposes the reference and improvement of the real estate enterprises in the process of the development process of these two enterprises.
2. Descriptions of Vanke and Evergrande
The development of a listed company is inseparable from the investment value of the stocks in the industry. The fluctuation of stock prices can not only reflect the company's economic position and operating status, but also future prospects and trends of the industry. Vanke shares were initially public offerings in Shenzhen Special Economic Zone Securities in December 1988, it was officially listed on the Shenzhen stock exchange in January 29, 1991. Besides, B shares were issued to foreign investors in April 1993 and listed on May 28 in the same year. In addition, raised as much as HK $451 million for the development of real estate. Vanke has blossomed and that has given it a certain elevated status. The share price soared more than 300 times, it cannot be divorced from the rapid development of the service industry in recent years and good business enterprise operation achievement [1].
Xu Jiayin absolutely controls China Evergrande, a Hong Kong-listed company through a BVI (British Virgin Islands) company, registered in the Cayman Islands, Since Evergrande Real Estate Group was listed in Hong Kong in 2009, operating income and share price sharply rise, also the earnings per share and net asset are multiplying which compared to previous year. It strongly confirms that economic situation and profitability of Evergrande group been developing steadily and keep reducing investment risk. However, the news of Evergrande officially defaulted caused widespread attention from domestic and abroad. By comparing the financial statements of Vanke in recent years, even though Evergrande's net assets and scale have always been superior to than Vanke, nevertheless, there is a data called shareholder’s profit, it shows that Evergrande's shareholder profit attributable to listed companies is only half of Vanke. Therefore, it is kind of evidence that the investment value of Evergrande Group is far from the level of Vanke Group.
3. Analysis of Vanke and Evergrande's Financing Model
3.1. Vanke
There has always been an inseparable relationship between real estate and banks. The loans provided by banks to real estate enterprises, including long-term loans and short-term loans. Up to now, more than 80% of the financing funds of real estate enterprises have come from bank loans or other bank financial products, and Vanke Group is no exception. Vanke's balance sheet in 2021 shows that Vanke's short-term borrowings in 2021 will reach 14.41 billion yuan, accounting for 1.1% of the total current liabilities; Long term loans reached 154.3 billion yuan, accounting for 10.0% of total liabilities. As shown in Table.1, Vanke's short-term borrowings will be 25.11 billion yuan, accounting for 1.9% of the total current liabilities. Long term loans amounted to 132 billion yuan, accounting for 8.7% of total liabilities. However, these data are shown in Vanke's statements in 2019 as short-term loans of 15.37 billion yuan, accounting for 1.2% of the total current liabilities. Long term loans amounted to RMB 114.3 billion, accounting for 7.8% of total liabilities. In contrast, Vanke's short-term borrowing data for the five-year period, i.e., 2016, was 16.58 billion yuan, accounting for 2.9% of the total current liabilities. Long term loans amounted to 56.41 billion yuan, accounting for 8.4% of total liabilities.
Table 1: Loan financing data of Vanke and Evergrande.
2019 | 2020 | 2021 | |
Vanke short-term loan | 153.7 B | 251.1 B | 144.1 B |
Proportion in total current liabilities | 1.2% | 1.9% | 1.1% |
Evergrande short-term loan | 3721.69 B | 3354.77 B | 2400.49 B |
Proportion in total current liabilities | 27.6% | 22.3% | 15.3% |
Vanke long-term loan | 1143 B | 1320 B | 1543 B |
Proportion in total liabilities | 7.8% | 8.7% | 10.0% |
Evergrande long-term loan | 4277.26 B | 3810.55 B | 3317.26 B |
Proportion in total liabilities | 23.1% | 19.5% | 16.8% |
According to Table.1, in the four years from 2019 to 2022, the total amount of long-term loans made by Vanke Group through banks and the proportion of long-term loans in total liabilities are gradually increasing. In addition, the total amount of long-term loans is even more than 200% higher than five years ago. It indicates that Vanke Group needs to lock in the interest rate risk in the market by increasing long-term loans, to be able to benchmark risk in the market with fluctuating interest rates, but at the same time, it also makes Vanke Group's financial risk and capital pressure become greater, with potential risks. The cyclical nature of the real estate industry itself also determines that Vanke needs more long-term loans to match its production cycle. Second, Vanke's short-term borrowings have no obvious upward or downward trend compared with long-term borrowings. To be more precise, Vanke's short-term borrowings are volatile. In recent years, China's real estate market environment is not optimistic enough, and the volatility is large. Vanke Group's response to the volatility is to adjust and plan its short-term loans Thirdly, the continuous increase of Vanke's total amount of bank loans also reflects Vanke Group's continuous expansion of its development scale from 2019 to 2022, which also leads to the continuous expansion of Vanke's total amount of loans.
Equity financing is a kind of financing method that enterprises obtain external funds by transferring their ownership, which has a long-term characteristic. According to the financial statement data of Vanke Group represented in Table.1, the paid in capital of Vanke in 2019 was RMB 11.30 billion, while this figure in 2020 and 2021 was RMB 11.62 billion and RMB 11.63 billion respectively. Although the increase of Vanke's paid in capital is small, the proportion of paid in capital in owner's equity still shows a downward trend. It can be concluded that the amount of equity financing of Vanke is relatively stable, while the proportion of equity financing shows a downward trend because the total amount of owner's equity is rising while the paid in capital is not rising.
3.2. Evergrande
Evergrande Group is another real estate enterprise that relies heavily on bank loans for financing, even more than Vanke Group. According to the data of Evergrande Group's semi annual report in 2021, the short-term borrowings of Evergrande Group are RMB 240049 million, accounting for 15.3% of the total current liabilities. Long term loans amounted to 331.726 billion yuan, accounting for 16.8% of total liabilities. In 2020, Evergrande Group's short-term borrowings will be 335.477 billion yuan, accounting for 22.3% of the total current liabilities. Long term loans amounted to RMB 381.055 billion, accounting for 19.5% of total liabilities. In 2019, Evergrande Group's short-term borrowings were 372.169 billion yuan, accounting for 27.6% of the total current liabilities; Long term loans amounted to 427.726 billion yuan, accounting for 23.1% of total liabilities.
According to the results, the total amount of short-term loans and the proportion of short-term loans in total current liabilities of Evergrande Group have shown a downward trend, which means hat Evergrande Group has gradually realized the pressure and brought by high debts to Evergrande itself under the risk of debt crisis, and has begun to consciously reduce short-term bank loans, i.e., reduce risk exposure. Moreover, Evergrande Group's long-term loans, like short-term loans, also showed a downward trend in the total amount and the proportion of long-term loans in total liabilities. Although its long-term and short-term borrowings are relatively balanced, long-term borrowings still have the problems of high cost and low flexibility. Therefore, its moderate reduction of the total amount and proportion of long-term borrowings of enterprises is conducive to the sustainable development of enterprises. As a joint-stock enterprise, this will release its own capital pressure through equity financing by issuing shares every year. Its total equity in 2018-2020 will be maintained at about 350 billion yuan, while in 2021 it will rise to more than 400 billion yuan. Evergrande will expand the scale of equity financing to repay corporate loans, purchase land for land reserve.
4. Comparison Analysis
4.1. Net Profit & Cash Flow
According to the financial statement data of Vanke Group from 2019 to 2022 shown in Fig.1, Vanke's operating profit margin is 11.7% in June 2022, while 11.6% in 2021, and that in 2020 and 2019 is 19.1% and 20.8%, respectively. From the report data of Vanke, the main reasons for the decline of Vanke Group's operating profit margin include the decline of gross profit margin, the decrease of investment income and the provision for impairment caused by the market downturn, followed by the investment mistakes of Vanke Group. In contrast, Evergrande's financial report data shows that Evergrande's operating profit margin will be 8.7% in June 2021, while before that, Evergrande's operating profit margin in 2018-2020 will be 27.19%, 15.09% and 13.30% respectively. In this case, Evergrande's operating profit margin has fallen very quickly, with the profit margin falling by more than 60% from 2018 to 2021. The reason for this sharp drop in operating profit margin is that Evergrande Group's main real estate development business suffered huge losses. However, under the condition that Evergrande's real estate development business was weak, Evergrande Group had to raise funds by selling its own assets, which led to a decline in profit margin.
According to the cash flow statement of Vanke from 2018 to 2021, the net cash flow from operating activities of Vanke is 33.62 billion, 45.69 billion, 53.19 billion and 4.11 billion respectively; Net cash flows from investment activities were -67.36 billion, -28.63 billion, 5.80 billion and -26.28 billion respectively; The net cash flows from financing activities were 44.8 billion, -33.34 billion, -32.5 billion and -23.1 billion, respectively. Compared with Vanke, its net cash flows from operating activities in 2018-2021 were 54.749 billion, -67.357 billion, 110063 billion and -14.831 billion, respectively. Net cash flows from investment activities were -60.363 billion, -55.308 billion, -24.128 billion and -19.618 billion, respectively. Net cash flows from financing activities were -17.651 billion, 143.163 billion, -76.885 billion and -37.446 billion respectively. By comparison, Vanke's liquidity is better than Evergrande Group after 2018. Secondly, Vanke's debt repayment pressure is more stable than Evergrande, so it is less likely to cause additional impact to the enterprise.
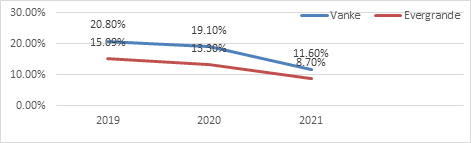
Figure 1: Line chart of operating profit margin of Vanke and Evergrande.
4.2. Asset Liability Ratio
The asset liability ratio is equal to the ratio of total liabilities to total assets. This indicator is an important indicator to evaluate the company's debt level. The asset liability ratio of Vanke Group in June 2022 is 79.16%, which is 0.73% lower than the asset liability ratio of 79.74% in 2021. The asset liability ratio of Vanke in 2020 is 81.28%, which is 3.65% lower than the asset liability ratio of 84.36% in 2019. This trend of declining asset liability ratio year by year is due to the decline of Vanke's net profit margin from 2019 to 2022, and the increase of operating cost is higher than the operating revenue, which led Vanke Group to reduce the pressure on capital flow by reducing the asset liability ratio, thus releasing the vitality of the enterprise. It can be seen from Evergrande's annual report that its asset liability ratio in June 2021 is 82.71%, down 2.43% compared with 84.77% in 2020. The asset liability ratio of Evergrande Group in 2019 is 83.75%, which is not much different from that in 2018 (83.58%). Therefore, compared with the declining asset liability ratio of Vanke Group, Evergrande's asset liability ratio has been maintained at a relatively high level, which indicates that the capital of Evergrande from external debt is too high, and the capital from owners is insufficient, which also leads to the high financial risk of Evergrande. Thus, the risk of enterprise capital chain rupture and bankruptcy reorganization is increased.
We conducted regression analysis on the asset-liability ratio of Evergrande and Vanke (Seen from Table. 2 and Table. 3). According to the results, under the condition of 95% confidence, the t-test statistic results show that the null hypothesis should not be rejected, so the asset-liability ratio of Evergrande and Vanke in the selected time interval has explanatory power.
Table 2: Regression analysis of Evergrande's asset liability ratio.
Metrics | Evergrande | Vanke |
Multiple R | 0.446939617 | 0.598059383 |
R Square | 0.199755021 | 0.357675025 |
Adjusted R Square | -0.600489958 | -0.284649949 |
Standard Error | 2.744839964 | 1.644376606 |
Table 3: Loan financing data of Vanke and Evergrande.
Coefficients | std | t Stat | P-value | |||
Evergrande. | ||||||
Intercept | 86.06 | 2.93 | 29.33 | 8.05E-06 | ||
X1 | -0.31 | 0.37 | -0.86 | 0.44 | ||
X2 | 0.51 | 2.53 | 0.20 | 0.85 | ||
X3 | 0.20 | 2.84 | 0.069 | 0.95 | ||
X4 | -0.54 | 2.77 | -0.19 | 0.86 | ||
Vanke | ||||||
Intercept | 84.28 | 1.76 | 47.94 | 1.13E-06 | ||
X1 | -0.22 | 0.22 | -1.02 | 0.37 | ||
X2 | -0.054 | 1.52 | -0.036 | 0.97 | ||
X3 | 0.79 | 1.70 | 0.46 | 0.67 | ||
X4 | 1.13 | 1.66 | 0.68 | 0.53 | ||
4.3. Vertical Comparison Between the Overall Real Estate Industry
According to the research report on China's top 100 commercial real estate enterprises from 2018 to 2022, the average asset liability ratio of the top 100 commercial real estate representative enterprises in 2022 was 70.6%, and the solvency remained stable. From 2017 to 2022. As shown in the Table. 4, the asset liability ratio of the top 100 commercial real estate enterprises declined slightly which was in a reasonable range. In 2021, the average asset liability ratio of the top 100 commercial real estate representative enterprises was 70.6%, a small decrease of 0.7% compared with 2020. The reason is that the top 100 commercial real estate enterprises have expanded their asset scale through steady scale expansion and income growth from high-quality operations to achieve stable operation. At the same time, they have reduced their liabilities. According to the financial statements of Vanke Group from 2018 to 2021, the asset liability ratio showed a gradual downward trend, but it was always higher than the average value of the top 100 enterprises. As illustrated in the Fig. 2, the leverage of enterprises has been tightened and effective measures have been taken to reduce the asset liability ratio. Vanke Group has maintained growth through completion scale, significantly accelerated completion carry forward, insisted on prudent investment, and reduced the intensity of land acquisition to decline the asset liability ratio and make it close to the industry average. According to the financial statements of Evergrande Group from 2018 to 2021, the asset liability ratio increased to 84.77% from 2018 to 2020, and then decreased to 82.71%, while the effect is not obvious. Additionally, it is always higher than the average value of the top 100 enterprises. Evergrande Group not only misjudged the future situation of real estate in the main business of real estate and took the road of radical expansion, but also blindly diversified expansion. However, when Evergrande Group realized the problem, the huge scale of liabilities had hindered its liquidity, and it was difficult to quickly reduce the asset liability ratio to the industry average.
Table 4: Average asset liability ratio of Vanke, Evergrande and Top 100 enterprises from 2018 to 2021.
Year | 2018 | 2019 | 2020 | 2021 |
Vanke Group | 84.5856 | 84.359 | 81.2835 | 79.7398 |
Evergrande Group | 83.58 | 83.75 | 84.77 | 82.71 |
Top 100 enterprises | 72.2 | 71.6 | 71.3 | 70.6 |
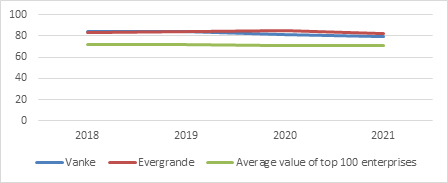
Figure 2: Line graph of the average asset liability ratio of Vanke, Evergrande and Top 100 enterprises from 2018 to 2021.
The cash flow ratio reflects the repayment ability of annual revenue cash to current liabilities. Cash flow ratio refers to the ratio of earnings before interest, income tax, depreciation and amortization (EBITDA) divided by the sum of interest or principal and interest. According to the research report on China's top 100 commercial real estate enterprises from 2018 to 2022, as listed in the Table. 5, the cash flow ratio of the top 100 commercial real estate enterprises in 2021 was 1.47%, up 0.04% from the previous year, basically stable. In order to achieve the dual goals of reducing debt and promoting development, the top 100 enterprises have achieved stable cash inflow through optimizing and strengthening operational real estate business enhancing short-term risk resistance. According to the financial statements of Vanke Group from 2018 to 2021, as shown in the Table.3, the cash flow ratio of Vanke Group increased steadily from 2018 to 2020, about 1 percentage point higher than the average of the top 100 enterprises. The cash flow ratio declined from 4.0% to 0.3% in 2021. In most cases, the cash flow ratio of Vanke Group was higher than the average value of the top 100 enterprises, which means that after the expansion to a certain extent, the cash flow of operating activities continued to rise. The large-scale financing development and large-scale leverage were not being carried out, which indicates that Vanke is beginning to enter a more benign and healthy development mode. According to the financial statements of Evergrande Group from 2018 to 2021, the cash flow ratio of Evergrande Group in 2018 was as low as - 15.3% indicating that the enterprise was in a period of seriously unhealthy capital flow. It rose rapidly to 34.5% and 39.2% in 2019 and 2020, but fell to - 3.0% in 2021. The reason for the negative cash flow ratio of the enterprise in 2018 is that Evergrande Group has a relatively weak income in other industries except the real estate industry, which leads to a large number of accounts receivable. According to the results, the cash inflow from business operations is relatively small. Year 2019 to 2020 was a period of rapid development for Evergrande. It fulfilled the huge demand for sales by rapidly increasing land reserves and construction projects. Therefore, the cash outflow climbed. By 2021, the reason for the negative cash flow ratio is that the enterprise had relatively high debt interest. In view of the incentives such as weak sales, the profit and cash inflow of the enterprise diminished.
Table 5: Average cash flow ratio of Vanke, Evergrande and Top 100 enterprises from 2018 to 2021.
Year | 2018 | 2019 | 2020 | 2021 |
Vanke Group | 3.0 | 3.6 | 4.0 | 0.3 |
Evergrande Group | -15.3 | 34.5 | 39.2 | -3.0 |
Top 100 enterprises | 1.5 | 1.47 | 1.43 | 1.47 |
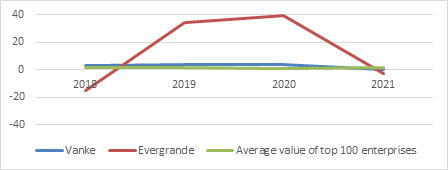
Figure 3: Line graph of the average cash flow ratio of Vanke, Evergrande and top 100 enterprises from 2018 to 2021.
5. Suggestions
Financing is always been on the indispensable conditions for real estate companies, the downturn in Evergrande can provide enlightenments function for others. Based on the analysis, the debt crisis of Evergrande Group is mainly reflected in the financing model and the pressure on payment collection has significantly increased. With the continuous suppression of the three red line policy, the financing models of real estate enterprises have shown deterioration and contraction [9]. The existing problems in the financing structure of Evergrande Real Estate Group are that the proportion of internal financing and long-term debt in equity financing is relatively low, the total amount of debt is huge, which makes extremely hard repayment pressure of the company. It should strike a balance between maintaining a relatively fast and stable development and making economic structural adjustment.
Thus, under these circumstances, it often requires long-term stable funds, otherwise, it might fall into a long-term economic crisis [10]. According to Management information and financial analysis, the company's leverage ratio is as high as 469 times, and its debt ratio reached 82.7%. Therefore, it aims to optimized the capital structure in order to face with unreasonable status of Evergrande Group's financing model and structure. By controlling the risk of cash flow, enterprises can change the financing model from the previous risk financing to a stable structure, which not only completely liberates the liquidity risk of funds, also largely enhance enterprise management capacity. Besides, due to the small proportion of long-term loans of it, the number of long-term loans can be appropriately increased. It effectively eases the pressure of debt repayment to achieve the goal of reducing the debt ratio.
Moreover, Enterprise risks can be reduced by establishing an effective risk early warning mechanism. A professional data analysis team can be deployed to calculate risk-related data such as debt ratio, profit, etc. implement risk early warning data sorting and calculation to weight the corresponding data. After the corresponding indicators are obtained, relevant risk management shall be carried out. Lastly, it also discusses a financing approach of multi-channel, multi-factor investment includes real estate trust. Furthermore, signing up to the TV show is one of channel to gain public recognition, and raise funds. The increase in financing channels will make the company's reserves relatively abundant. By comparing the differences between the two real estate companies, there are some shortages and defects in the existing financing model and structure of Evergrande. It mainly aiming at controlling cash flow and reducing debt ratio which effectively optimized and put forward a new financing strategy and plan, not only revitalize cash flow, but also make certain Reduce enterprise risks. Thus, the business prospects of enterprises can be qualitatively improved. The improvement of the financing model has significantly strengthened the function and operation effect of the corporate governance structure, also potentially affected the investors' intervention in the enterprise. Stable business pattern can bring higher profit. Enterprise risk managers are able to complete preparation in the risk warning mechanism and cash flow management.
6. Limitations & Prospects
This article utilizes many theoretical and quantitative tolls in researching the topics, each analysis will involve a large proportion such as net profit cash flow, asset ratio through the financial statement of the two companies. It is determined that the development and operating conditions of the two companies in recent years, which is able to propose some conclusions from the case. However, this method is useful but it has its limitation from the perspective of the number of samples and the types of data, only part of data in financial report were listed. Therefore, adding more real estate companies and various analysis method like what-if analysis under the condition that this indicator reaches the highest level. Hence, it makes observation in changes of business and financial circumstances of the enterprise which manly used for predicting enterprise potential. Moreover, trend analysis method should be added as well, it is able to collect the information from multiple periods and plotting it on a horizontal line to find actionable patterns. The real estate industry is probably to face larger consolidation soon. It may require to sale continued assets as a mean of financing and improving balance sheets. Right sequence and speed are key to success in the period of economy transition.
7. Conclusion
In summary, we analyze the specific financing models and various data in the financial statements in the past three years of the two real estate companies, while comparing industry average asset-liability ratio. In addition, it indicated that there are still a lot of improvement in the development process of Vanke and Evergrande, summarizes a set of financial models and financial structures that are more conducive to sustainable development of enterprises, mainly including optimizing capital structure, controlling cash flow risks. and diversified financing methods. Overall, these results offer a guideline for the new financing strategy and plan in the real estate companies in the future.
References
[1]. Hao, Y. J.: Vanke stock fundamental analysis report. Modern Marketing (Information Edition), 9, 5 (2019).
[2]. Zhang, B. Y.: The causes and enlightenment of Evergrande Group's debt crisis. Beijing Foreign Studies University (2022).
[3]. Fang, S.: Three Red Lines on the impact of real estate financing and countermeasures. Capital Shanghai (2022).
[4]. Chan, K. C., Hendershott, P. H., Sanders, A. B.: Risk and return on real estate: evidence from equity REITs. Real Estate Economics, 18(4), 431-452 (1990).
[5]. Cannon, S. Vogt, S.: REITs and Their Management: An Analysis of Organizational Structure, Performance and Management Compensation. Journal of Real Estate Research 10(3), pp. 297-317 (2020).
[6]. Grand, F.: The journal of real estate portfolio management. American Real Estate Society, 1997.
[7]. Chang N.: China Evergrande Group Real Estate Investment Risk and Countermeasure Analysis. Enterprise technology and development, 3, pp. 165-167, 2021.
[8]. Hui Q.: Analysis on the construction of the core competitiveness of real estate enterprises: taking Evergrande Group as an example. Modern Property: Mid term Journal, 7, pp. 170-171, (2020).
[9]. You, Pang, R., Cao, L., Luo, J.: Image-Based Appraisal of Real Estate Properties. IEEE Transactions on Multimedia, 19(12), pp. 2751–2759 (2017).
[10]. Jia, X.: Analysis of leverage risk of real estate in China based on behavioral finance Collection and investment 3, pp. 58 (2018).
Cite this article
Ren,Y.;Shan,Z.;Sun,J. (2023). Comparative Analysis of Real Estate Financial Model: Evidence from Vanke and Evergrande. Advances in Economics, Management and Political Sciences,17,282-291.
Data availability
The datasets used and/or analyzed during the current study will be available from the authors upon reasonable request.
Disclaimer/Publisher's Note
The statements, opinions and data contained in all publications are solely those of the individual author(s) and contributor(s) and not of EWA Publishing and/or the editor(s). EWA Publishing and/or the editor(s) disclaim responsibility for any injury to people or property resulting from any ideas, methods, instructions or products referred to in the content.
About volume
Volume title: Proceedings of the 2nd International Conference on Business and Policy Studies
© 2024 by the author(s). Licensee EWA Publishing, Oxford, UK. This article is an open access article distributed under the terms and
conditions of the Creative Commons Attribution (CC BY) license. Authors who
publish this series agree to the following terms:
1. Authors retain copyright and grant the series right of first publication with the work simultaneously licensed under a Creative Commons
Attribution License that allows others to share the work with an acknowledgment of the work's authorship and initial publication in this
series.
2. Authors are able to enter into separate, additional contractual arrangements for the non-exclusive distribution of the series's published
version of the work (e.g., post it to an institutional repository or publish it in a book), with an acknowledgment of its initial
publication in this series.
3. Authors are permitted and encouraged to post their work online (e.g., in institutional repositories or on their website) prior to and
during the submission process, as it can lead to productive exchanges, as well as earlier and greater citation of published work (See
Open access policy for details).
References
[1]. Hao, Y. J.: Vanke stock fundamental analysis report. Modern Marketing (Information Edition), 9, 5 (2019).
[2]. Zhang, B. Y.: The causes and enlightenment of Evergrande Group's debt crisis. Beijing Foreign Studies University (2022).
[3]. Fang, S.: Three Red Lines on the impact of real estate financing and countermeasures. Capital Shanghai (2022).
[4]. Chan, K. C., Hendershott, P. H., Sanders, A. B.: Risk and return on real estate: evidence from equity REITs. Real Estate Economics, 18(4), 431-452 (1990).
[5]. Cannon, S. Vogt, S.: REITs and Their Management: An Analysis of Organizational Structure, Performance and Management Compensation. Journal of Real Estate Research 10(3), pp. 297-317 (2020).
[6]. Grand, F.: The journal of real estate portfolio management. American Real Estate Society, 1997.
[7]. Chang N.: China Evergrande Group Real Estate Investment Risk and Countermeasure Analysis. Enterprise technology and development, 3, pp. 165-167, 2021.
[8]. Hui Q.: Analysis on the construction of the core competitiveness of real estate enterprises: taking Evergrande Group as an example. Modern Property: Mid term Journal, 7, pp. 170-171, (2020).
[9]. You, Pang, R., Cao, L., Luo, J.: Image-Based Appraisal of Real Estate Properties. IEEE Transactions on Multimedia, 19(12), pp. 2751–2759 (2017).
[10]. Jia, X.: Analysis of leverage risk of real estate in China based on behavioral finance Collection and investment 3, pp. 58 (2018).