


1. Background
1.1. Introduction
Air pollution, which affects human health and social development, has been a hot topic of discussion in American society. Since 2005, the U.S. has enacted bills such as the Regional Greenhouse Gas Initiative (RGGI) in an effort to control greenhouse gas emissions, especially carbon dioxide emissions. States such as California have passed the California Global Warming Solutions Act of 2006 (AB 32) and SB 32 to achieve progressive and sustainable emission reductions. At the same time, the National Academy of Sciences has proposed to support sustainable development and established the Committee on Sustainable Urban Development Pathways to study urban development in the United States. In recent years, the U.S. has reestablished the federal government as a leader in sustainable development, and has introduced various orders to support sustainable development, including Policy 101. The U.S. government's support for CO2 emissions control and sustainable development is a sign of its commitment to combating air pollution, promoting corporate transformation, and reshaping the structure of the energy industry.
In fact, it is difficult to conclude on the surface the relationship between CO2 emissions (air pollution) and the mining sector. Therefore, we try to explain the relationship by looking at the "disincentive effect" and "incentive effect" of air pollution. A number of papers have argued that the "disincentive effect" of air pollution has seriously affected the development and transformation of enterprises. The "disincentive effect" on the technological innovation and transformation of enterprises is reflected in two aspects. First, air pollution tends to cause residents to leave the most polluted areas, thus causing a brain drain of scientific and technological innovation to enterprises. On the other hand, government policies to control CO2 emissions, such as a carbon tax, can raise the cost of production and therefore reduce companies' investment in talent and capital. However, the vast majority of papers indicate that the "incentive effect" of air pollution is the dominant influence on firms' technological innovation. That is, air pollution affects firms' R&D investment decisions and therefore provides firms with capital to innovate and transform. On the other hand, the government's strong support for sustainable development also allows producers to accelerate innovation and transformation [1] Therefore, we conclude that the impact of air pollution on corporate technological innovation is mainly reflected in the "incentive effect".
But how does air pollution's incentive for companies to innovate and transform their technology connect to the mining industry? In fact, the low carbon transition of business means a shift in our energy system from fuel intensive to material intensive. This also means a gradual and sustained growth in the mineral resources required by the new energy industry, as mineral resources, such as new energy minerals, new materials minerals, and new technology minerals, play a critical role in both the energy transition and technological innovation. As the demand for mineral resources is significantly higher, there is no doubt that this will also be a new opportunity for the mining industry which can provides minerals and metals needed for sustainable energy industry development. Therefore, we finally conclude that air pollution will eventually affect the mining industry.
1.2. Conceptual Framework
In this research proposal, we will first summarize current studies about our topic and the articles we have read in the literature review. And we explained our hypothesis and our innovation point. Then we used data and models to prove our hypothesis. Data description, methodology, and relevant tests have been shown in this part. Eventually, we laid out our conclusion, reflection, and summary, as well as future plan.
1.3. Literature Review
The extant studies on the impact of pollution, especially CO2 emissions, on the mining industry can be divided into three groups. They respectively illustrate the relationship between CO2 emissions and output in the mining industry and the impact of carbon reduction policy, and the existence of the “incentive effect.”
First Group: The Positive Correlation between Carbon Dioxide Emissions and Output In the first group, most papers indicate that the output in the mining industry is directly proportional to CO2 emissions. The Mining Industry as a Net Beneficiary Of a Global Tax on Carbon Emissions [2] indicates an increasing demand for minerals, metals, and other energy including carbon dioxide in the mining industry, meaning that carbon dioxide can still be considered as one of the “pillar energy”. Carbon Emission Decoupling and Energy Consumption in Mining Industry of China [3] suggests that an increment in economic output will lead to a rise in consumption of carbon dioxide. Additionally, the cumulative effect of carbon dioxide mentioned in the paper indicates that the CO2 emission is proportional to the energy output.
Second Group: Carbon Reduction policies and their Impact In the second group, many papers describe how different carbon reduction policies exert direct or indirect impacts on the output of the mining industry. The Mining Industry as a Net Beneficiary of a Global Tax on Carbon Emissions points [2]out that pricing policy in carbon accelerated the transition to renewable energy. The effects of carbon dioxide, methane, and nitrous oxide emission taxes: An empirical study in China [4] indicates that carbon taxes will lead to a decrease in mining output. The Impact of Energy Tax on Carbon Emission Mitigation: An Integrated Analysis Using CGE and SDA [5] mentioned that a higher tax rate will lead to more pronounced reductions in CO2 emissions. And the carbon intensity effect is the dominant factor driving national CO2 emissions and CO2 emission intensity decline. Research on the Influence of Air Quality on Labor Supply [6] points out the impacts of industrial structure transitions on CO emissions and reveals significant impacts across the three provinces, which can act as a reference for CO2 emissions. Moreover, we discovered that SAM (Social Accounting Matrix) model is quite commonly used in these articles to process the data.
Third Group: Incentive Effect The third group, The Impact of Air Pollution on Regional Technological Innovation: Evidence Based on Big Data of Patent Authorization [1] mainly discusses two effects—inhibition effect and incentive effect. It also explores which affect air pollution have been the pillar effect on the level of industrial innovation. This article inspired us to further explore the incentive effect, and what is the logic chain between carbon reduction policy and industrial transformation.
Additional Information Carbon Emission Decoupling and Energy Consumption in Mining Industry of China [3] proves there is no relationship between the employment rate and carbon emissions, so it gives us the inspiration to use “employment rate” as a controlled variable, as it won’t destroy the MLR.4 (Unbiasedness).
2. Hypothesis and Its Development
2.1. Hypothesis
Hypothesis one: An increase in CO2 emissions will promote the development of the mining industry.
Hypothesis two: Incentive effect will happen.
2.2. Hypothesis Development
Our hypothesis is formulated in two parts, in which we use the "incentive effect" of air pollution on firms as a transition. About 20 years ago, people began to understand the human and social risks of greenhouse gases such as carbon dioxide. Air pollution is caused by the unabated increase of greenhouse gases such as carbon dioxide in the air. Around 2005, the U.S. government began to adopt policies, such as the Regional Greenhouse Gas Initiative (RGGI) Act, to control CO2 emissions and support sustainable development. It is also in this context that many companies, such as the coal industry, are suffering from the effects of air pollution - which is costing them talent - while being pressured by national policies, such as carbon taxes, which raise their production costs and promote sustainability. Many companies have chosen or been forced to start innovating or transforming. Thus, we conclude that this "incentive effect" of air pollution on business innovation ultimately allows many firms to successfully innovate or transform.
As a result of the large number of firms starting to innovate and transition to low carbon, our nation's energy system is gradually shifting from fuel-intensive to material-intensive. This has meant a significant increase in the mineral resources needed for innovation and transformation, such as new energy minerals, new materials minerals, and new technology minerals. Therefore, this change undoubtedly opens up new opportunities for the mining industry, which can provide mineral and metal resources for these companies. Combining these two changes I just described, we ultimately infer that elevated CO2 emissions will boost the mining industry.
3. Data and Methodology
3.1. Data Description
To test our hypotheses, we collected panel data from 2000 to 2019 at state level in the United States. Instead of using the exact number each year, we calculated the difference between two consecutive years to represent the reduction that we emphasize in our research. The description of our variables is presented in Table 1.
Table 1: Data description and resource.
Variable | Description | Data Source |
Quantity_diff | Difference in the total quantity of mining output between two consecutive years in one million metric tons. | United States Geological Survey (USGS) [7] |
CO2_diff | Difference in the CO2 emissions between two consecutive years in metric tons. | Energy Information Administration (EIA) [8] |
rGDP_diff | Difference in real GDP between two consecutive years in millions of chained 2012 dollars. | Bureau of Economic Analysis (BEA) [9] |
manufac_diff | Difference in total jobs in manufacturing sector between two consecutive years. | Bureau of Economic Analysis (BEA) [10] |
To build our regression model, we use Quantity_diff as the dependent variable and the rest of the variables as the independent variables. Among these independent variables, real GDP and employment in manufacturing sector are used as controls. These two variables serve as indicators of local economies, and they are supposed to be related to local mining industries.
3.2. Descriptive Analysis of Variables
This part describes the variables in our model. Table 2 includes the arithmetic mean, standard deviation, minimum value, median and maximum value of our variables.
Table 2: Summary of variables.
Variable | Mean | Min | Median | Max | StdDev |
Quantity_diff | -0.2318 | -32.2 | -0.0285 | 18.8 | 3.353785 |
CO2_diff | -0.6346 | -33.22 | -0.05 | 30.72 | 5.665086 |
rGDP_diff | 5746.8 | -66199.1 | 2789.2 | 113874.7 | 13488.66 |
manufac_diff | -4776 | -147225 | -361 | 36138 | 16545.27 |
The range of change in mining output between two consecutive years varies from decreasing by 32,2 million metric tons to increasing by 18.8 million metric tons. We can observe that the mining output decreases 0.2318 million metric tons each year by average and the standard deviation of the change is roughly 3.35 million metric tons.
The range of change in carbon dioxide emissions between two consecutive years varies from decreasing by 32.22 metric tons to increasing by 30.72 metric tons. The carbon dioxide emissions decrease by 0.6346 metric tons each year by average and the standard deviation is approximately 5.67 metric tons.
We also calculated the correlation coefficients among different variables and drew a correlation plot based on these coefficients using R studio.
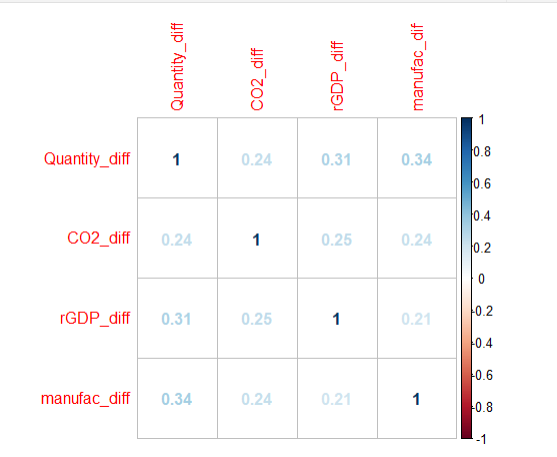
Figure 1: Correlation plot of variables.
As shown on the correlation plot, the correlation coefficients among different variables are comparatively low. We can also observe positive correlation between each different variable.
3.3. Regression Model and Result
OLS Model In order to test our hypothesis, we built an ordinary least square (OLS) regression model. The regression equation is shown below.
\( Quantity\_diff = {β_{0}}+{β_{1}}∗CO2\_diff+{β_{2}}∗rGDP\_diff+{β_{3}}∗manufac\_diff+u \)
Regression Diagnosis To test for normality of the residuals in the regression model, we drew a QQ plot using R.
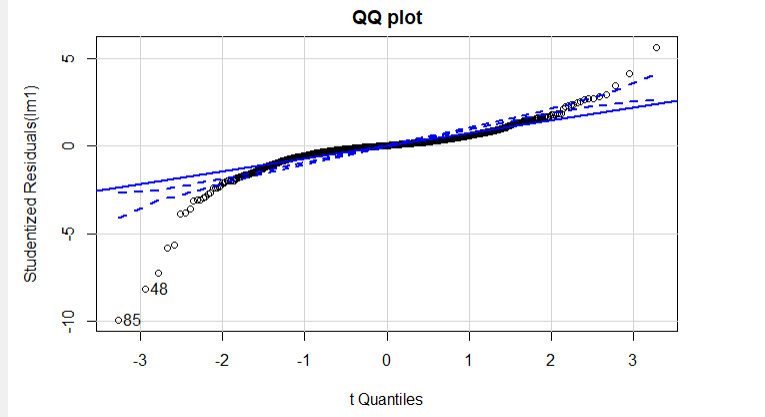
Figure 2: QQ plot of the regression model.
The QQ plot shows that the residuals deviate at the tail, suggesting that there should be no normality problem in our model.
To test for heteroskedasticity, we plotted the residuals versus fitted values, the trend line in red is flat, suggesting that there should be no heteroskedasticity.
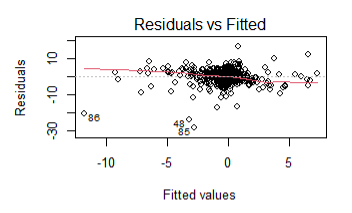
Figure 3: Residuals vs fitted plot of the regression model.
To test for multicollinearity, we calculated the variance inflation factor (VIF) of the variables in the regression model. The VIF for CO2_diff, rGDP_diff and manufac_diff is 1.109892, 1.095108 and 1.085791, respectively. They are all below 5, suggesting that there should be no multicollinearity in our regression model.
Regression Result The estimates of the variables in our regression model are shown in Table 3. Also, the standard errors of each variable are included in the brackets below the estimates.
Table 3: Result of the Regression Model.
Variable | Estimate | Pr(>|t|) |
(Intercept) | 0.2591 (0.1172) | 0.02733 * |
CO2_diff | 0.07252 (0.01874) | 0.000117 *** |
rGDP_diff | 0.000057 (0.000007819) | 6.79e-13 *** |
manufac_diff | 0.00005323 (0.000006347) | < 2e-16 *** |
Significance codes: *p < .05. **p < .01. ***p < .001
Based on our regression model, we can affirm that CO2_diff is significantly positive at 99% confidence level. The regression result suggests that, holding other variables constant, one metric ton’s increase in the difference in carbon dioxide emission between two consecutive years is expected to increase the difference in mining output between two consecutive years by 0.07252 million metric tons, and the range is between 0.0357896 to 0.1092504 at 95% confidence level.
The table above also suggests that our control variables, real GDP, and manufacturing employment are also significantly positive at 99% confidence level. Holding other variables constant, one additional millions of difference in real GDP in chained 2012 dollars between two consecutive years is expected to increase the difference in mining output between two consecutive years by 0.000057 million metric tons, and the range is between 0.00004167476 to 0.00007232524 at 95% confidence level.
Holding other variables constant, increasing the difference in employment in manufacturing sector between two consecutive years by 1 is expected to increase the difference in mining output between two consecutive years by 0.00005323, and the range is between 0.00004078988 to 0.006567012 at 95% confidence level.
4. Conclusion and Reflection
4.1. Conclusion
This paper meticulously analyzes the impact of changes in CO2 emissions on the output of the mining industry by using panel data from 2000 to 2018, combined with OLS models. Based on the analysis in this paper, there is a significant positive impact of increased CO2 emissions on the output of the mining industry. Therefore, our findings support our hypothesis.
Additionally, based on our logic chain, a carbon reduction policy will lead to a decline in carbon consumption and a decline in mining output as we have proved above, so to fix this problem, factories or producers may use other clean energy to replace carbon. In that case, it may reduces carbon emissions and boosts the industrial transformation.
4.2. The Difficulties We Encountered
Topic Initially, we chose to study the relationship between carbon emissions (IV) and energy consumption (DV). However, studying how carbon emissions affect energy consumption could lead to several problems, like DV may affect IV. Then we chose to study the relationship between real GDP, carbon emissions, and energy consumption. But based on our literature research, most studies on this topic use PVAR instead of OLS. When we searched relevant literature, we found that the mining industry produced a number of carbon emissions, so we finally chose this topic.
Data At first, we put annual data directly in our model but failed to obtain the final result as it didn't pass the test. Therefore, we calculated the change value in mining output and carbon emissions to conclude, and it worked.
Additionally, we met some difficulties in data research and processing. It is hard to find a large sample of data on carbon emissions, so we started to find state-based data in the past 20 years. And while processing data, we changed the format of the data-set from time to time to ensure R data could operate normally.
4.3. Reflection and Future Plan
The incentive effect still remains at the theoretical stage, which has only been explained by our logic chain instead of the evidence and data set. Therefore, we will continuously find relevant data-set and appropriate models to prove whether it will happen.
Acknowledgements
Qianyi Zhou, Jingya Li, and Xianzhe He contributed equally to this work and should be considered co-first authors.
References
[1]. Dong, W., Cai, F. (2021). The Impact of Air Pollution on Regional Technological Innovation: Evidence Based on Big Data of Patent Authorization. South China Journal of Economics, 40(8): 112-134
[2]. Cox, B., Innis, S., Kunz, N. C., & Steen, J. (2022). The mining industry as a net beneficiary of a global tax on carbon emissions. Communications Earth & Environment, 3(1), 1-8.
[3]. Luo, S., Wu, Q. (2018). Carbon Emission Decoupling and Energy Consumption In Mining Industry of China. Resources & Industries.
[4]. Liu, L. C., & Wu, G. (2017). The effects of carbon dioxide, methane and nitrous oxide emission taxes: An empirical study in China. Journal of Cleaner Production, 142, 1044-1054.
[5]. Li, H., Wang, J., & Wang, S. (2022). The Impact of Energy Tax on Carbon Emission Mitigation: An Integrated Analysis Using CGE and SDA. Sustainability, 14(3), 1087.
[6]. Wang, Q., (2018). Research on the influence of air quality on labor supply. University of Electronic Science and Technology of China.
[7]. United States Geological Survey (2021) USGS Aggregates Time Series Data by State, Type, and End Use. [Data set]. Retrieved from https://www.usgs.gov/media/files/usgs-aggregates-time-series-data-state-type-and-end-use
[8]. Energy Information Administration (2022) State energy-related carbon dioxide emissions by year. [Data set]. Retrieved from https://www.eia.gov/environment/emissions/state/
[9]. Bureau of Economic Analysis. (2022) SQGDP9 Real GDP by state 1. [Data set]. Retrieved from https://apps.bea.gov/itable/iTable.cfm?ReqID=70&step=1&acrdn=1.
[10]. Bureau of Economic Analysis. (2022) SAEMP25N Total Full-Time and Part-Time Employment by NAICS Industry 1. [Data set]. Retrieved from https://apps.bea.gov/itable/iTable.cfm?ReqID=70&step=1&acrdn=1
Cite this article
Zhou,Q.;Li,J.;He,X. (2023). How Changes in Carbon Emissions Affect the Output of Mining Industry and Analysis on the “Incentive Effect”. Advances in Economics, Management and Political Sciences,18,68-75.
Data availability
The datasets used and/or analyzed during the current study will be available from the authors upon reasonable request.
Disclaimer/Publisher's Note
The statements, opinions and data contained in all publications are solely those of the individual author(s) and contributor(s) and not of EWA Publishing and/or the editor(s). EWA Publishing and/or the editor(s) disclaim responsibility for any injury to people or property resulting from any ideas, methods, instructions or products referred to in the content.
About volume
Volume title: Proceedings of the 2023 International Conference on Management Research and Economic Development
© 2024 by the author(s). Licensee EWA Publishing, Oxford, UK. This article is an open access article distributed under the terms and
conditions of the Creative Commons Attribution (CC BY) license. Authors who
publish this series agree to the following terms:
1. Authors retain copyright and grant the series right of first publication with the work simultaneously licensed under a Creative Commons
Attribution License that allows others to share the work with an acknowledgment of the work's authorship and initial publication in this
series.
2. Authors are able to enter into separate, additional contractual arrangements for the non-exclusive distribution of the series's published
version of the work (e.g., post it to an institutional repository or publish it in a book), with an acknowledgment of its initial
publication in this series.
3. Authors are permitted and encouraged to post their work online (e.g., in institutional repositories or on their website) prior to and
during the submission process, as it can lead to productive exchanges, as well as earlier and greater citation of published work (See
Open access policy for details).
References
[1]. Dong, W., Cai, F. (2021). The Impact of Air Pollution on Regional Technological Innovation: Evidence Based on Big Data of Patent Authorization. South China Journal of Economics, 40(8): 112-134
[2]. Cox, B., Innis, S., Kunz, N. C., & Steen, J. (2022). The mining industry as a net beneficiary of a global tax on carbon emissions. Communications Earth & Environment, 3(1), 1-8.
[3]. Luo, S., Wu, Q. (2018). Carbon Emission Decoupling and Energy Consumption In Mining Industry of China. Resources & Industries.
[4]. Liu, L. C., & Wu, G. (2017). The effects of carbon dioxide, methane and nitrous oxide emission taxes: An empirical study in China. Journal of Cleaner Production, 142, 1044-1054.
[5]. Li, H., Wang, J., & Wang, S. (2022). The Impact of Energy Tax on Carbon Emission Mitigation: An Integrated Analysis Using CGE and SDA. Sustainability, 14(3), 1087.
[6]. Wang, Q., (2018). Research on the influence of air quality on labor supply. University of Electronic Science and Technology of China.
[7]. United States Geological Survey (2021) USGS Aggregates Time Series Data by State, Type, and End Use. [Data set]. Retrieved from https://www.usgs.gov/media/files/usgs-aggregates-time-series-data-state-type-and-end-use
[8]. Energy Information Administration (2022) State energy-related carbon dioxide emissions by year. [Data set]. Retrieved from https://www.eia.gov/environment/emissions/state/
[9]. Bureau of Economic Analysis. (2022) SQGDP9 Real GDP by state 1. [Data set]. Retrieved from https://apps.bea.gov/itable/iTable.cfm?ReqID=70&step=1&acrdn=1.
[10]. Bureau of Economic Analysis. (2022) SAEMP25N Total Full-Time and Part-Time Employment by NAICS Industry 1. [Data set]. Retrieved from https://apps.bea.gov/itable/iTable.cfm?ReqID=70&step=1&acrdn=1