


1. Introduction
Over the past few years, the salary cap in NBA has been increasing drastically, with a further projected increase after the league signed a gigantic nine-year, $24-billion T.V. deal in 2017[1]. In the 2015-2016 season, the salary cap was $70 million, and according to the latest news, the 2023-2024 season salary cap is around $134millions, nearly double from 8 years ago [2]. Seeing the significance of the surge in the salary cap, this study first takes a statistical approach to the relationship between the salary cap and the NBA team's success. After some research, the study determined that measuring the game won in the regular season is more reliable because team performance is more consistent during this period than in playoffs, where winning is highly affected by external factors such as home-court advantage [1].
2. Methods
This paper gets the data from a website called spotrac.com. It provides detailed statistics regarding the salary cap in 2020-2021 and 2021-2022. The data also provides the winning percentage of the game. It also time it with the number of games played in that season. In the 2020-21 season, it was 72 games, and in 2021-2022, 82.
3. Results
After getting the salary cap number and the game won, it started a regression test in excel for both seasons. In the test, it considers the total cap as the independent variable and the game won as the dependent variable. This paper also aims to find the R number for both seasons. The correlation in 2021-2022 is 0.37 (see Table 1), and for 2020-2021 is 0.26 (see Table 2). This means that there is a moderate relationship between the two variables.
Table 1: Correlation in 2021-2022.
SUMMARY OUTUT |
REGRESSION STATISTICS MULTIPLE 0.25710541 |
R SQUARE 0.06610319 |
ADJUST R SQUARE 0.03274973 STANDARD ERROR 9.8484426 |
OBSE5RVATIONS 30 |
Table 2: Correlation in 2020-2021.
SUMMARY OUTPUT |
REGRESSION STATISTICS Multiple R 0.3728288 |
R SQUARE 0.1390013 |
ADJUSTED R SQUARE 0.1082514 |
STANDARD ERROR 10.922903 |
OBSERBNATION 30 |
After further research, the study found that another study did the same thing in 2017, which determined the correlation coefficient in 2011. the correlation coefficient between team payroll and regular season wins was 0.535 high enough to conclude that teams with deep rosters have been able to achieve success simply by spending more money on talent, at least to some extent [3]. However, the number in the recent two seasons is significantly lower back then. Therefore, this paper infer that the NBA is no longer like a decade ago when a team put in more money to get a better team roaster and a championship. Now the team competition lies in how to allocate the players' salaries reasonably. This hypothesis has led to further research on salary efficiency and the game won. This paper is eager to find out whether to spend the cap on star players only or a bunch of functional players.
4. Exploring Salary Efficiency (SE)
The study uses the concept of salary efficiency to determine a team's strategy regarding its payroll. According to our idea, an efficient team spends only a small amount of money on the most expensive players and wins the most game. The method it came up with was dividing the winning game number by the percentage of the salary the team highest received. So, for example, if a team wins 60 games a season, and the highest-paid player receives 20% of the wage, the S.E. score will be 300. This method is proper when considering the effect of those all-star players on the team and those teams that evenly distributed their salary cap. After the paper set the method, we come up with the number for both seasons. In the 2020-2021 season, the median is around 158, with a standard error of 10. In the 2021-2022 season, the median is about 201, with a standard error of 13. This number has significantly different because the regular season is only 72 games in 2020-21 because of the pandemic. it uses Excel to draw the curve of S.E. for both the 2020-21 and 2021-22 seasons. Both seasons manifest a more substantial and positive correlation as shown in Figure 1 and Figure 2. The correlation for both seasons is around 0.67.
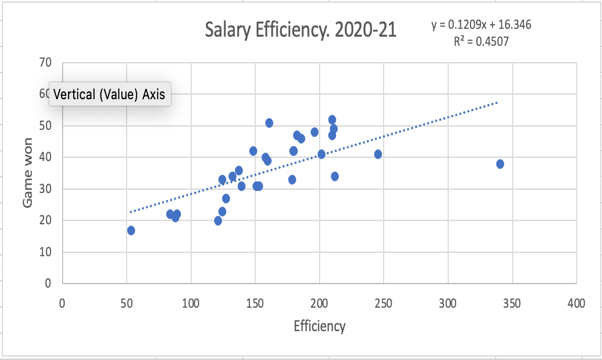
Figure 1: Salary efficiency 2020-21.
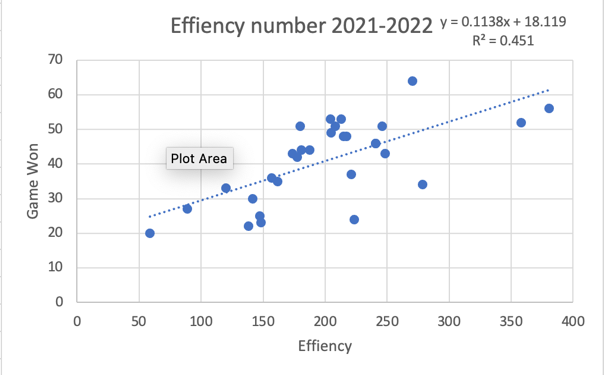
Figure 2: Efficiency number 2021-2022.
Furthermore, among the top 16 scores in S.E., only two did not make it to the playoff in 2020-2021 and three in 2021-2022. However, there is a slightly diminishing slope after the S.E. score exceeds the median. This is significant because it indicates that a more equally distributed salary cap is good enough for a team to get into the playoffs. However, S.E. does not improve drastically after getting into the playoff. The paper wants to make sure this has been a trend in recent years. The research found out that in season 2017-2018, a regular season before the pandemic, the Efficiency number, and the game were about 0.66, which is also highly correlated. The research we find even predicts a hypothesis that a team needs one or two superstars to achieve a higher goal than making the playoffs. The teams with the six best records all had superstar(s) on their roster: James Harden, DeMar DeRozan*, the Big 4 in Golden State, Kyrie Irving, Joel Embiid, and LeBron James, respectively [4].
From the above statistics, this research can confirm that the salary cap allocation significantly influences the team's performance on the court. However, when the study looks again at the number in the Table 2, we find some interesting outliers. For example, the S.E. scores for Memphis Grizzlies and Dallas Mavericks are significantly higher than the others. This means they ranked really high without giving high salaries to any of the players. On the other hand, the Los Angeles Lakers, whose top player accounts for over 25% of the total caps, which seems to satisfy the condition for winning the championship, played so poorly that their S.E. is among the lowest in the league.
A salary cap is a common term in North America and even in sports leagues worldwide. Dietl et al. mentioned that a salary cap limits the total amount of salary a sports league club can pay to other players [5]. According to Dietl et al., all four U.S. sports leagues have introduced some co-salary cap mechanisms [5]. In contrast to agreements between team owners and players, salary caps are an important part of the composition of contemporary sports labor-management relations [5]. The salary cap not only limits the salary cap of players but also promotes a balanced league. Sports are often very boring when there is unbalanced competition. Historically, sports leagues in the United States have taken different approaches to avoid this situation, and the salary cap is the latest approach to address this problem. A salary cap would promote performance parity between sports league teams. Small market teams have a better chance to compete with large market teams. The salary cap affects not only the salary level of players, but the performance of players is also affected by the salary cap. Investigating the association between players and player performance has long been an area of research in sports [6]. A salary cap can also make the salary level of players more equal; the better the players' performance, the better the chance to fight for high technology. In this case, the salary cap will promote players' performance. However, the salary cap can have a different performance impact on players if the team is willing to pay the luxury tax to invest more or if the team wants to stay away from the salary cap limit and invest less. This article focuses on the salary cap of the NBA league. The NBA salary cap is determined by a collective bargaining agreement between the teams and the players' union [7]. Keefer also mentioned that NBA teams are also required to have a minimum salary limit, but at the same time, they cannot exceed the salary line; beyond the ceiling, the team will pay the luxury tax [7]. The main purpose of this study is to conclude the relationship between salary cap and team performance and seasonal returns through the association between NBA team salary cap and team input levels with team performance and seasonal returns. This research hypothesizes that highly invested teams will have better performance in the season and that low-investment teams do not get as much return on results as high-investment teams do but will get a high rate of return in the draft.
The study also looks at teams in the NBA that have invested a lot but have not received the expected returns. Among the NBA teams in the 2020-2021 season, the Brooklyn Nets from the Eastern Conference are a prime example. The Brooklyn Nets' total investment for that season was among the highest in the league, and their active salary cap ranked second at $164,541,070. However, they were eliminated from the playoffs that season in just the second round. Such a result does not satisfy the team's management and fans for a team with the second-highest investment in the league. In addition, they paid over $30 million in luxury taxes. A mere second-round finish in the playoffs cannot be accepted for a team with this kind of commitment. It is worth mentioning that the Brooklyn Nets finished second in the East in the regular season of that NBA, but the regular season record is not representative of the final result. In reviewing the 2021 NBA Draft, the Brooklyn Nets were only given the 27th pick in the first round. So when looking back at the 2020-2021 season, it is safe to assume that the Brooklyn Nets' high investment has not paid off in terms of team results, performance, or draft picks. The Brooklyn Nets have very expensive superstars, and they look like they should be a super team in terms of the roster [8]. However, that is not the case; Young also mentioned that the team had committed more than $300 million to Kevin Durant and Kyrie Irving after 2019. However, the team has never made a big improvement in its record. The same goes for the Golden State Warriors from the Western Conference. The Golden State Warriors ranked even higher than the Brooklyn Nets in the 2020-2021 NBA team active salary cap rankings at $168,454,133. Their team's luxury tax payroll came in at nearly $170 million and paid close to $40 million in luxury taxes that season. However, reviewing that season's ranking, they performed worse than the Brooklyn Nets, who were just analyzed. They finished the regular season in eighth place in the Western Conference, and the team's winning percentage did not reach 50 percent. They had a tough time getting into playoff contention. In the playoffs, the Golden State Warriors were eliminated in just the first round. Unlike the Nets, the Warriors have been very competitive. They also had more than that as their goal before that season began. Their high investment in that season also could not be rewarded to the satisfaction of fans and management, at least in terms of record. However, they were well rewarded in the 2021 NBA Draft. They drafted two lottery picks in this draft. This provides a corresponding guarantee for the future development of their team. So, as you can see by the Warriors, although their investment did not pay off in terms of record, they were successful in the draft.
Table 3: T test correlation between salary cup and w/l%.
Team | Salary Cap | Draft Rank | Season Division Rank |
Golden states warriors | 168,454,133 | 7 | 8 |
Los Angeles | 129,324,500 | 22 | 7 |
San Anton Spurs | 103,942,196 | 12,41 | 10 |
Houston Rockets | 121,883,222 | 2,23,24 | 15 |
Indiana Pacers | 125,044,311 | 13,60 | 9 |
Chicago Bulls | 127,968,098 | 38 | 11 |
Brooklyn Nets | 164,541,070 | 27,59 | 2 |
Boston Celtics | 127,473,888 | 45 | 7 |
Charlotte Hornets | 98,277,101 | 11 | 10 |
Atlanta Hawks | 115,950,371 | 20 | 5 |
This Table 3 shows the ten teams in the NBA, mainly in the four regions, their salary cap data in a season and their season divisional ranking as well as their ranking in the draft. According to Table 3, the different teams have had relevant problems with the salary cap in the recent two years. The salary cup is not the only reason which can cause the low return and performance in a high investment situation. However, these two points should not be the only reference factors when analyzing salary cap levels to determine team commitment and team performance, and returns received. Because competitive sports contain too many uncertainties, injuries are one of them. During that season, the Golden State Warriors suffered a severe injury problem. One of the team's most important players, Klay Thompson, missed an entire season. In this situation, the team's performance will be significantly affected. Not only the Warriors but also the Brooklyn Nets faced a severe injury problem this season. Two of the team's most important players, Kyrie Irving and Kevin Durant, both missed extended periods of the season. If you look at it from the perspective of getting a high return on investment, neither team can live up to expectations. However, if you factor in uncertainties like injuries, the team's return cannot just be based on the amount of investment. Moreover, the return on the draft cannot just be based on the level of investment and record. The Brooklyn Nets have given up many picks in previous player trades, and from that point of view, it is hard to get a high return on their picks whether they invest much money this season or not. On the other hand, the Warriors are getting a high return on their draft picks due to their season ranking and previous picks acquired through trades. However, their investment is higher than that of the Brooklyn Nets, so the amount of investment and the return on draft picks cannot be put together in a comparison between these two teams. Not only are these two teams reviewing the NBA teams from different regions of the United States, but the Los Angeles Lakers, who are also from the Bay Area, are also very highly invested, but they also failed to get the return of good results, and they also failed to get a high return in the draft. However, the Atlanta Hawks are not at a very high level of investment, but they made it to the Eastern Conference Finals this season. Although they did not get a high return on their draft picks, they were able to satisfy the management and fans with their performance and results in the season. Another example is the Boston Celtics; the Celtics' investment in the season is not low, they showed a good game in the season, and they also achieved good results. They also did not get a very high draft pick, but that was, to some extent, determined by their results.
Table 4: T-test two-sample assuming unequal variances.
T-test | |
H0: μ(High input) = μ(Low input) | |
H1: μ(High input) ≠ μ(Low input) | |
t-Test: Two-Sample Assuming Unequal Variances | |
| High input |
Mean | 0.577866667 |
Variance | 0.013524981 |
Observations | 15 |
Hypothesized Mean Difference | 0 |
df | 28 |
t Stat | 3.665463304 |
P(T<=t) one-tail | 0.000511239 |
t Critical one-tail | 1.701130934 |
P(T<=t) two-tail | 0.001022477 |
t Critical two-tail | 2.048407142 |
This Table 4 shows Divide W/L% into two groups by setting the top 15 Active Cups to high input and the bottom 15 Active Cups to low input.The null hypothesis is that the mean values of high input and low input are the same, and the alternative hypothesis is that they are different. Data analysis was performed using Excel t-test: two-sample Assuming Construction Unequal Variances. In addition, according to the data analysis, the relationship between the level of a team's salary cap and the team's winning percentage. Referring to Table 6, a scatter plot is established between W/L% and ACTIVE CAP, and the correlation is 0.522, which shows a positive correlation. Divide W/L% into two groups by setting the top 15 Active Cups to high input and the bottom 15 Active Cups to low input. The null hypothesis is that the mean values of high input and low input are the same, and the alternative hypothesis is that they are different. Data analysis was performed using Excel t-test: two-sample Assuming Construction Unequal Variances. According to the analysis results, p-value = 0.001 is less than 0.05, so we reject H0. The conclusion is that the mean of W/L% for high input and low input is not the same. Therefore, when studying teams with high commitment and low returns, the level of commitment of the team does not directly determine whether the team can get the corresponding return in terms of performance.
There are outliers from the trend of high investment leading to better team records. In the 2021-22 season, the Memphis Grizzlies produced a very high outcome with relatively low investment compared to other teams in the league. The total investment of the Memphis Grizzlies is 1.16 hundred dollars, which is ranked as the 29th team in the league. However, the Memphis Grizzlies; team record is impressive, ranked second place in the west conference, able to be in the lead ahead of teams like Golden State Warriors, Denver Nuggets, and Los Angeles Clippers with very high investment in players. The great outcome of the Memphis Grizzlies could be explained by the salary structure of the team. The rising rookie Ja Morant is still in his first four-year rookie contract. The rookie contract limits the salary paid to rookie players since the rookie salary is set by the total amount of the salary cap, with each player getting wages based on a preset amount for their draft slot. Ja Morant's annual salary in 2021-22 is 9.6 million dollars, ranked as the 127th in the league, but the performance of Ja Morant is already an NBA top point guard. He is able to score 27.1 points per game, 9.8 assists per game, and 2 steals per game, which is all ranked in the top 6 stats in the 2021-22 playoffs. Dividing the annual salary of Ja Morant by the total salary of the team, we get 8.27 percent. This is a meager percentage compared to the proportion of the total salary of other key players in the team.
Morant is also the key that the team can get to the western conference semi-finals. To view the salary cap of the whole team, Memphis Grizzlies has very cheap players since the average age of the team is only 24.6 years old, which means a lot of the players are still on their rookie contract but already present an efficient performance on the court. This is the bonus period for rookies entering the team, and the bonus period would end when the rookie contracts of players finished. Thus, it can be seen that a well-drafted rookie could be very influential for the team; therefore, it explains why there are multiple teams in the league that decides to tank and earns a high rookie draft pick to rebuild their team. The Houston rocket is an example of such a team. Houston rocket starts to tank their team soon after they trade James Harden to the Brooklyn nets in the 2020 season. The return of 2 seasons of tanking their team is high-potential rookie Jalen Green, who is very likely to be the building foundation of the team. Now, the Houston Rocket is in its rookie bonus period because of the average young age of the team, and the outcome would be great if rookies like Jalen Green, Kevin Potter Jr, and Jabari Smith could create great chemistry with each other and brings a good team record.
Another team that receives a good team record with low investment is the Dallas Mavericks. Dallas Mavericks got to the western conference final in the playoffs. The total investment of 1.228 hundred million dollars is ranked 24th in the league. Low investment does not hinder the Dallas Mavericks from entering the playoffs with the fourth-team record in the western conference. This outcome is due to the same reason as the Memphis Grizzlies. Young rookie Luka Doncic is still in his rookie contract but has already shown the performance of a league superstar, able to carry the team into the western finals. Luka Doncic is receiving 10.17 million dollars in the 2021-2022 season, which definitely reduces the salary pressure on the Dallas Mavericks. Also, other than Luka Doncic, there are no star players on the team, but the team really has great chemistry to maximize the team record with the lowest investment. In most cases, teams with a high potential rookie post guard would have the most benefit in team records because point guards could conduct teammates to create a higher performance on the court for the whole team.
To verify the statement that teams who picked point guards in the top picks of the draft are more likely to reverse their team record to a high rank, we could see the team record in five years of the team that picked high draft point guards in the draft. This could be proven by the team records of the Memphis Grizzlies and New Orleans Pelicans. The New Orleans Pelicans drafted Zion Williamson as the first pick in the 2019 NBA draft, and the Memphis Grizzlies drafted Ja Morant as the second pick in the 2019 NBA draft. The effect of these two rookies on the team records of two teams varies greatly. Referring to Table 5, the New Orleans Pelicans' team record before drafting Zion is 33-49; the winning rate is 40.2. In the 2021-22 season, the team record of the Pelicans increased to 36-46; the winning rate is 43.9. Opposingly, the team record of the Memphis Grizzlies before drafting Ja Morant is 33-49; the winning rate is 40.2. In the 2021-22 season, the team record increased to 56-26, and the winning rate was 68.3. We can see the increase in the percentage of winning rate of the Pelicans from 2018-2021 is 2.7 percent, but the Grizzlies' winning rate increased by 28.1 percent. This result can be a result of the difference between these two rookies, as Zion is always treated as the spotlight player in the league, and the earnings outside the court even exceed the wage on the court. On the other hand, Ja Morant was not that popular compared to Zion when entering the league, so he worked harder and played more games than Zion to create a deeper influence on the court. Still, the comparison demonstrates team that drafted a point guard in the first-round pick would get a higher return in team records.
Table 5: Team record and winning rate of pelicans and grizzlies.
Pelicans | Grizzlies | |
Team record 2018-19 | 33-49 | 33-49 |
Winning rate (%) | 40.2 | 40.2 |
Team record 2019-20 | 30-42 | 34-39 |
Winning rate (%) | 41.7 | 46.6 |
Team record 2020-21 | 31-41 | 38-34 |
Winning rate (%) | 43.1 | 52.8 |
Team record 2021-22 | 36-46 | 56-26 |
Winning rate (%) | 43.9 | 68.3 |
Table 6: Team record of winning rate of the dallas mavericks.
Mavericks | |
Team record 2017-18 | 24-58 |
Winning rate (%) | 29.3 |
Team record 2018-19 | 33-49 |
Winning rate (%) | 40.2 |
Team record 2019-20 | 43-32 |
Winning rate (%) | 57.3 |
Team record 2020-21 | 42-30 |
Winning rate (%) | 58.3 |
Team record 2021-22 | 52-30 |
Winning rate (%) | 63.4 |
Team chemistry is a significant factor that influences the team record. This is considered one significant indicator because high investment can be wasted if the team chemistry of the team is bad. One of the indicators that impact team chemistry is the team's average age; teams with younger average age normally led to better team chemistry because rookies will unite with each other to improve their court performances to earn a better contract. On top of that, younger players can communicate better with each other than if there is an elder player that leads the team. The Miami heat is an example of this statement. Miami heat's leader is Jimmy Butler, but Udonis Haslem is the eldest player on the team, and he is also seniority of the team. These two leaders had conflicts at the end of the season in 2021-22 season, which affected the unity of the whole Miami Heat team because both players were seen as the leader of the team, Jimmy Butler had the best personal performance and leadership, and Haslem has the most sonority, so it is hard for other players to choose which of them should be the major leader of the team, therefore, leads to bad team chemistry(see Table 7).
Table 7: Comparison between the winning rate and team record of Lakers, Nets, Grizzlies and Mavericks.
Team Record | Winning rate | |
Memphis Grizzlies | 56-26 | 68% |
Dallas Mavericks | 52-39 | 63% |
Los Angeles Lakers | 33-49 | 40% |
Brooklyn Nets | 44-38 | 53% |
5. Conclusion
All teams in the league should clear out an annual goal before the start of the season, so there will be an effective use of salaries. There are mainly two goals for NBA teams, to compete for the championship or compete for a top-rank rookie. Two representatives are Los Angeles Lakers and Houston Rockets. This can be seen from the salary structure of these teams. Los Angeles Lakers has a big three consisting of three top-paid players in the league, Lebron James, Anthony Davis, and Russel Westbrook. Teams that form a Dual or a Big three consisting of top-paid players aim to compete for championships for that season. On the other hand, Houston Rockets have a cheap salary structure consisting of multiple rookies such as Jalen Green, Kevin Potter Jr, Alperen Sengun, and Josh Christopher. This is a result of long-term goals of competing for top-rank rookies for several precious seasons, a frequent draft of potential rookies form a cheap salary structure for the first three years; however, once these rookies finish their rookie contract and present a high performance on the court, then the salary structure would eventually rise, the team could face problems of high luxury taxes or have to trade rookies. A recommendation for such teams is teams have to transit their annual goal in a timely since the long-term goal of drafting high-ranked rookies would raise the salary structure, so, once the team has drafted 3-5 potential rookies, they have to transit their goal to getting to the playoffs or competing for championships to maximize their returns on drafting rookies. Houston Rocket should start to compete for the championship in the next serval seasons after they drafted another high-ranked rookie Jabri Smith Jr this year; as rookies in the teams are developing, the pressure of salary to the team increases, so it would be considered to start this goal now.
References
[1]. Gao, J. (2017). "Exploring the Impacts of Salary Allocation on Team Performance," Summer Program for Undergraduate Research (SPUR). Available at https://repository.upenn.edu/spur/23
[2]. NBA franchise. CNBC. Retrieved September 22, 2022, from https://www.cnbc.com/2022/04/28/nba-brooklyn-nets-dysfunction-weighs-on-business-prospects.html
[3]. Coon, Larry. “Table of Contents.” NBA Salary Cap FAQ, 30 June 2017, www.cbafaq.com/salarycap.htm#Q1.
[4]. ESPN Internet Ventures. (n.d.). 2021-22 NBA standings. ESPN. Retrieved September 21, 2022, from https://www.espn.com/nba/standings/_/season/2021/group/league
[5]. Wiley Online Library. (2022) Salary cap regulation in professional team sports. https://onlinelibrary.wiley.com/doi/10.1111/j.1465-7287.2011.00265.x
[6]. Taylor & Francis. (2012) Managing excellence in USA Major League Soccer: An analysis of the relationship between player performance and salary. https://www.tandfonline.com/doi/full/10.1080/13606719.2012.674389"
[7]. Keefer, Q. (2021). Sunk costs in the NBA: The salary cap and Free Agents - empirical economics. https://link.springer.com/article/10.1007/s00181-020-01996-z
[8]. Young, J. (2022). Brooklyn Nets' Playoff Flops Have Created Business Concerns for the Heavily Hyped NBA Franchise. https://www.nbcconnecticut.com/news/business/money-report/brooklyn-nets-playoff-flops-have-created-business-concerns-for-the-heavily-hyped-nba-franchise/2772465/
Cite this article
Wu,S.;Wang,B.;Wang,J. (2023). The Correlation between Salary Cap and Team Performance. Advances in Economics, Management and Political Sciences,20,167-175.
Data availability
The datasets used and/or analyzed during the current study will be available from the authors upon reasonable request.
Disclaimer/Publisher's Note
The statements, opinions and data contained in all publications are solely those of the individual author(s) and contributor(s) and not of EWA Publishing and/or the editor(s). EWA Publishing and/or the editor(s) disclaim responsibility for any injury to people or property resulting from any ideas, methods, instructions or products referred to in the content.
About volume
Volume title: Proceedings of the 2023 International Conference on Management Research and Economic Development
© 2024 by the author(s). Licensee EWA Publishing, Oxford, UK. This article is an open access article distributed under the terms and
conditions of the Creative Commons Attribution (CC BY) license. Authors who
publish this series agree to the following terms:
1. Authors retain copyright and grant the series right of first publication with the work simultaneously licensed under a Creative Commons
Attribution License that allows others to share the work with an acknowledgment of the work's authorship and initial publication in this
series.
2. Authors are able to enter into separate, additional contractual arrangements for the non-exclusive distribution of the series's published
version of the work (e.g., post it to an institutional repository or publish it in a book), with an acknowledgment of its initial
publication in this series.
3. Authors are permitted and encouraged to post their work online (e.g., in institutional repositories or on their website) prior to and
during the submission process, as it can lead to productive exchanges, as well as earlier and greater citation of published work (See
Open access policy for details).
References
[1]. Gao, J. (2017). "Exploring the Impacts of Salary Allocation on Team Performance," Summer Program for Undergraduate Research (SPUR). Available at https://repository.upenn.edu/spur/23
[2]. NBA franchise. CNBC. Retrieved September 22, 2022, from https://www.cnbc.com/2022/04/28/nba-brooklyn-nets-dysfunction-weighs-on-business-prospects.html
[3]. Coon, Larry. “Table of Contents.” NBA Salary Cap FAQ, 30 June 2017, www.cbafaq.com/salarycap.htm#Q1.
[4]. ESPN Internet Ventures. (n.d.). 2021-22 NBA standings. ESPN. Retrieved September 21, 2022, from https://www.espn.com/nba/standings/_/season/2021/group/league
[5]. Wiley Online Library. (2022) Salary cap regulation in professional team sports. https://onlinelibrary.wiley.com/doi/10.1111/j.1465-7287.2011.00265.x
[6]. Taylor & Francis. (2012) Managing excellence in USA Major League Soccer: An analysis of the relationship between player performance and salary. https://www.tandfonline.com/doi/full/10.1080/13606719.2012.674389"
[7]. Keefer, Q. (2021). Sunk costs in the NBA: The salary cap and Free Agents - empirical economics. https://link.springer.com/article/10.1007/s00181-020-01996-z
[8]. Young, J. (2022). Brooklyn Nets' Playoff Flops Have Created Business Concerns for the Heavily Hyped NBA Franchise. https://www.nbcconnecticut.com/news/business/money-report/brooklyn-nets-playoff-flops-have-created-business-concerns-for-the-heavily-hyped-nba-franchise/2772465/