


1. Introduction
As an important indicator of economic and financial activities of a country or region, stock price indexes are of great research importance. The relationship between macroeconomic factors, monetary policy and asset prices has always been the focus of attention in financial economics. The influence of stock price fluctuations is one of the directions that this paper would like to try to analyze and understand. For investors, the analysis of macroeconomic indicators is a very important part. This paper is divided into two parts, the first part is an exploratory data analysis of macro factors and the possibility of some of them having an impact on the HS300 index [1]. The second part is an attempt to learn how to use simply linear regression techniques using the case of individual stocks and the HS300. In addition, this thesis classifies the factors into macro environment indicators [2], such as GDP, CPI, industrial index, etc., and market valuation indicators, such as market average PE, PS, etc. HS300 is used as a benchmark to analyze the correlation between macro factors and HS300 volatility descriptively.
Brasoveanu L O points out that with the development of financial market and securities market, more and more people pay attention to the price movement of stocks and get the factors affecting the movement of stock prices by analyzing the impact of macro and micro economic environment on stock prices [3]. Evangelia Papapetrou argues that these factors include not only the current business situation of the company, but also the trends of the stock industry and the macro economy as a whole [4]. In addition, Li, H. analyses different listed robotics companies and finds that the share of R&D expenses, the growth of GWM and the growth of marketing expenses in the robotics industry have different degrees of influence on stock prices [5]. Zhou, X explores the impact of terms of trade, oil prices, interest rates, money supply and industrial production indices on stock delivery movements through a study of stock markets and firms in the US, Japan and China [6]. Bochen Li takes two emerging Internet companies, Alibaba and Jingdong, as the subjects of his study (using linear regression methods to analyze their stock movements), and then examines the factors influencing the stock market in this industry and provides investors with investment intentions to reduce loss expectation losses [7].
2. Data Profile
Because I have a traditional business background and little understanding of the deep knowledge structure related to statistical mathematics, this paper uses some basic graphs to depict the data as follows.
Data distribution graph: it is to view the data distribution, mainly to determine the normality, skewness kurtosis of the data.
Scatter plot: to view the relationship between data and data; between data and HS300. Mainly looking for linear relationships, and thinking about how to transform non-linear relationships
Heat distribution diagram: view the correlation between data and look for macro factors with strong correlation with HS300
This report’s dataset is obtained from ricequant's stock financial data; Wind's EDB macro database, and information from relevant financial websites. Because sectoral data are lagged, daily data for some indicators are taken with a one-day lag and monthly data are taken with a two-month lag. Quarterly data are only available for GDP and unemployment rate, which are taken with a one-quarter lag. In this paper, we analyze daily data with a one-day lag and use the previous day's data to forecast; monthly data with a one-month lag and use the previous month's end data to forecast.
The types of analysis graphs used in this paper include:
Table 1: Data dictionary.
Column Name | Column Meaning | Explanation | Attributes |
circulating_market_cap | Market capitalization in circulation (billion yuan) | Outstanding market value refers to the total value of shares outstanding at a given time derived by multiplying the number of shares tradable at that time by the prevailing share price. | Circulation |
turnover_ratio (%) | It refers to the frequency of stock changing hands in the market within a certain period of time, and is one of the indicators of the strength of stock liquidity. | Circulation | |
Table 1:(continued). | |||
pe_ratio | PE/TTM | Market price per share is a multiple of earnings per share, reflecting the price investors are willing to pay for each dollar of net profit, and is used to estimate the reward and risk of investing in a stock | Valuation |
pb_ratio | PB | Ratio of share price per share to net assets per share | Valuation |
ps_ratio | PS/ TTM | The smaller the price-to-sales ratio, the higher the value of the investment is usually considered. | Valuation |
ppi | Production material price index | Price | |
qm | Extractive industry price index | Price | |
rmi | Raw Material Industrial Price Index | Price | |
pi | Process Industry Price Index | Price | |
cg | Price index of living materials | Price | |
GDP_PRIMARY | Gross Domestic Product - Primary Sector | Price | |
GDP_SECONDARY | Gross Domestic Product-Secondary Industry | Price | |
GDP_TERTIARY | Gross Domestic Product-Tertiary Sector | Price | |
GDPYOY | GDP year-on-year | Price Growth | |
GDP_PRIMARYYOY | GDP year-on-year - Primary sector | Price Growth | |
GDP_SECONDARYYOY | GDP year-on-year - Secondary sector | Price Growth | |
EXPECTATIONIDX | Consumer expectations index | Price | |
Table 1:(continued). | |||
SATISFACTIONIDX | Consumer Satisfaction Index | Price | |
CONFIDENCEIDX | Consumer Confidence Index | Price | |
BOOMIDX | Business Prosperity Index | Price | |
CONFIDENCEIDX | Entrepreneur Confidence Index | Price | |
PMI | Manufacturing Purchasing Managers' Index | Price | |
HOUSEFUND | Personal Housing Provident Fund Deposit - Current Year Contribution | Price | |
LOAN6MONTH | Short-term loans - up to and including six months | Price | |
HOUSEFUND5YEAR | Personal Housing Provident Fund loans - up to and including five years | Price | |
INDIVIDUALHOUSE6MONTH | Commercial banks' captive personal housing loans - up to and including six months | Price | |
3. Exploratory Data Analysis (EDA)
First, I think of EDA methods as not just a set of techniques or functions or graphs, but as an attitude/philosophy about how to do data analysis. EDA is a data analysis method that infers the usual assumptions about what models the data follow by allowing the data itself to reveal its underlying structure and model in a more direct way [8]. Besides, EDA is not just a collection of techniques., but it is a philosophy about how we dissect EDA is a philosophy about how we dissect datasets; what we are looking for; what they look like; and how we can better explain their intrinsic connections. It is true that EDA makes extensive use of a collection of techniques we call "statistical graphics," but it is not exactly the same as statistical graphics themselves(see Table 1).
Most EDA techniques are inherently graphical, with some quantitative techniques. The reason for this heavy reliance on graphs is that EDA's primary role is essentially open to exploration, and graphs give analysts an unparalleled ability to explore, to entice data to reveal its structural secrets, and to be ready to gain some new, often unexpected, insight into the data. Combined with the natural pattern recognition capabilities we all possess graphs certainly provide an unparalleled ability to do just that.
Thus, the first step of doing data analysis is to find out the missing data, distortion, and misrepresentation; after that, the integrity of data usage is ensured by cleaning and filling the data. Last, the real relationship between the data has to be found so that a suitable model can be selected. The following steps are the data analysis done in this project.
3.1. View Missing Values
The data processing starts with the missing data, which are listed below in Table 2.
Table 2: Dictionary of missing values.
Missing Data | Quantity |
dates | 0 |
open | 61 |
close | 61 |
PB | 1 |
leading_idx | 34 |
retail_sin | 241 |
fixed_assets_investment | 259 |
ppi | 112 |
rmi | 112 |
pi | 112 |
cg | 112 |
food | 133 |
clothing | 112 |
roeu | 112 |
dcg | 112 |
retail_sin_rate | 366 |
fixed_assets_investment_rate | 259 |
CPI_rate | 34 |
GDP_rate | 51 |
dtype: | int64 |
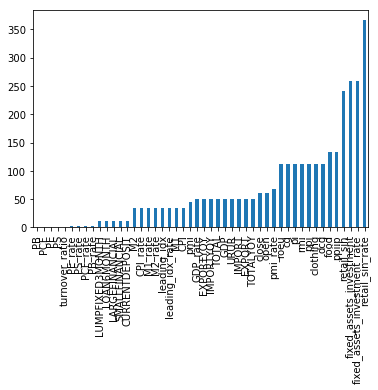
Figure 1: Stock factor categories.
From the Figure 1 shows that the total data volume is 3150, the fixed investment data ('fixed_assets_investment') and retail sales data ('retain_sin') are the most missing. The industrial ex-factory indexes ('ppi', 'food', 'clothing') also have missing values for almost 4 months or so, while other data such as ( pmi, import) are missing for less than two months. By studying the macro database I found that: fixed investment data ('fixed_assets_investment') data do not include all January data; retail sales data ('retain_sin') do not include Data for January and April after 2011, which account for the bulk of the missing values. The industrial ex-factory index is occasionally missing data for one or two months in the last 10 years, and there are some missing data. In addition, looking at the database, I also found that there are many cases of NaN in the Ex-Industrial Index database, which should be noted in the data cleaning. Finally, the missing data of pmi, import and so on are caused by the current time of this month and the previous month data are not entered; the missing data of open and close are caused by the missing data of open and close of CSI 300 in January-April 2005.
In terms of missing data treatment, for the missing issue of opening and closing prices in January-April 2015, this thesis removes this data and does not count it in the data sample; for 'fixed_assets_investment', 'retain_sin ' and other data in the industrial ex-factory index PPI library, this thesis replaces them with data from the previous month; finally December and November 2017 are not counted in the data sample analysis to deal with the missing values of pmi, import and other data.
3.2. Distribution of Data Values
I need to analyze the distribution of HS300 price data to know the overall situation of the data, the distribution chart is as follows
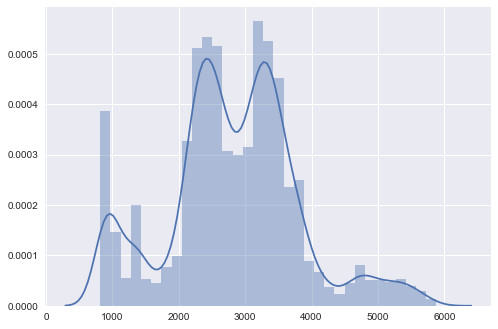
Figure 2: HS300 data distribution.
The Figure 2 shows the skewness and kurtosis of the price distribution are calculated as
kewness: close 0.175869
kurtosis: close 0.341954
The skewness of 0.175869 indicates that the prices are slightly skewed to the right; the kurtosis of 0.341954 indicates that the kurtosis is not high. Because the skewness of the normal distribution is 0 and the kurtosis is 3, while the kurtosis of the stock price of HS300 differs greatly from the normal distribution, it can be judged that the stock price of HS300 does not obey the normal distribution. The stock index probability distribution is not on the red mean, the highs are skewed high and the lows are skewed low. Next, the distribution of the daily growth of HS300 is analyzed as shown below
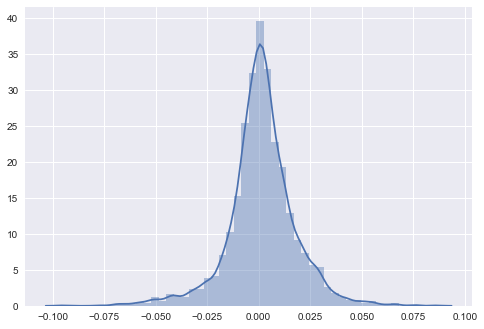
Figure 3: HS300 daily price change distribution.
The Figure 3 illustrates the price changes (Change_rate) skewness kurtosis are-0.278169 and 4.178902. The skewness is -0.278169, which means that the price is slightly to the left and the center of gravity is to the right; the mean value is around 0; the kurtosis is 4.178902, which is close to the normal distribution. It is not possible to have a linear correlation with the stock price.
3.3. Single Factor Analysis
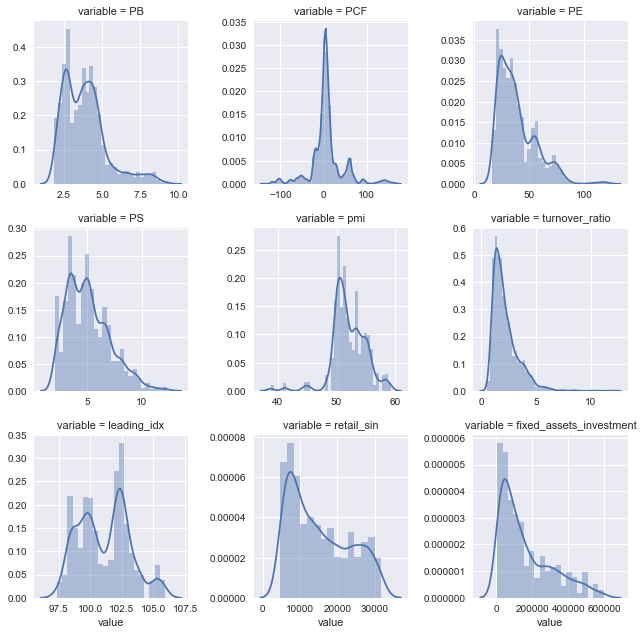
Figure 4: Single-factor distribution.
The Figure 4 shows different single-factor analysis and data distribution.
PB: PB is right biased, the center of gravity is on the left, and the kurtosis is also slightly higher, so it can be log transformed to make it conform to unbounded Johnson distribution, and it can also be standardized.
PCF: PCF almost no skewness, kurtosis is very high, not suitable for standardization operation, but can reduce its kurtosis, but because the traditional method of reducing kurtosis log is not good for the case with negative numbers, you can first pan with the minimum value, and then log
PE: skewness is positive, the magnitude is not large; kurtosis is high, but not particularly high, you can log processing to adjust the skewness
PS: the skewness is positive, the magnitude is not large, the kurtosis is similar to the normal distribution, no need to deal with
pmi: higher kurtosis, can do log processing, less need for special processing
turnover ratio: The extreme value of 3% for each of the maximum and minimum is deleted when calculating the market mean. turnover_ratio distribution skewness is positive, the magnitude is large, can be log processed
Macroeconomic index (leading index) leading_idx: does not obey normal distribution, but its distribution is extremely similar to HS300 stock price distribution, which may have a strong linear relationship.
Total retail sales of social consumer goods retail_sin: the skewness is positive, the magnitude is not big, the kurtosis is not big, can't see what special treatment is needed.
Fixed asset investment completion (cumulative year-on-year): positive skewness, high kurtosis, not suitable for log to reduce skewness due to a large number of values around 0. This factor is not meaningful to use directly, and I would like to try to use proportional change as a substitute.
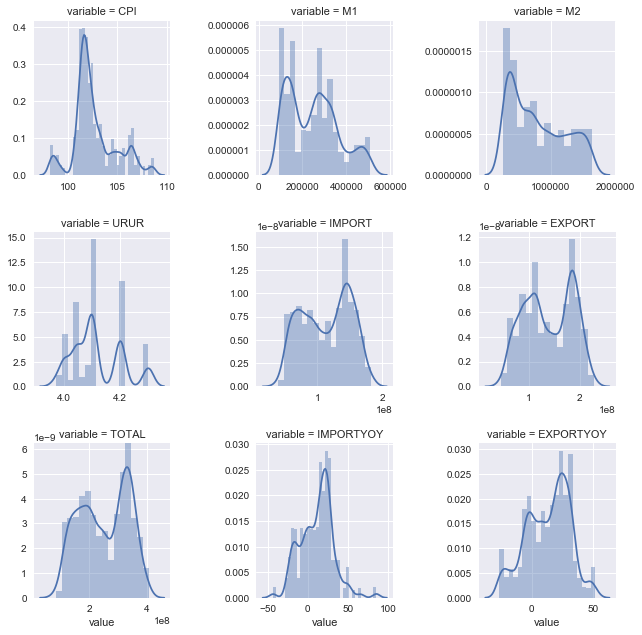
Figure 5: single-factor distribution.
CPI: right skewed skewness, high kurtosis, suitable for log processing
M1: It is recommended to represent the data with change proportion
M2: Suggest to use the change proportion to represent the data
Unemployment rate URUR: The data comes from Wind database, the data is obviously not in line with common sense, according to the unemployment rate of the United States or other countries, the unemployment rate should fluctuate around 3%-8% is more normal, during the economic crisis may exceed 10%, a major economic crisis such as the 1932 economic crisis may be more than 20%. 2005 to 2017 12 years there was a major financial crisis. The time span is also very large, but the unemployment rate fluctuates but not more than five thousandths, the data distortion is serious(see Figure 5).
Total imports IMPORT: not normally distributed, but similar to the stock price distribution, probably linearly related to the stock price
Total exports EXPORT: the same as above, and the import correlation may be very large
Total import and export TOTAL: same as above
Import year-on-year IMPORTYOY: probably right skewed, with high kurtosis, can do log processing.
Exports year-on-year EXPORTYOY: left skewed, higher kurtosis, can do log processing or square processing. Compared with imports, there are few values higher than 50, which means that the increase is steady and there is no sudden big leap.
3.4. Heat Map
Heat map, a statistical chart that displays data by coloring blocks of color. When plotting, rules for color mapping need to be specified. For example, larger values are represented by darker colors and smaller values by lighter colors; larger values are represented by warmer colors and smaller values by cooler colors, etc. The advantage of heat maps is that they are "space efficient" and can accommodate relatively large amounts of data. Heat maps are not only useful for discovering relationships between data and finding extreme values, but they are also often used to paint a picture of the data as a whole and facilitate comparisons between data sets. Thus, the 30 most important factors for stock prices were selected because log and sqrt were used, and there were duplicate values in them, which actually took about 10 important variables. The group also tried to organize the data by standardized methods, but the results were poor on the factors with high importance, so these factors were deleted.
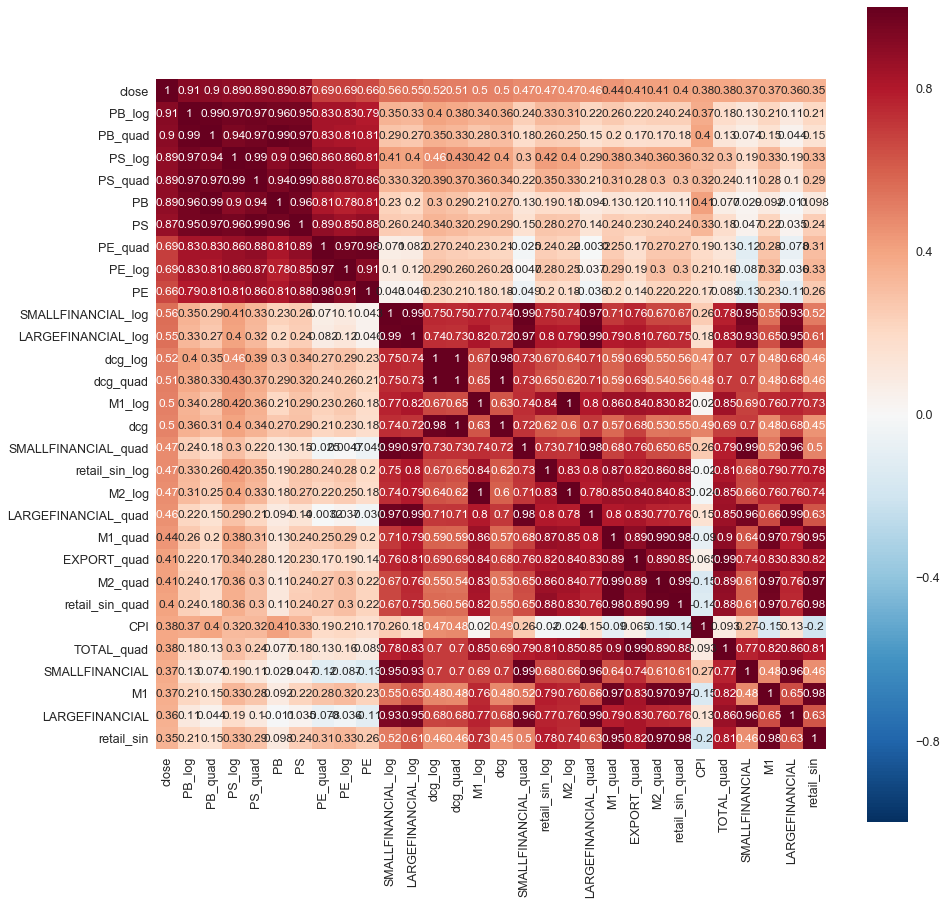
Figure 6: Stock factors correlation analysis.
According to the Figure 6 heat map it can be seen that the financial data of the company are more correlated with each other, other macro data are more correlated with each other and less correlated with both parts of the data. It is worth noting that CPI has a low correlation with exports, M1 and M2 macro data indicators, and even has a negative linear relationship of 20% with “retail_sin”. However, CPI has a high positive correlation with consumer “dcg”(durables price index).
4. Linear Regression Analysis
The HS300 index is jointly compiled by Shanghai Stock Exchange and Shenzhen Stock Exchange, and the sample covers about 60% of the market capitalization of Shanghai and Shenzhen markets, which has good market representativeness. Therefore, in addition to the exploratory analysis of HS300 related factors, this paper also investigates whether there is a linear relationship between the stock prices of individual stocks and HS300, and tries to conduct correlation analysis based on the OLS regressions learned in the course.
4.1. Data Describe
Table 3: Data descriptive statistics.
Count | 146.000000 | Count | 146.000000 |
Mean | 3864.704901 | Mean | 78.942740 |
Std | 548.784075 | Std | 16.382054 |
Min | 3025.692000 | Min | 48.280000 |
25% | 3527.016550 | 25% | 70.195000 |
50% | 3761.664300 | 50% | 78.475000 |
75% | 4054.033450 | 75% | 85.815000 |
Max | 5353.751000 | Max | 128.000000 |
Name: | close, dtype: float64 | Name: | close, dtype: float64 |
The Table 3 simple statistics of the closing price of HS300 for each trading day in the statistical interval, are Figure 7 shown below. There are 146 HS300 share price data, the average value of the share price is 3864.70, the minimum value is 3025.69 and the maximum value is 5353.75. And the simple statistics of the closing price of Robotics for each trading day are shown below. There are 146 share price data, the average value of the share price is 78.942740, the minimum value is 48.280000, and the maximum value is 128.0
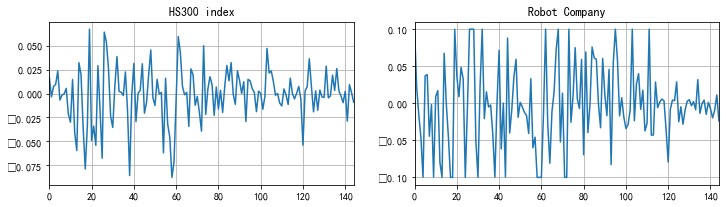
Figure 7: HS300 index&robot company volatility distribution.
We can observe that Figure 7 shows the stock price volatility of HS300 and Robotics, as shown above, has a relatively consistent trend between the stock price volatility of HS300 and Robotics, while Robotics has a more volatile stock price compared to HS300.
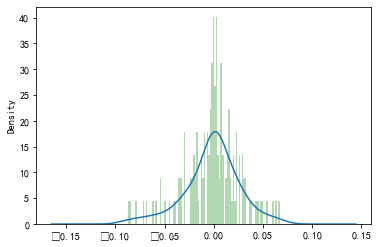
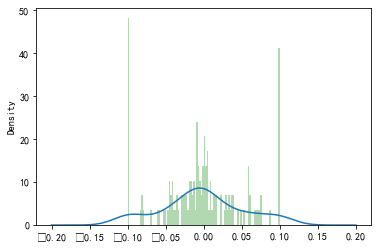
Figure 8: HS300 index&robot company daily returns distribution.
Drawing the histogram and density plot of daily returns of HS300 and Robotics, as Figure 8 shown above, it can be found that, in general, the daily returns of HS300 and Robotics obey normal distribution. Comparatively, the daily return of robotics companies is lower than that of HS300.
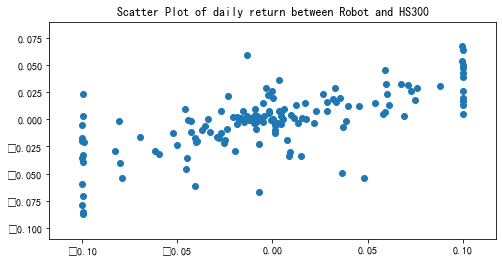
Figure 9: HS300 index&robot company correlation distribution.
The Figure 9 scatter plot shows that there may be a linear positive correlation between HS300 and Robotics' stock price.
4.2. Regression Results
Linear regression is a data analysis technique that predicts the value of an unknown data by using another relevant known data value [9]. It mathematically models the unknown or dependent variable and the known or independent variables as linear equations. Essentially, a simple linear regression technique attempts to plot a line graph between two data variables x and y. As the independent variable, x is plotted along the horizontal axis. The independent variable is also called the explanatory or predictive variable. The dependent variable y is plotted on the vertical axis. The y value can also be indexed as a response or predictor variable.
Since my own background is in Business, I am familiar with the framework of investment reasoning and value investing, not really good at math or data engineering oriented content. After several weeks of lectures, I tried to use a simple regression model to analyze the correlation between the HS300 and individual stock relationships.
Table 4: OLS regression results.
Dep.Variable: | Robot Company | R-squared: | 0.457 | ||||||
Model: | OLS | Adj.R-squared: | 0.453 | ||||||
Methods: | Least Squares | F-statistic: | 120.4 | ||||||
Date: | Fri,25 Nov 2022 | Prob(F-statistic): | 1.07e-20 | ||||||
Time: | 11:25:55 | Log-Likelihood: | 262.41 | ||||||
No.Observations: | 145 | AIC: | -520.8 | ||||||
Df Residuals: | 143 | BIC: | -514.9 | ||||||
Df Model: | 1 | ||||||||
Covariance Type: | nonrobust | ||||||||
Coef | Std err | T | P>|t| | [0.025 | 0.975] | ||||
HS300 | 1.3137 | 0.120 | 10.971 | 0.000 | 1.077 | 1.550 | |||
Intercept | 0.0002 | 0.003 | 0.069 | 0.945 | -0.006 | 0.007 | |||
Omnibus: | 4.637 | Durbin-Waston: | 1.952 | ||||||
Prob(Omnibus): | 0.098 | Jarque-Bera(JB): | 6.260 | ||||||
SKEW: | -0.043 | Prob(JB): | 0.0437 | ||||||
Kurtosis: | 4.014 | Cond.No. | 36.2 | ||||||
The Table 4 least squares regression results show that there is a significant positive relationship between the daily stock returns of robotics companies and the HS300 daily returns. The decidable coefficient is 0.457, indicating that the HS300 daily return variable has a strong explanatory power on the robotics daily return variable and the model fits well. p-values for both the F-statistic and Omnibus statistic are close to 0, and the effect of the independent variable is significant. p-values for the t-statistic are close to 0, indicating that the HS300 variable is significant. The coefficient of the independent variable is 1.3137, indicating that the daily return of the stock of Robotics is more volatile than HS300 and that the individual stock is riskier and has greater potential for gains and losses. The average HS300 daily return fluctuates by 1% and the individual stock daily return fluctuates by 1.3137 %. the value of the Durbin-Waston test is 1.952, indicating that there is no serial correlation in the return data.
5. Conclusion
With the development of globalization of capital market, the importance of Chinese securities market in the international capital market has become more and more prominent. Pham, T. A think the Asian capital market is developing at a rapid pace and that the stock market is a very important part of the capital market When different price indices (HS300) are designed, investors will have more underlying objects to study financial market liquidity, systemic risk and stock price volatility [10]. The research in this paper includes an exploratory analysis of macroeconomic indicators and finds that some factors such as: PB, PE, pmi CPI retail sales of social consumer goods, turnover ratio, etc. have a correlation effect on the HS300 index. In addition, this paper does a simple linear regression analysis on the share price data of individual stocks (robotics companies) and the closing price data of HS300, and the results have a linear relationship.
References
[1]. Bu H, Pi L. Does investor sentiment predict stock returns? The evidence from Chinese stock market[J]. Journal of Systems Science and Complexity, 2014, 27(1): 130-143.
[2]. Brown D H, MacBean A. Introduction: China’s macro environment and enterprise challenges[M]//Challenges for China's Development. Routledge, 2005: 17-27.
[3]. Brasoveanu L O, Dragota V, Catarama D, et al. Correlations between capital market development and economic growth: The case of Romania[J]. Journal of applied quantitative methods, 2008, 3(1): 64-75.
[4]. Hondroyiannis G, Papapetrou E. Macroeconomic influences on the stock market[J]. Journal of economics and finance, 2001, 25(1): 33-49.
[5]. Cheng H, Jia R, Li D, et al. The rise of robots in China[J]. Journal of Economic Perspectives, 2019, 33(2): 71-88.
[6]. Wong A, Zhou X. Development of financial market and economic growth: Review of Hong Kong, China, Japan, the United States and the United Kingdom[J]. International Journal of Economics and Finance, 2011, 3(2): 111-115.
[7]. Zhang L, Fu S, Li B. Research on stock price forecast based on news sentiment analysis—A case study of alibaba[C]//International Conference on Computational Science. Springer, Cham, 2018: 429-442.
[8]. Morgenthaler S. Exploratory data analysis[J]. Wiley Interdisciplinary Reviews: Computational Statistics, 2009, 1(1): 33-44.
[9]. Montgomery D C, Peck E A, Vining G G. Introduction to linear regression analysis[M]. John Wiley & Sons, 2021.
[10]. Huy D T N, Loan B T T, Pham T A. Impact of selected factors on stock price: a case study of Vietcombank in Vietnam[J]. Entrepreneurship and Sustainability Issues, 2020, 7(4): 2715.
Cite this article
Xiang,H. (2023). Analyzing Factors of Stock Price Index and Using Simple Linear Regression Techniques. Advances in Economics, Management and Political Sciences,20,268-281.
Data availability
The datasets used and/or analyzed during the current study will be available from the authors upon reasonable request.
Disclaimer/Publisher's Note
The statements, opinions and data contained in all publications are solely those of the individual author(s) and contributor(s) and not of EWA Publishing and/or the editor(s). EWA Publishing and/or the editor(s) disclaim responsibility for any injury to people or property resulting from any ideas, methods, instructions or products referred to in the content.
About volume
Volume title: Proceedings of the 2023 International Conference on Management Research and Economic Development
© 2024 by the author(s). Licensee EWA Publishing, Oxford, UK. This article is an open access article distributed under the terms and
conditions of the Creative Commons Attribution (CC BY) license. Authors who
publish this series agree to the following terms:
1. Authors retain copyright and grant the series right of first publication with the work simultaneously licensed under a Creative Commons
Attribution License that allows others to share the work with an acknowledgment of the work's authorship and initial publication in this
series.
2. Authors are able to enter into separate, additional contractual arrangements for the non-exclusive distribution of the series's published
version of the work (e.g., post it to an institutional repository or publish it in a book), with an acknowledgment of its initial
publication in this series.
3. Authors are permitted and encouraged to post their work online (e.g., in institutional repositories or on their website) prior to and
during the submission process, as it can lead to productive exchanges, as well as earlier and greater citation of published work (See
Open access policy for details).
References
[1]. Bu H, Pi L. Does investor sentiment predict stock returns? The evidence from Chinese stock market[J]. Journal of Systems Science and Complexity, 2014, 27(1): 130-143.
[2]. Brown D H, MacBean A. Introduction: China’s macro environment and enterprise challenges[M]//Challenges for China's Development. Routledge, 2005: 17-27.
[3]. Brasoveanu L O, Dragota V, Catarama D, et al. Correlations between capital market development and economic growth: The case of Romania[J]. Journal of applied quantitative methods, 2008, 3(1): 64-75.
[4]. Hondroyiannis G, Papapetrou E. Macroeconomic influences on the stock market[J]. Journal of economics and finance, 2001, 25(1): 33-49.
[5]. Cheng H, Jia R, Li D, et al. The rise of robots in China[J]. Journal of Economic Perspectives, 2019, 33(2): 71-88.
[6]. Wong A, Zhou X. Development of financial market and economic growth: Review of Hong Kong, China, Japan, the United States and the United Kingdom[J]. International Journal of Economics and Finance, 2011, 3(2): 111-115.
[7]. Zhang L, Fu S, Li B. Research on stock price forecast based on news sentiment analysis—A case study of alibaba[C]//International Conference on Computational Science. Springer, Cham, 2018: 429-442.
[8]. Morgenthaler S. Exploratory data analysis[J]. Wiley Interdisciplinary Reviews: Computational Statistics, 2009, 1(1): 33-44.
[9]. Montgomery D C, Peck E A, Vining G G. Introduction to linear regression analysis[M]. John Wiley & Sons, 2021.
[10]. Huy D T N, Loan B T T, Pham T A. Impact of selected factors on stock price: a case study of Vietcombank in Vietnam[J]. Entrepreneurship and Sustainability Issues, 2020, 7(4): 2715.