


1. Introduction
Our research focuses on how to identify companies that report financial fraud and delve into the reasons why company managers mislead investors about financial fraud and find mechanisms to prevent such occurrences. This will help investors to understand the status of companies more transparently, auditors to avoid more risks, and stock market mechanisms to improve. We will present our research in three main areas, the topic of our research, the detailed process of data collection and calculation, and the analysis of our results.
As for the topic of our research, we focus on how to distinguish financial fraud by company managers and analyze the reasons behind such measures taken by company managers. Ultimately, we will find the best solution to improve the mechanism that can prevent such misleading behavior of investors.
In terms of the reason for our research, it will bring more benefits to investors, auditors, and the stock market. When we know how to determine whether a company is reporting fraudulently or not, it will greatly optimize the flow of investors' money, and it will make it easier for the SEC to better manage the investigation of each company and make the stock market system better. In today's world of increasingly serious and widespread corporate financial fraud, it is worthwhile to improve the response mechanism and protect a transparent and good market atmosphere.
Referring to the methodology of our study, we will use the F-SCORE and M-SCORE methods developed by our predecessors to conduct the study. By comparing the F-SCORE and M-SCORE of companies with financial fraud and companies with good operations without financial fraud, we will observe the difference between the two types of companies and summarize the characteristics of companies with financial fraud so that investors can identify them.
2. Related Literature
2.1. Fraud Triangle
For decades, the fraud triangle has been the quintessential diagram to help us understand and analyze fraud. The concept proposes that there are three components that together lead to fraudulent behavior. They are: the perceived financial need (motivation/pressure), the perceived opportunity to commit fraud, and the rationalization for committing fraud [1,2].
Fraud is a deliberate act of deception committed by an employee or organization for personal gain. In other words, fraud is an act of deception used to gain an advantage or generate illegal profits. Moreover, this illegal act benefits the perpetrator and causes harm to other parties. For example, an employee stealing cash from a company register is fraud. The employee will benefit from the additional cash lost by the company.
The "opportunity" element of the fraud triangle refers to the circumstances that allow fraud to occur. Without it, fraud could not occur. It is the only component of the fraud triangle over which the company has significant control, or in some cases, complete control. Internal controls are the processes and procedures implemented to ensure the integrity of accounting and financial information. Weak internal controls, such as unclear segregation of duties, lack of oversight, and poor process documentation, create opportunities for fraud. Accounting policies refer to the way financial statement items are recorded. Improper accounting policies may provide opportunities for employees to manipulate numbers [1,2].
Motivation, also known as pressure, refers to an employee's mindset to engage in fraudulent behavior. The following are typical examples of pressure or motivation. The financial metrics typically used to evaluate employee performance are revenue and net income. Bonuses based on financial metrics put pressure on employees to achieve their goals, which may lead them to commit fraud in order to achieve their goals. The need to meet or exceed the expectations of investors and analysts in order to ensure that the stock price maintains or rises can also put pressure on fraudulent behavior. Personal motivations may include a desire to make more money, a need to pay personal bills, a gambling addiction, and so on.
The rationalization of fraud is the most difficult situation to observe because it occurs in the perpetrator's mind. Rationalization involves inventing a moral excuse to justify fraud. Many fraudsters believe they are honest, ordinary people, not criminals, so they must come up with reasons that make committing fraud consistent with their personal moral code.
2.2. M-score/F-score
In the paper ‘’Fraud Detection and Expected Returns’’ written by Messod D. Beneish, Charles M.C. Lee, and D. Craig Nichols, the author examines the company's financial statements in terms of receivables, sales earnings, other assets, and accounting profits through eight variables, and earnings can be examined through multiple variables. The larger the M-SCORE, the more likely it is that the company has falsified its financial statements [3].
By comparing the M-SCOREs of nearly a dozen Chinese companies listed in the U.S. for different years, they have found that the M-SCOREs of companies in the same industry with normal financials and companies identified by the SEC as having falsified financials are not only different from the M-SCOREs of the company in other years, but also different from the M-SCOREs of different companies in the same industry in the same year.
The inventors of M-SCORE found that it was difficult to find reliable financial statements in the market, and from a large number of previous cases of companies, they derived the M-SCORE consisting of these 8 variables, which can be used to predict the prospects of a company and the authenticity of its financial statements. Their team also used this method to test 71% of the cases of financial fraud, and also to predict some famous cases of financial fraud that occurred later.
They conducted three sets of analyses. First, they tested the ability of Accruals and M-SCORE combined to predict the future returns of companies and found that M-SCORE played a significant role in predicting this in absolute terms. Additionally, they analyzed each component of the M-SCORE model to distinguish fraudulent companies. They also found that M-SCORE could easily distinguish promising companies from those that were vulnerable to bankruptcy, and identified the variables that played the most important role in M-SCORE. Besides, they found that Beneish's model was a good predictor of company Accruals and that generally, companies with high M-SCORE and increasing revenue Accruals were prone to disappear in the following year, while companies with high M-SCORE and decreasing revenue Accruals were more common to continue to see their presence in the following year. The exact opposite is true for M-SCORE companies.
In the paper “Predicting Material Accounting Misstatements”, Patricia M. Dechow, Weili Ge, Chad R. Lawson, and Richard G. Sloan dedicated to conducting research developing a predictive misstatement model to calculate the signal of surplus management or false financial statements, or the F score, from the SEC's database of all Accounting and Auditing Enforcement Releases (AAERs) issued during investigations of companies involved in misconduct since 1982. Their investigation identified at least 676 companies that misstated a quarterly or annual financial statement [4].
Their study focused on financial statement variables that are easily measured in financial statements, such as accrual quality, financial performance, no financial measures, off-balance sheet, and market-based measures for identifying misstatements. The authors also found that in addition to financial facilities, a non-financial facility, an abnormal reduction in the number of employees, was useful in detecting false statements, such as layoffs that directly improve short-term earnings performance by reducing payroll expenses.
Moreover, they also examine the current growth expectations of the stock market valuation of misstated companies and find that the P/E and P/N ratios of misstated companies are high, suggesting that investors are optimistic about these companies, while misstated companies have had unusually strong stock returns in previous years, suggesting that they want to avoid disappointing investors [4-5].
F Value can help us help our study to better predict financial fraud aspects, but at the same time, F Score has disadvantages because the F Score model originally refers to U.S. companies listed in the U.S., not Chinese companies. Therefore, there is uncertainty about whether it can be used for US-listed Chinese companies.
3. F-score
The F-Score was developed by researchers who reviewed 2,190 accounting and auditing enforcement pronouncements issued by the Securities and Exchange Commission (SEC) between 1982 and 2005 and found 676 companies alleged to have misreported quarterly or annual financial statements.
The F-score (F stands for "Fudging") evaluates a company on five dimensions -- accrual quality, financial performance, non-financial measures, off-balance sheet activities and market-based incentives -- and assigns a numerical value to indicate whether further action is warranted investigation. It's a straightforward measure: Enter data from a company's public financial statements, and an algorithm calculates a number. The average company score is 1. The higher the number, the higher the chance of accounting misstatements.
First, the method to calculate F score is to compute the predicted value first. The formula of predicted value is as follows: "Predicted value = -7.893 + 0.790*rsst_acc + 2.518*ch_rec + 1.191*ch_inv + 1.979*soft_assets + 0.171*ch_cs – 0.932*ch_roa + 1.029*issue"
Then convert the predicted value to the probability of manipulation using the logistic function
= ePredicted value/(1 + ePredicted value) where e = 2.71828183
and finally if F > 1 indicates “above normal risk” and F > 2.45 indicates “high risk”
Of course, there are two sides to every coin, and the same goes for the F-score. One of the advantages of the F score is that it is very powerful in predicting financial fraud, but at the same time, the F score also has disadvantages, as the F score model originally refers to U.S. companies listed in the U.S., not Chinese companies. So there is uncertainty about whether it can be used in US-listed Chinese companies.
At last, a higher-than-average f-score is not evidence of misconduct; it is simply a reason to be suspicious. Of course, some companies have received high scores without any errors. But the F-Score can be used as a first step screening tool to detect possible misrepresentations."
4. M-score
Benish's M-Score is a mathematical model that uses eight financial ratios weighted by coefficients to determine whether a company is manipulating its profits. The eight coefficients are DSRI, GMI, AQI, SQI, DEPI, SGAI, LVGI and TATA. Benish speculates that companies with high sales growth, deteriorating gross margins, rising operating expenses and rising leverage have an incentive to manipulate profits. They are likely to manipulate profits by accelerating sales recognition, increasing cost deferrals, raising accruals and reducing depreciation.
M-score = -4.84 + 0.92 * DSRI + 0.528 * GMI + 0.404 * AQI + 0.892 * SGI + 0.115 * DEPI - 0.172 * SGAI + 4,679 * TATA - 0.327 * LVGI
According to the above formula, M score can be obtained if M-Score is less than - 2.22, which indicates that the company did not manipulate earnings during the period. On the contrary, if the M value is greater than 2.22. This is a signal that the company tends to become a manipulator.
4.1. Advantages of M Score
When calculating the degree of earnings manipulation, it helps to understand the extent to which the company's management manipulates its earnings.
1. Objectivity: The M-Score uses a data-driven, quantitative approach, which minimizes the influence of personal biases or subjectivities in assessing the risk of financial fraud.
2. Comprehensive evaluation: The M-Score considers a variety of relevant financial measures and ratios, including companies' profitability, liquidity, and asset quality. By analyzing these measures together, it provides a more accurate picture of potential fraud risk.
3. Early detection: The M-Score can help investors, regulators, and auditors to detect potentially fraudulent activities at an early stage. This can facilitate prompt interventions to minimize financial losses or damage to the involved parties.
4.2. Disadvantages of M Score
If the company's management has ideas about the calculation of Beneish M-Score model, they will manipulate the balance sheet entries used to calculate M-Score. Therefore, in this case, the purpose of M-Score is still not realized.
5. Methods & Data Collection
To verify that these two models are reliable tools for predicting financial fraud, we collected data from ten different companies to calculate these two scores. In selecting the targets for the calculation, we separated them into 5 small groups, and adhered to the following main criteria:
1. The selected targets are all Chinese companies listed in the United States.
2. Five groups of companies come from five different industries, with different sizes (company size, financial performance) of companies between groups; within a single group, we made sure that both companies were in the same industry and tried to make the volumes of both sides similar.
3. Of the four groups of companies, we selected one that had a case of financial fraud and another that did not. The other six groups of companies have no previous experience with financial fraud.
The advantage of our approach is that we can try to diversify the types of companies and find out how this model differs under the financial data of different types of companies. And by matching one with a fraud case and one without, controlling for the other characteristics of both (similar size, same industry), we can visually and effectively compare the results of the M-score and F-score.
Of course, in our process of collecting data, we encountered several difficulties. The main challenge is that the availability of the data is not controllable. To be more specific, even if we could find two comparatively similar companies and one of which has a history of financial fraud, we would not be able to get quantitatively matching financial data. For example, we can find Company A's annual reports from 2016 to 2021, but Company B in the same group is missing the annual reports until 2018. The consequence of this problem is that we cannot get enough calculation results so comparisons based on time scales become very difficult. And the year mismatch of a single set of data directly leads to an overall mismatch of ten sets of data. In addition to the year mismatch, another data availability issue is that we cannot directly collect several financial data for certain companies. In collecting the various financial data required for this model, some of the data is not directly presented in the company's annual reports, which are not uniformly available on a single data platform. This makes it extremely difficult to find key data, and we cannot efficiently verify that the data calculated through indirect calculations are true.
6. Results and Analysis
Table 1: Sample data in group D (Total groups: 10, from A to J).
D1:Kangde Xin Composite | (Us/per share data) | |||
Year- 2017 | Year 2018 | Year 2019 | Year- 2020 | |
Awerage totel assetst,t+ 1) | - | 34331.415 | 21714.575 | 8564.985 |
Cash&equiallents | 18504.02 | 15315.62 | 58.67 | 51.17 |
COGS | 3946.304 | 4359.267 | 4273.47 | 4317.468 |
Current Assets(net) | 25134.19 | 21982.72 | 4104.72 | 3783.13 |
Current labilities | 11734.45 | 11471.57 | 6976.93 | 10331.18 |
Depreciation | 1848.46 | 2036.787 | 1938.165 | 1668.329 |
Inventory | 582.55 | 629.12 | 387.16 | 283.23 |
LT debt | 4439.23 | 4522.38 | 3534.27 | 2850.8 |
Net income | 2475.84 | 460.59 | -7172.43 | -3206.87 |
None-cash net operating assets | 10272.26 | 14279.24 | 5930.98 | 5277.72 |
PP&E(net) | 3904.17 | 7488.13 | 3941.65 | 3429.85 |
Receivables | 4913.94 | 5110.58 | 1236.99 | 1220.54 |
Sales | 11789.07 | 9150.29 | 1479.47 | 1107.25 |
SG&A | 825.64 | 1908.04 | 5988.33 | 2041.71 |
CF from Operating Activities | 3661.76 | 1310.36 | -868.57 | 11.25 |
Totel accruals | -1185.92 | -849.77 | -6303.86 | -3218.12 |
Total assets | 34262 36 | 34400.47 | 9028.88 | 8101.09 |
Prepaid expenses | 280.95 | 561.5 | 35.44 | 33.67 |
Defer red tax | 0 | 0 | 0 | 0 |
Goodwill and intangibles | 590.65 | 489.91 | 329.74 | 310.43 |
Table 2: Sample m-score & f-score results in Group D.
#MSCORE parameters | Year 2018 | Year 2019 | Year 2020 | |
DSRI | - | 0.43350154 | 0.135185879 | 0.824984623 |
GMI | - | 0.857105731 | 3.238337378 | -2.52336871 |
AQI | - | 0.139847635 | 0.766097091 | 0.201121291 |
SGI | - | 0.776167246 | 0.161685586 | 0.748409904 |
DEPI | - | 0.194065733 | 0.346403246 | 0.380168095 |
SAI | - | 0.16184822 | 0.654441553 | 1.380027983 |
LVGI | - | 0.466811101 | 0.363692705 | 1.459979532 |
TATA | - | -0.02470228 | -0.69818848 | -0.39724531 |
MSCORE | - | 3.513536656 | 6.010539073 | 7.194287778 |
#FSCORE parameters | - | Year 2018 | Year 2019 | Year 2020 |
rsst_acc | - | 0.116714677 | -0.38445245 | -0.076271 |
ch_rec | - | 0.005727699 | -0.17838582 | -0.00192061 |
ch_inv | - | 0.001356484 | -0.01114269 | -0.01213429 |
soft_assets | - | 0.337109348 | 0.556941725 | 0.570302268 |
ch_cs | - | 89.5365 | 53.5306 | 11.237 |
ch_roa | - | 2.37091E-05 | 0.000763183 | 6.45523E-05 |
issue | - | 1 | 1 | 1 |
- | ||||
FSCORE | - | 0.9222 | 2.624 | 3.89344 |
Table 1 presents small portions of the data we collected. For each company we selected, we organized the necessary financial data and obtained the various parameters required for the calculation of the M-score and F-score. As shown in Table 2, the target company is Kangde Xin Composite Material Group Co Ltd, which committed financial manipulation in 2019 (highlighted in red color, for both Table 1 and Table 2). We finished the calculations of the M-score and F-score from the Year 2018 to the Year 2020. The calculation shows that the M-score for 2018 is 3.5135 while the figure for 2019, where the financial fraud was designed, is increased to 6.0105. Meanwhile, from 2018 to 2019, the obtained F-score increased annually, from 0.9222 to 2.624. Those numbers are consistent with the principles of M-score and F-score gave so far. Specifically, before the year associated with financial fraud, M-score is greater than 2.2, indicating a high possibility of manipulation. Not surprisingly, in 2019, when financial fraud was involved, this score almost doubled compared to that of 2018. In terms of F-score, the result in 2018 is 0.09222 which is slightly below the ‘risky threshold’ of 1. Then in 2019, the F-score of Kangde Xin reached 2.264, which is greater than 1.
To summarize what we found in this single sample company, we obtained a consistent result that reflects what we know from the techniques of M-score and F-score. However, we are curious about if the calculations will still be in line with expectations if we involve more than one company. That is, what will happen if we analyze these two scores on a scale of multiple groups of companies?
Our next step is to conceptualize a method that allows for effective analysis. The initial approach we came up with is having a parallel comparison on a time basis. That is, draw trend graphs of the M-score/F-score of different companies, and compare each of those graphs to examine the similarities and discrepancies. At first glance, this approach looks reasonable, but we soon discovered a list of major shortcomings of the parallel comparison. First, the distribution of the data we collected is not consistent over periods, as I mentioned before. These time gaps will make it meaningless to do comparisons on a time basis. Second, we do not ensure the difference in size and financial performance of the companies. If we observe the annual trends of the M-score/F-score, there is no way of realizing if company variability can affect these changes in these two scores.
Therefore, we figured out a more reasonable analysis method. Instead of comparing the variations on a multiple-year basis, we narrow down the observation period to a two-year basis. That is, compare the results of the year of financial manipulation and of one year before that year. We first collected calculations from companies associated with financial manipulations, along with the control companies (those in the same group but did not have frauds). Then, we calculated the arithmetic mean of the M-score and F-score from the target two years (denote t as the year of financial frauds and t-1 as the year before t).
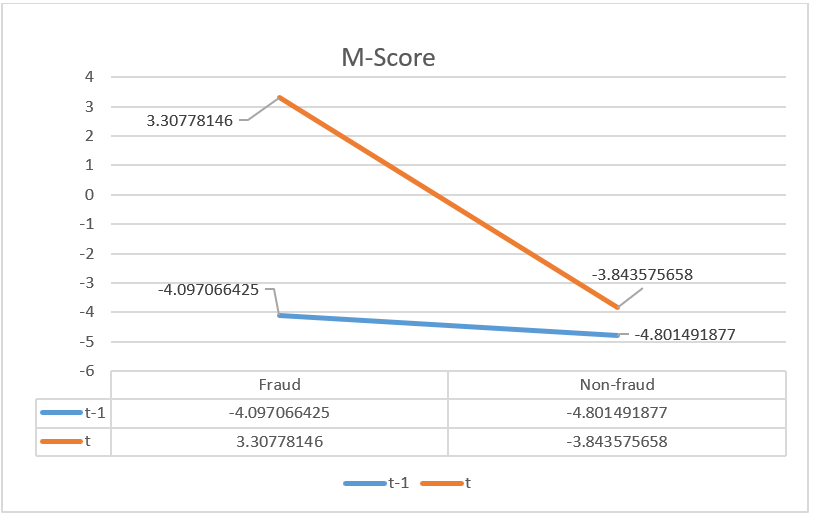
Figure 1: Averaged analysis of m-score.
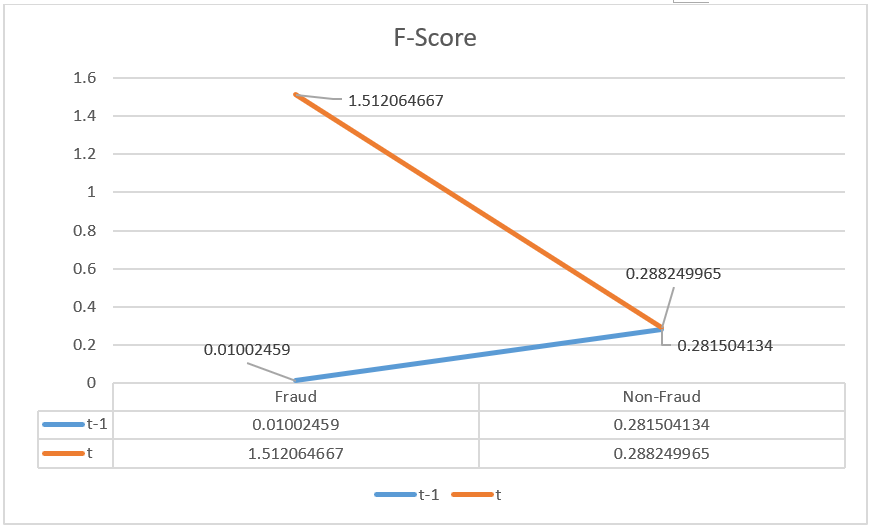
Figure 2: Averaged analysis of f-score.
As Figure 1 and Figure 2 shown above, we draw two lines to represent the changes in M-score and F-score. The Bule line stands for Year t-1, and the orange line stands for Year t. All results associated with fraud are located on the left side, while results from non-fraud companies are on the right side. (e.g., in Figure 1, -4.0970 for fraud companies, -4.8014 for non-fraud companies).
In terms of the two averaged scores, our findings are:
1. In Figure 1, the averaged M-score in Year t-1 is significantly lower than that in Year t. It increased from negative 4.097066425 to 3.30778146. In the non-fraud group, the two M-score both stays at a level lower than negative 2.2. Given the principles of M-score, this change exactly reflects the fact that if M-Score is less than -2.22, it implies that the sample company does not manipulate results in financial reports in that period. However, if the M-score is more than 2.22, there exists the possibility that the company tends to manipulate numbers.
2. In Figure 2, the averaged F-scores follow a similar pattern as in Figure 1. To be more specific, the fraud company group in Year t-1 has an F-score of 0.01002459, which is at the “safe level” of less than 1. But the F-score for the fraud group increased to 1.512064667 in Year t. This result is also consistent with the fact that an F-score above 1 indicates a risk of fraud at a normal level. Moreover, for the non-fraud group, the F-scores for both years stay below 1, implying a relatively lower probability of fraud.
Beyond analyzing the numerical results, the shapes of these two figures above are very similar. The left sides (“fraud side”) of the blue line and orange line have an obvious gap, while the right sides of these two lines nearly intercept or have a converging trend. This visual difference indicates that for fraud groups, either the M-score or F-score will experience a prominent change from Year t-1 to Year t. However, for the non-fraud groups, the M-score/F-score will only undergo small changes between Year t-1 and Year t.
7. Conclusion
In this research, we revisited the principles of M-score and F-score from previous studies. We chose ten groups of samples that are Us-listed Chinese Companies. Some of those companies are associated with financial report frauds in the past (e.g., Luckin Coffee, Kangde Xin). We collected financial data from these 20 companies and calculated the parameters required for the calculations of these two scores.
Based on the results calculated from our sample companies, we analyzed them in the approach that we took the average M-scores and F-scores for companies that committed fraud and the companies in the same groups without fraud. Instead of making a comparison based on multiple-year periods, we only use the year of associating frauds and the year before that year (for non-fraud groups, we control the two years to be the same years).
We have the following main findings. First, the calculation results for M-score and F-score can vary on a large scale than expected. The main reason is that our calculations for some groups may contain mathematical mistakes or the data we collected are not reliable. Another potential reason is that the variations in company types and sizes may lead to big variations in calculation results. Second, the M-score/F-score results are consistent with the principles we introduced from previous studies. Though there are several outliers, the majority of our results reflect the fraud cases that happened in sample companies. Third, we verified whether the M-score/F-score are effective tools for predicting financial report fraud. Between the year associated with frauds and the year before that year, these two scores explicitly extinct differences in companies committing frauds and those without frauds.
References
[1]. Kniepmann, Clay M. “Fraud Triangle.” Corporate Finance Institute, 29 Nov. 2022, https://corporatefinanceinstitute.com/resources/accounting/fraud-triangle/.
[2]. Turner, Jerry L., et al. An Analysis of the Fraud Triangle. Jan. 2003, https://www.researchgate.net/profile/Theodore-Mock/publication/237777981_An_Analysis_of_the_Fraud_Triangle/links/00b4952769aa39a5fe000000/An-Analysis-of-the-Fraud-Triangle.pdf.
[3]. Beneish, Messod D., et al. “Fraud Detection and Expected Returns.” SSRN, 5 Feb. 2012, https://papers.ssrn.com/sol3/papers.cfm?abstract_id=1998387.
[4]. Dechow, Patricia, et al. “Predicting Material Accounting Misstatements.” SSRN, 30 June 2007, https://papers.ssrn.com/sol3/papers.cfm?abstract_id=997483.
[5]. Keune, M. , & Johnstone, K. M. . SSRN-Inferences from the Revelation of Previously Uncorrected Accounting Misstatements by Marsha Keune, Karla Johnstone.
Cite this article
Wang,C.;Lyu,L.;Zhang,S. (2023). Identifying Financial Report Frauds. Advances in Economics, Management and Political Sciences,22,9-17.
Data availability
The datasets used and/or analyzed during the current study will be available from the authors upon reasonable request.
Disclaimer/Publisher's Note
The statements, opinions and data contained in all publications are solely those of the individual author(s) and contributor(s) and not of EWA Publishing and/or the editor(s). EWA Publishing and/or the editor(s) disclaim responsibility for any injury to people or property resulting from any ideas, methods, instructions or products referred to in the content.
About volume
Volume title: Proceedings of the 2023 International Conference on Management Research and Economic Development
© 2024 by the author(s). Licensee EWA Publishing, Oxford, UK. This article is an open access article distributed under the terms and
conditions of the Creative Commons Attribution (CC BY) license. Authors who
publish this series agree to the following terms:
1. Authors retain copyright and grant the series right of first publication with the work simultaneously licensed under a Creative Commons
Attribution License that allows others to share the work with an acknowledgment of the work's authorship and initial publication in this
series.
2. Authors are able to enter into separate, additional contractual arrangements for the non-exclusive distribution of the series's published
version of the work (e.g., post it to an institutional repository or publish it in a book), with an acknowledgment of its initial
publication in this series.
3. Authors are permitted and encouraged to post their work online (e.g., in institutional repositories or on their website) prior to and
during the submission process, as it can lead to productive exchanges, as well as earlier and greater citation of published work (See
Open access policy for details).
References
[1]. Kniepmann, Clay M. “Fraud Triangle.” Corporate Finance Institute, 29 Nov. 2022, https://corporatefinanceinstitute.com/resources/accounting/fraud-triangle/.
[2]. Turner, Jerry L., et al. An Analysis of the Fraud Triangle. Jan. 2003, https://www.researchgate.net/profile/Theodore-Mock/publication/237777981_An_Analysis_of_the_Fraud_Triangle/links/00b4952769aa39a5fe000000/An-Analysis-of-the-Fraud-Triangle.pdf.
[3]. Beneish, Messod D., et al. “Fraud Detection and Expected Returns.” SSRN, 5 Feb. 2012, https://papers.ssrn.com/sol3/papers.cfm?abstract_id=1998387.
[4]. Dechow, Patricia, et al. “Predicting Material Accounting Misstatements.” SSRN, 30 June 2007, https://papers.ssrn.com/sol3/papers.cfm?abstract_id=997483.
[5]. Keune, M. , & Johnstone, K. M. . SSRN-Inferences from the Revelation of Previously Uncorrected Accounting Misstatements by Marsha Keune, Karla Johnstone.