


1. Introduction
Tea plays an important role in the exportation, especially in developing countries. The yearly value of the world's tea production exceeds USD 17 billion, and the value of the worldwide tea trade, which is a significant source of export revenue, is USD 9.5 billion. The fact that smallholders produce 60% of the world's tea is a significant aspect of the beverage. Moreover, the production of tea enables rural people to meet their demands for food security and to enhance their nutritional condition by creating profitable jobs.
Tea has an extremely important position in China because of China's long history of drinking tea. Southwest China is where tea trees first appeared 60 to 70 million years ago. Chinese forebears can be found consuming tea more than 3,000 years ago, according to written sources [1]. In the Ming Dynasty, tea, as a noble drink, became a medium for many literati to express their emotions [2], and this attribute is also reflected in today's Chinese tea drinking culture. Furthermore, tea is a pillar industry in China. China has continued to be the world's largest producer of tea, contributing 47% of worldwide output, or 3.1 million tones in 2021, according to the Food and Agricultural Organization of the United Nations' research of national tea markets. India, the second-largest producer, recovered its output in 2021, going from 1.26 million tones in 2020 to 1.33 million tones. China has seen a further increase in its tea exports since the Belt and Road Initiative was proposed [3].
However, since 2019, the outbreak of the covid-19 crisis in China, although the fatality rate of the virus is not high, has also caused panic among the people and caused extremely far-reaching political and social impacts. During the COVID-19 pandemic in China, more than one fifth of junior high and high school students' mental health was affected [4]. A great example about the impaction is the sector of tourism. Due to a lack of customers and growing public concern about the spread of this dangerous illness, several local and foreign airlines are obliged to cancel their flights from and to China. Around $127.3 billion in foreign exchange earnings were generated by international travel to China. Due to the cancellation of all flights, no one is heading to China, hence this number has somewhat decreased [5]. However, a number of last-resort measures employed by the Chinese government, including such various isolation and blockade measures, have dramatically altered China's economic environment. The above changes included not only a decline in total social retail demand, a slowdown in investment, fluctuations in the consumer price index (CPI), and a drop in imports and exports, but also the corporate financing environment (monetary policy) and the taxation environment (fiscal policy), which enhanced the pressure [6].
During this process, the tea business has also suffered. China's tea exports from January to December 2020 reached 348,800 tons, down 17.700 tons from the entire year of 2019 and 4.86% from the previous year, according to data from the National Bureau of Statistics of China. The value of tea exports as a whole was US$2.019 billion, the lowest in almost 20 years and a rise of less than 1% from year to year.
On the other hand, macroeconomic variables are important indicators for the assessment of the market, and Sari studied the relationship between macroeconomic variables and the housing market and obtained reliable conclusions [7]. Berk investigated the relationship between macroeconomic variables and suicide rates and showed that macroeconomic variables are indeed closely related to suicide rates [8]. This is a further indication of the importance of research on macroeconomic variables.
Similar papers examining the relationship between the volume of imported or exported goods and macroeconomic variables continue to be available, such as Limaei and Todshki and they all came to a positive conclusion [9, 10]. This suggests that there is some relationship between import and export goods and macroeconomic variables, and relevant studies can be conducted.
In order to restore the tea market and prevent similar incidents from occurring in the future, it is necessary to analyze the factors affecting the export volume of tea and find the factors with the highest priority. This article will analyze the data of tea export volume and explore its relationship with various macroeconomic variables, including GDP, population, the domestic tea production, and 100 Dollars to China Yuan Exchange Rate.
2. Method
2.1 Background Information
In regression analysis, one of the basic assumptions in classical models is that the independent variables are uncorrelated, but if we fit a regression model with a high degree of correlation between the independent variables, it may have an impact on the results, which we call multicollinearity.
The variance inflation factor analysis (VIF) is an effective way to test for the presence of multicollinearity.
VIF=11−R2 (1)
R2 is the coefficient of determination of the model. Unfortunately, there isn't a clear cut threshold for what constitutes a "big" VIE. 10 is considered by several authors, including Chatterjee and Price, to be a significant enough number to denote a problem [11]. As the severity of the multicollinearity increases, the variance inflation factor will gradually become larger, and generally when VIF larger than 10, we can consider the existence of severe multicollinearity.
2.2 Database Construction
Data of tea exportation in China was collected from the National Bureau of Statistics of China during the years 2003–2021. Macroeconomics data such as the domestic tea production was collected from the same place.
In order to find the degree of influence of each independent variable, such as GDP and population, on the dependent variable. It is necessary to standardize the selected independent variables. The standardize function is written below.
{X^{ \prime }}=\frac{{x_{i}}-\bar{x}}{σ} (2)
2.3 Multiple Linear Regression
In order to analyze the data, multiple linear regression (MLR) was employed. Multiple linear regression analysis is a technique for modelling the linear relationship between two or more variables. MLR could be used to determine the contributions of GDP, population, the domestic tea production and Exchange Rate to the tea export volume. Note that including or excluding of independent variables was accomplished manually based on the results of regression analysis.
It is assumed that tea export volume is the dependent variable, and the macroeconomic variable is the independent variable. The function beneath was used to identify the relation between the tea export volume and macroeconomic variables (GDP, Population, the domestic tea production, Exchange Rate).
Y={β_{0}}+{β_{1}}{X_{1}}+{β_{2}}{X_{2}}+{β_{3}}{X_{3}}+{β_{4}}{X_{4}}+ε (3)
Y is the depending variable especially the export volume of tea. {β_{i}} are parameters of the function. {X_{i}} are the independent variables that are macroeconomic variables. ε is a series of random errors obeying the normal distribution, mean zero and autocorrelation zero.
ε~N(0,{σ^{2}}) (4)
2.4 Ridge Regression
However, these macroeconomic variables can be judged to have multicollinearity among themselves by the calculation of VIF values. When there is severe multicollinearity it is easy to cause the independent variables to be insignificant to the dependent variable, thus delating some important explanatory variables, and the confidence intervals of the parameters will be significantly widened, making the explanatory power of the model further reduced.
This is where using ridge regression can reduce the effect of multicollinearity. First matrix the relevant variables from above.
[\begin{matrix}\begin{matrix}{y_{1}} \\ {y_{2}} \\ ⋮ \\ {y_{n}} \\ \end{matrix} \\ \end{matrix}]=[\begin{matrix}1 & {x_{11}} & ⋯ & {x_{41}} \\ 1 & {x_{12}} & ⋯ & {x_{42}} \\ ⋮ & ⋮ & ⋮ & ⋮ \\ 1 & {x_{1n}} & ⋯ & {x_{4n}} \\ \end{matrix}] [\begin{matrix}{β_{0}} \\ {β_{1}} \\ {β_{2}} \\ {β_{3}} \\ {β_{4}} \\ \end{matrix}]+[\begin{matrix}{ε_{1}} \\ {ε_{2}} \\ ⋮ \\ {ε_{n}} \\ \end{matrix}] (5)
Y= [\begin{matrix}\begin{matrix}{y_{1}} \\ {y_{2}} \\ ⋮ \\ {y_{n}} \\ \end{matrix} \\ \end{matrix}] , X= [\begin{matrix}1 & {x_{11}} & ⋯ & {x_{41}} \\ 1 & {x_{12}} & ⋯ & {x_{42}} \\ ⋮ & ⋮ & ⋮ & ⋮ \\ 1 & {x_{1n}} & ⋯ & {x_{4n}} \\ \end{matrix}] , β=[\begin{matrix}{β_{0}} \\ {β_{1}} \\ {β_{2}} \\ {β_{3}} \\ {β_{4}} \\ \end{matrix}] , ε = [\begin{matrix}{ε_{1}} \\ {ε_{2}} \\ ⋮ \\ {ε_{n}} \\ \end{matrix}] (6)
The regular equation for the least squares method used for linear regression is
\hat{β}={(X^{T}}X{)^{-1}}{X^{T}}Y (7)
When the linear correlation between some columns is relatively large, that is, when the {X^{T}}X determinant is close to zero, the computational inverse matrix error will be large, and the traditional least squares method lacks stability and reliability.
The ridge regression adds a positive constant matrix, λ I, to the {X^{T}}X is:
\hat{β}={(X^{T}}X+λI{)^{-1}}{X^{T}}Y (8)
\hat{β} is the ridge regression estimate coefficients matrix, λ is the ridge parameter, I is the identity matrix. When k = 0, the ridge regression estimate is the ordinary least squares estimate.
In this study, K-folds cross validation will be used to select the appropriate ridge parameters. The sample data is divided randomly into {K^{th}} folds, with (K-1{)^{th}} folds being randomly chosen as the training set and the final fold serving as the test set. This procedure is referred to as K-fold cross-validation. Following the conclusion of this phase, the (K-1{)^{th}} folds are once again randomly selected to use as training variables. The loss function is chosen to assess the ridge regression model and parameters after a number of rounds (less than K).
CV=\frac{1}{K}\frac{RSS}{[1-\frac{df}{K}{]^{2}}} (9)
3. Results and Discussion
In this paper, the year, GDP, population, domestic tea production, and Exchange Rate are considered as independent variables and define them as {x_{1}},{x_{2}},{x_{3}},{x_{4}} , China tea export volume is the dependent variable, define it as y. After using multiple regression analysis and ordinary least squares (OLS), the following equation can be obtained:
\hat{y}=2.733{x_{1}}+0.882{x_{2}}-2.621{x_{3}}+0.050{x_{4}}-3.477×{10^{-15}} (10)
In fact, by looking at the Fig (1), it can be found that the population and the tea export volume cannot be negatively correlated, what is clear is that there is obviously a problem with the population variable in function (10) and the multiple linear regression is in error. Further, observe the scatter plot of domestic tea production and tea export volume (Fig.2). It follows a trend very similar to the population-tea export volume figure (Fig.1). This reflects the fact that there cannot be such a big difference between these two variables.
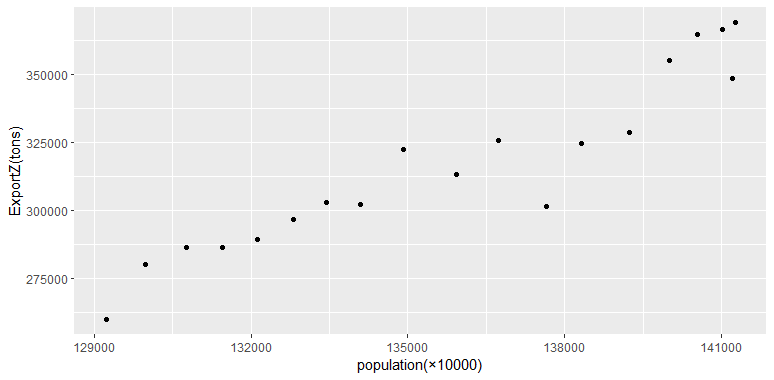
Figure 1: Scatter plot of population versus tea export volume in China.
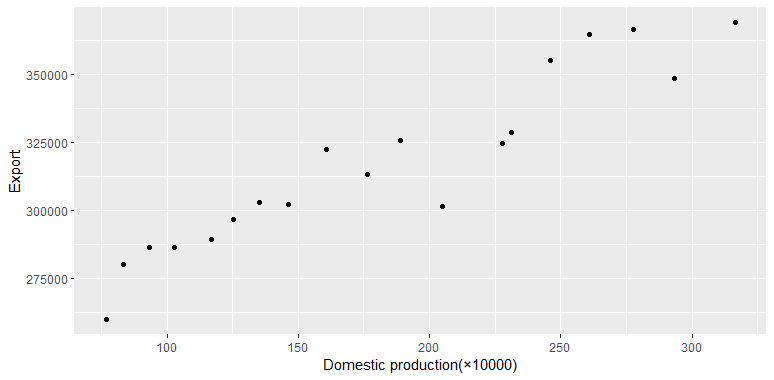
Figure 2: Scatter plot of domestic tea production versus tea export volume in China.
Table 1: Analysis of Variance Table.
DF | Sum Sq | Mean Sq | F value | Pr(>F) | |
GDP | 1 | 16.339 | 16.339 | 182.634 | 2.006 ×{10^{-9}} |
population | 1 | 0.022 | 0.022 | 0.253 | 0.622 |
production | 1 | 0.369 | 0.369 | 4.128 | 0.061 |
Exchange rate | 1 | 0.015 | 0.015 | 0.176 | 0.680 |
Residuals | 14 | 1.252 | 0.089 |
From Table 1, by Anova test results, it is obvious that results in two variables: population and exchange rate are insignificant (P>0.05). Then, by calculating the VIF values (Table 2), the following results can be obtained. In the function (11), {{R_{i}}^{2}} is the {R^{2}} statistic from the regression of X, on the other covariates. According to the VIF formula, the multiple linear regressions with GDP, population and production as the dependent variables and the remaining variables as the independent variables have very good fit. As a result, it is possible to draw the conclusion that the chosen macroeconomic variables exhibit significant multicollinearity.
VI{F_{i}}=\frac{1}{1-{{R_{i}}^{2}}} (11)
Table 2: Variance inflation factor.
GDP | population | Domestic tea production | Exchange rate | |
VIF value | 243.92 | 63.50 | 332.93 | 2.84 |
In summary, the results obtained by constructing a model using multiple linear regression alone are inaccurate. Since it is not possible to discard any of the selected variables, ridge regression in is an effective method for solving multicollinearity.
First of all, the ridge parameters need to be calculated. By using the K-folds CV method, and using R language to calculate and plot the image of the function with log(λ) as the independent variable and y as the dependent variable (Fig.2). In this study, setting k to 5 is a more reasonable choice because the size of the data set is not large. The red dashed line is the obtained cross-validation curve, and the error bars along the λ series are the upper and lower standard deviation curves. The first dashed line is located at the lowest point of the function image, indicating that the corresponding mean-squared error is minimum when log(λ) is at that value. From this, a value of {λ_{1}} with the smallest mean square error can be obtained. and is used as the λ value for the ridge regression. 4 is degree of freedom.
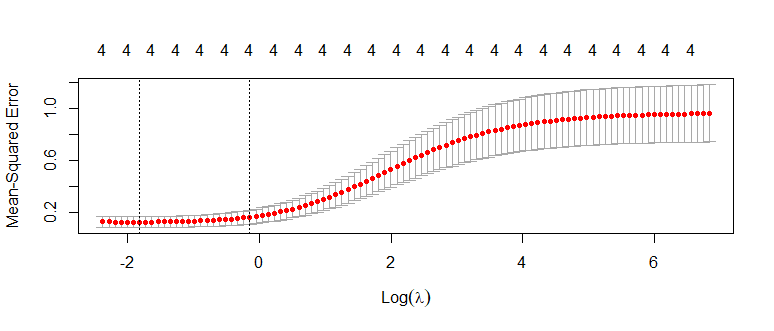
Figure 3: Plot of log(λ) and Mean-squared error.
{λ_{1}}=0.16 (12)
Table 3: Selected results of K-folds cross validation.
DF | %Dev | lambda | |
1 | 4 | 89.62 | 0.24 |
2 | 4 | 89.73 | 0.21 |
3 | 4 | 89.83 | 0.20 |
4 | 4 | 89.92 | 0.18 |
6 | 4 | 90.00 | 0.16 |
After calculations with the R language "glmnet" package, it is found that 90% of the variance of the model can be explained by choosing 0.16 as the ridge parameter (Table 3). After obtaining the ridge regression parameter (12), the corresponding ridge regression coefficients can be obtained using the “glmnet” package in the R language. The results are summarized in the following Table 4.
Table 4: Ridge regression coefficient.
{β_{0}} | {β_{1}} | {β_{2}} | {β_{3}} | {β_{4}} |
-1.48 ×{10^{-15}} | 3.34 {×10^{-1}} | 2.91 {×10^{-1}} | 2.71 {×10^{-1}} | -9.76 {×10^{-3}} |
It is not difficult to conclude from these coefficients that the greatest correlation to the volume of tea exports is GDP, followed by population and domestic tea production, while the exchange rate is less correlated with the volume of exports, or even shows a negative correlation. Therefore, if some departments want to increase tea exports from the national level, it is still essential to improve the overall strength of the country, i.e. GDP. And population growth and indigenous tea production can also be advanced simultaneously to further increase China's tea export capacity.
4. Conclusion
Similar studies of the relationship between export goods and macroeconomic variables, such as Limaei’s and Todshki’s, based on a large amount of data to build separate linear regression models for each macroeconomic variable with the import and export data they want to study. This is effective in obtaining the relationship between the independent and dependent variables, but it also ignores the interactions between the independent variables.
Multiple linear regression and least squares are undoubtedly the most commonly used methods to solve such problems, but the desired results are usually not obtained under the influence of multicollinearity. Ridge regression, on the other hand, can well overcome the interference of multiple covariance and effectively deal with pathological data by modifying the traditional least squares method.
But again, the return of the Ridge has its own set of problems. First, ridge regression is based on least squares, and the prerequisite for using it is a linear relationship between the independent and dependent variables. If the linear relationship between them is weak or nonlinear, the results of ridge regression will be more biased. Moreover, unlike lasso regression, ridge regression cannot filter the variables, so the selection of independent variables is important for ridge regression. The independent variables in this study are all recognized as macroeconomic variables that have a significant impact back on import and export trade. In addition, the value of λ back has a great impact on the performance of the model, but its optimal value is often uncertain, which can greatly affect the results of the regression. But again, the return of the Ridge has its own set of problems. First, ridge regression is based on least squares, and the prerequisite for using it is a linear relationship between the independent and dependent variables. If the linear relationship between them is weak or nonlinear, the results of ridge regression will be more biased. Moreover, unlike lasso regression, ridge regression cannot filter the variables, so the selection of independent variables is important for ridge regression. The independent variables in this study are all recognized as macroeconomic variables that have a significant impact back on import and export trade. In addition, the value of λ back has a great impact on the performance of the model, but its optimal value is often uncertain, which can have a great impact on the results of the regression. K-folds cross validation method in this paper is only one of the methods for selecting λ. Other methods, such as observing the ridge trace plot, they may not obtain the same value of λ as the one selected in this study. Since this paper does not involve the use of models for prediction, the final conclusions will not differ much regardless of which method is used.
References
[1]. Pan, Si-Yuan, et al. Tea and tea drinking: China’s outstanding contributions to the mankind. Chinese Medicine, 2022, 1-40.
[2]. Fan, Zesen, Kaiyue Liu. The Promotion Effect of the Belt and Road Initiative on China's Tea Export Trade. Journal of Sociology and Ethnology, 2022, 94-100.
[3]. Jiang Hong. Tea as Nature, Tea as Power in Early Modern China: Tea and the Literati in the Ming Dynasty. Asian Culture and History, 2023.
[4]. Zhang Caiyun, et al. The psychological impact of the COVID-19 pandemic on teenagers in China. Journal of Adolescent Health 2020, 747-755.
[5]. Hoque, Ashikul, et al. The effect of Coronavirus (COVID-19) in the tourism industry in China. Asian Journal of Multidisciplinary Studies, 2020, 52-58.
[6]. Wang Xueli, et al. The spatiotemporal evolution of COVID-19 in China and its impact on urban economic resilience. China Economic Review, 2022, 101806.
[7]. Sari, Ramazan, et al. Macroeconomic variables and the housing market in Turkey. Emerging markets finance and trade, 2007, 5-19.
[8]. Berk, et al. The effect of macroeconomic variables on suicide. Psychological medicine, 2006, 181-189.
[9]. Limaei, Soleiman Mohammadi, et al. Wood import and export and its relation to major macroeconomics variables in Iran. Forest policy and economics, 2011, 303-307.
[10]. Todshki, Nasrin Esmaeili, Ali Ranjbaraki. The impact of major macroeconomic variables on Iran's steel import and export. Procedia Economics and Finance, 2016, 390-398.
[11]. Stine, Robert A. Graphical interpretation of variance inflation factors. The American Statistician, 1995, 53-56.
Cite this article
Liang,Z. (2023). Relationship between Tea Export and Major Macroeconomics Variables in China. Advances in Economics, Management and Political Sciences,22,283-290.
Data availability
The datasets used and/or analyzed during the current study will be available from the authors upon reasonable request.
Disclaimer/Publisher's Note
The statements, opinions and data contained in all publications are solely those of the individual author(s) and contributor(s) and not of EWA Publishing and/or the editor(s). EWA Publishing and/or the editor(s) disclaim responsibility for any injury to people or property resulting from any ideas, methods, instructions or products referred to in the content.
About volume
Volume title: Proceedings of the 2023 International Conference on Management Research and Economic Development
© 2024 by the author(s). Licensee EWA Publishing, Oxford, UK. This article is an open access article distributed under the terms and
conditions of the Creative Commons Attribution (CC BY) license. Authors who
publish this series agree to the following terms:
1. Authors retain copyright and grant the series right of first publication with the work simultaneously licensed under a Creative Commons
Attribution License that allows others to share the work with an acknowledgment of the work's authorship and initial publication in this
series.
2. Authors are able to enter into separate, additional contractual arrangements for the non-exclusive distribution of the series's published
version of the work (e.g., post it to an institutional repository or publish it in a book), with an acknowledgment of its initial
publication in this series.
3. Authors are permitted and encouraged to post their work online (e.g., in institutional repositories or on their website) prior to and
during the submission process, as it can lead to productive exchanges, as well as earlier and greater citation of published work (See
Open access policy for details).
References
[1]. Pan, Si-Yuan, et al. Tea and tea drinking: China’s outstanding contributions to the mankind. Chinese Medicine, 2022, 1-40.
[2]. Fan, Zesen, Kaiyue Liu. The Promotion Effect of the Belt and Road Initiative on China's Tea Export Trade. Journal of Sociology and Ethnology, 2022, 94-100.
[3]. Jiang Hong. Tea as Nature, Tea as Power in Early Modern China: Tea and the Literati in the Ming Dynasty. Asian Culture and History, 2023.
[4]. Zhang Caiyun, et al. The psychological impact of the COVID-19 pandemic on teenagers in China. Journal of Adolescent Health 2020, 747-755.
[5]. Hoque, Ashikul, et al. The effect of Coronavirus (COVID-19) in the tourism industry in China. Asian Journal of Multidisciplinary Studies, 2020, 52-58.
[6]. Wang Xueli, et al. The spatiotemporal evolution of COVID-19 in China and its impact on urban economic resilience. China Economic Review, 2022, 101806.
[7]. Sari, Ramazan, et al. Macroeconomic variables and the housing market in Turkey. Emerging markets finance and trade, 2007, 5-19.
[8]. Berk, et al. The effect of macroeconomic variables on suicide. Psychological medicine, 2006, 181-189.
[9]. Limaei, Soleiman Mohammadi, et al. Wood import and export and its relation to major macroeconomics variables in Iran. Forest policy and economics, 2011, 303-307.
[10]. Todshki, Nasrin Esmaeili, Ali Ranjbaraki. The impact of major macroeconomic variables on Iran's steel import and export. Procedia Economics and Finance, 2016, 390-398.
[11]. Stine, Robert A. Graphical interpretation of variance inflation factors. The American Statistician, 1995, 53-56.