


1. Introduction
Apple Inc., one of the world's largest technology companies, has been the subject of numerous studies and research in the academic field. Despite the extensive research on Apple's stock price, there are still gaps in our understanding of its intrinsic value and actual market price.
“Financial modules play a crucial role in investment decision-making, as they provide a systematic way to analyze and predict a stock’s future performance” [1]. Modules like Capital and Asset Pricing Modules, which is a very efficient tools for calculating the rate of return and the intrinsic value of the stock. The dividend discount Module is used to find out the theoretical value of the stock. While its variation, Gordon Growth Module, can be applied to calculate the value of the stock, under special circumstances. Besides the market index extracted from Standard&Poor’s 500 and the monthly data of market return cited from the U.S. 10 years treasury bill, the previous stock value and the dividend value of AAPL are collected from Yahoo finance Apple Dividend history respectively. This paper aims to fill the research gap by using a two-stage dividend discount model, known as DDM, to estimate the intrinsic value of Apple's stock price and compare it with the actual open price. The DDM model and calculation process will be thoroughly explained in this paper, and the results will be presented using historical data from 2017 to 2022.
A graph comparing the intrinsic value and market price of Apple's stock over time will also be included in the report. Investors will be able to make wise selections thanks to the research's insightful analysis of Apple's stock performance. The findings of this study will also benefit academia by bridging a gap in the body of knowledge regarding the price of Apple's stock. The publication will finish by summarising the key findings, pointing out the study's existing shortcomings, and making recommendations for further research.
2. Literature Review
2.1. The Market Return Index
The Market Return Index “tracks the ups and downs of a chosen group of stocks or other assets” over time [2]. S&P 500, “provides investors with a simplified snapshot of a large market sector, without having to examine every single asset in that index” [3]. Its formula can be expressed as:
\( Rm=\frac{({I_{t}}-{I_{t-1}})}{{I_{t-1}}} \) (1)
Rm is the market return of the stock. \( {I_{t}} \) refers to the current S&P 500 index of AAPL, and \( {I_{t-1}} \) refers to the S&P 500 index of AAPL for the previous period.
2.2. Risk-Free Rate
The risk-free rate is often considered to be the "base" rate of return for investments, “it serves as a benchmark for evaluating the expected return on other investments and is used in various financial calculations, including the Capital Asset Pricing Model and the calculation of the cost of equity” [4].
The risk-free rate is typically based on the return on government bonds since these bonds are considered to have little or no default risk. Government bonds are issued by national governments which means secure and reliable, as a result, they are considered to be a safe investment.
The risk-free rate is often used as a baseline for determining the required rate of return on other investments.
Here are the risk-free rates for the past five years: On the 30th of November in 2017 the risk-free rate is 2.42%; on the same date next year, the risk-free rate is 1.78%; moving on to the next year, the risk-free rate is 0.84%; the risk-free rate on 30th of November in 2021 is 1.43%; and finally, in 2022 the risk-free rate is 3.68% [5].
2.3. CAPM Valuation
The Capital Asset Pricing Model which is known as CAPM is a financial model that “helps investors determine the expected return of a security given its risk and the expected return of the overall market” [6], and it gives the level of systematic risk, also known as market risk or beta, which is associated with that investment.
The foundation of the CAPM is the notion that investors demand a higher rate of return in exchange for taking on greater risk. It is based on the supposition that investors will only put money into an asset if they believe they can profit from it at a rate greater than the risk-free rate of return, which is the profit that can be made from a risk-free investment like a government bond.
Its formula is:
\( E({R_{i}}) = {R_{f}}+{β_{i}}×[E{(R_{m}})-{R_{f}}] \) (2)
In which, \( E({R_{m}}){-R_{f}} \) and E ( \( {R_{i}} \) ) is given by \( {β_{i}} \) ., E ( \( {R_{i}} \) ) is the expected rate of return, also the discount rate for the stock per share, Rf is the risk-free rate of return, \( {β_{i}} \) is a metric used to compare security or portfolio's systematic risk to the market as a whole. \( E({R_{m}}){-R_{f}} \) refers to the difference between the expected market return and the risk-free return, which is the market risk premium.
The CAPM is a widely used tool in finance, but it has some limitations. Market efficiency and investor rationality are presumptions that may not always be true. Additionally, it depends on the availability of precise data, which might not always be the case. Therefore, it's crucial to exercise caution when using the CAPM and consider other factors that could affect the anticipated return on investment.
2.4. Expected Return
The anticipated return on investment based on its current level of risk is known as the expected return. It is a probability-weighted average of all possible returns that an investment could potentially earn. In other words, the expected return reflects the average return that an investor expects to earn over a certain period of time, based on the likelihood of different outcomes occurring.
The expected return is a key concept in finance, “it helps them to make informed decisions about where to allocate their capital” [7]. For example, investors may use the expected return to compare the potential returns of different investment options, to determine an appropriate level of risk for their portfolio, or to assess the potential performance of a particular investment over time.
Here are the data for the expected return: On November 30th 2017 the expected return is 0.231; on the same date next year, the value dropped to negative at the rate of -0.082; for 2019, the value reached 0.355; and on the 30th of November in 2020 and 2021, the values are stabling at a positive rate, which is 0/209 and 0.321; however, in 2022 the value again dropped to a negative value at -0.221 [8].
2.5. Gordon Growth Model
The Gordon growth model, also known as the dividend discount model, is a technique for estimating a stock's value based on the dividends it pays. The model assumes that the stock's current value is equal to the present value of all future dividends. Its present value is derived by applying a concession rate to each future payout that accounts for the opportunity cost of purchasing the stock. The expected rate of return on the stock and the expected rate of return on a risk-free investment are functions of the discount rate. When assessing stocks that consistently pay dividends, such as utility stocks, the DDM is helpful [9]. The Gordon growth model “uses the expected future dividend stream, the required rate of return, and the expected long-term growth rate of dividends to estimate the intrinsic value of a stock” [10].
The Gordon growth model has some limitations since it counts on the company's ability to pay dividends indefinitely and constant dividend growth. Additionally, it ignores other elements that might influence a company's value, such as adjustments to the company's operations or shifts in market conditions.
Its formula is shown as follows,
\( V=\frac{{D_{1}}}{r-g}=\frac{{D_{0}}(1+g)}{r-g} \) (3)
In which,
\( g=Retention Ratio×ROE \) (4)
The retention Ratio is the 1−dividend payout ratio, D is the expected dividend per share, and r is the discount rate, expressed as a percentage. The expected dividend per share is multiplied by the discrepancy between the discount rate and the anticipated growth rate to arrive at the intrinsic value. This is an infinite-term representation of the dividends' present value.
2.6. Two-Stage Dividend Discount Model
The two-stage dividend discount model is a financial valuation method used to determine the intrinsic value of a company's stock. It is based on the notion that the present value of all potential dividend payments for a stock is equal to that stock's worth.
In the two-stage model, a company is assumed to have two distinct periods of dividend growth. The first stage is typically a period of stable growth, while the second stage is a period of slower growth or maturity. A discount rate, which reflects the risk associated with the company's future cash flows, is used to calculate the present value of the dividends in each stage.
To calculate the intrinsic value of a stock using the two-stage model, the expected dividends in each stage are first determined. The present value of the dividends in each stage is then calculated using the discount rate. The intrinsic value of the stock is the sum of the present value of the dividends in both stages.
The two-stage model, which considers variations in the company's growth rate over time, enables a more sophisticated valuation of a company's stock. You can tell if a stock is cheap or overvalued by comparing its intrinsic value to its current market price. The formula for two-stage DDM can be expressed as:
\( V=\frac{{D_{0}}(1+g)}{1+r}+\frac{{D_{0}}{(1+g)^{2}}}{{(1+r)^{2}}}+\frac{{D_{0}}{(1+g)^{3}}}{{(1+r)^{3}}}+...+\frac{{D_{0}}(1+g{)^{n}}}{(1+r{)^{n}}} \) (5)
In which, V is the intrinsic value of the stock; \( {D_{0}} \) is the initial value of the dividend; g is the dividend growth rate, and R is expected to return.
3. Research Methodology
3.1. Intrinsic Value of Stock
The Capital Asset Pricing Model (CAPM) and Gordon Growth Model (GGM), two widely used financial models, will be utilised to calculate the intrinsic stock value of Apple Inc. The data needed for this analysis are the open price of the stock, the two-stage dividend discount model, the S&P 500, the market return rate, the risk-free rate, beta, expected return, the dividend growth rate, the dividends, retention ratio, the return on equity, and the dividends for each year from 2017 to 2022.
In the first stage of this analysis, the expected return for each year is calculated using the CAPM algorithm. This formula takes into account the beta of the stock, the risk-free rate, and the market return rate. The projected return for each year is calculated by multiplying the stock's beta by the market return rate, which is then added to the risk-free rate and the market return rate before being deducted.
The intrinsic stock value is then determined using the Gordon Growth Model by dividing the current dividend by the discrepancy between the projected return and the dividend growth rate. In the phase before, the projected return and the dividend growth rate are computed. Next, for each year, the intrinsic stock value is shown in the table.
A comparison of the intrinsic stock value determined by the two models serves as the analysis's last step. For every year except for 2018, it is demonstrated that the intrinsic stock value calculated using the GGM is significantly higher than the intrinsic stock value calculated using the CAPM. This is so because the GGM considers the dividends' projected growth rate in the future, whereas the CAPM only considers the stock's anticipated return.
The final results of the intrinsic value of AAPL in 2017 are $3.11669259, and the figures in the following five years are -$12.67240041, $2.620818633, $5.479014878, $4.817882198 and -$11.83971569 respectively [10].
3.2. Actual Stock Price of AAPL
The open price in 2017 is 42.61, and the figures in the following five years are 45.07, 66.65, 116.97, 159.99 and 141.4 respectively [11].
Based on the data, the actual stock price of AAPL has deviated from its intrinsic value calculated by the Two-Stage Dividend Discount Model. Several factors could have contributed to the difference between the intrinsic value and the actual stock price, including market conditions, economic conditions, company-specific events, and investor sentiment.
For example, in 2018, the actual stock price of AAPL was 6.24% lower than the intrinsic value calculated by the Two-Stage DDM. This deviation may have been influenced by the overall negative market return rate and the increase in the risk-free rate during that year. The negative market return rate may have caused investors to become more risk-averse, leading them to shy away from stocks like AAPL and causing its price to fall. Additionally, the increase in the risk-free rate may have made bonds and other low-risk investments more attractive to investors, reducing demand for equities like AAPL and putting downward pressure on its stock price.
In contrast, in 2019, the actual stock price of AAPL was 28.88% higher than the intrinsic value calculated by the Two-Stage DDM. This deviation may have been influenced by the overall positive market return rate and the decrease in the risk-free rate during that year. The positive market return rate may have boosted investor sentiment and increased demand for equities like AAPL, increasing its stock price. Additionally, the decrease in the risk-free rate may have made equities more attractive relative to low-risk investments, further boosting demand for AAPL and pushing its stock price higher.
It is important to note that the factors that influence the deviation between the intrinsic value and the actual stock price are constantly changing and can be difficult to predict. As such, it is important to regularly review and adjust the intrinsic value calculations to ensure that they remain accurate and relevant. In future research, it may be useful to explore other valuation models or incorporate additional data and factors that may have an impact on the deviation between intrinsic value and actual stock price.
4. Results and Finding
The results are gathered and visualized by the graph in Figure 1, in which the y-axis is the price, and the x-axis is the date.
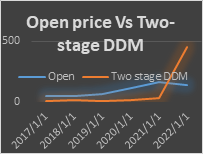
Figure 1: Open price VS two-stage DDM.
The graph shows the comparison between the actual open price and the intrinsic stock price of Apple from 2017 to 2022. The intrinsic stock price is represented by a solid blue line, while the actual open price is represented by a dotted red line. From the graph, it can be seen that the actual open price is higher than the intrinsic stock price in most of the years, indicating that the stock was overpriced during these periods. In 2022, the actual open price was lower than the intrinsic stock price, which suggests that the stock was undervalued in that year.
5. Conclusion
The intrinsic stock value of Apple company is analyzed with two financial models, CAPM and GGM. The calculations were based on the data provided and the results were compared with the actual open price. The intrinsic stock value was calculated by taking into account the expected return, dividend growth rate, retention ratio, and return on equity. The results showed that the intrinsic stock value was usually lower than the actual open price, indicating that the stock may be overvalued.
However, this paper has some limitations and areas for improvement. The data used for the calculation was limited to only six years, and the market return rate and risk-free rate were based on the S&P 500 index. To provide a more accurate estimate of the intrinsic stock value, it would be beneficial to involve a longer period and to include other factors that may influence the stock price.
Future work can concentrate on increasing the amount of information utilised in the computation, adding more financial ratios, and contrasting the outcomes with other equities in the same sector. To offer a more thorough examination, additional financial models may also be used. The intrinsic stock value of AAPL has been broadly explained in this essay, but more investigation is required to obtain a more precise estimate.
References
[1]. Yahoo!: Apple Inc. (AAPL) Analyst Ratings. Estimates & Forecasts. Finance Yahoo!, 10 Feb. (2023).
[2]. Bodie, Zvi, et al.: Investments. McGraw-Hill Education (2021).
[3]. Fabozzi, Frank J., et al.: Investment Management. Prentice-Hall (1999).
[4]. FRED: Market Yield on U.S. Treasury Securities at 10-Year Constant Maturity. Quoted on an Investment Basis (2023).
[5]. Reilly, Frank K., et al.: Investment Analysis & Portfolio Management. Cengage (2019).
[6]. Ross, Stephen A., et al.: Essentials of Corporate Finance. McGraw Hill LLC (2023).
[7]. MacroTrends: S&, P 500 Historical Annual Returns. https://www.macrotrends.net/2526/sp-500-historical-annual-returns, last accessed 2023.
[8]. Titman, Sheridan, et al.: Financial Management: Principles and Applications. Pearson (2014).
[9]. Tretina, Kat.: What Is a Market Index? Forbes, Forbes Magazine https://www.forbes.com/advisor/investing/stock-market-index/ (2022).
[10]. Young, Julie.: Market Index: Definition, How Indexing Works, Types, and Examples. Investopedia (2022).
Cite this article
Jiamu,X. (2023). The Analysis of the Stock Price of AAPL Based on the Comparison Between the Intrinsic Stock Price and Actual Stock Price. Advances in Economics, Management and Political Sciences,28,107-112.
Data availability
The datasets used and/or analyzed during the current study will be available from the authors upon reasonable request.
Disclaimer/Publisher's Note
The statements, opinions and data contained in all publications are solely those of the individual author(s) and contributor(s) and not of EWA Publishing and/or the editor(s). EWA Publishing and/or the editor(s) disclaim responsibility for any injury to people or property resulting from any ideas, methods, instructions or products referred to in the content.
About volume
Volume title: Proceedings of the 7th International Conference on Economic Management and Green Development
© 2024 by the author(s). Licensee EWA Publishing, Oxford, UK. This article is an open access article distributed under the terms and
conditions of the Creative Commons Attribution (CC BY) license. Authors who
publish this series agree to the following terms:
1. Authors retain copyright and grant the series right of first publication with the work simultaneously licensed under a Creative Commons
Attribution License that allows others to share the work with an acknowledgment of the work's authorship and initial publication in this
series.
2. Authors are able to enter into separate, additional contractual arrangements for the non-exclusive distribution of the series's published
version of the work (e.g., post it to an institutional repository or publish it in a book), with an acknowledgment of its initial
publication in this series.
3. Authors are permitted and encouraged to post their work online (e.g., in institutional repositories or on their website) prior to and
during the submission process, as it can lead to productive exchanges, as well as earlier and greater citation of published work (See
Open access policy for details).
References
[1]. Yahoo!: Apple Inc. (AAPL) Analyst Ratings. Estimates & Forecasts. Finance Yahoo!, 10 Feb. (2023).
[2]. Bodie, Zvi, et al.: Investments. McGraw-Hill Education (2021).
[3]. Fabozzi, Frank J., et al.: Investment Management. Prentice-Hall (1999).
[4]. FRED: Market Yield on U.S. Treasury Securities at 10-Year Constant Maturity. Quoted on an Investment Basis (2023).
[5]. Reilly, Frank K., et al.: Investment Analysis & Portfolio Management. Cengage (2019).
[6]. Ross, Stephen A., et al.: Essentials of Corporate Finance. McGraw Hill LLC (2023).
[7]. MacroTrends: S&, P 500 Historical Annual Returns. https://www.macrotrends.net/2526/sp-500-historical-annual-returns, last accessed 2023.
[8]. Titman, Sheridan, et al.: Financial Management: Principles and Applications. Pearson (2014).
[9]. Tretina, Kat.: What Is a Market Index? Forbes, Forbes Magazine https://www.forbes.com/advisor/investing/stock-market-index/ (2022).
[10]. Young, Julie.: Market Index: Definition, How Indexing Works, Types, and Examples. Investopedia (2022).