


1. Introduction
Apple’s success in the field of electronics sales is undeniable. Apple’s revenue has continued to grow from 2005 to the present. According to research (Curry) [1], Apple has grown its turnover from $3.2 billion to $120 billion in less than 20 years. In 2022, Apple’s annual revenue of $394 billion is much higher than that of its competitor Samsung ($245 billion) in the same year (Toh) [2]. According to research (Hilliard) [3], iPhone has a dominant position in the global smartphone retail industry and its market share is increasing year by year (see Fig. 1). This means that more and more consumers around the world are recognizing Apple’s goods, thus proving to a certain extent that success of Apple’s public marketing strategy. The objective of this paper is to analyze Apple’s business strategy to summarize the reasons for its success. First, the Marketing Theory of 4Ps will be used to explain why Apple’s products are becoming more and more popular with consumers. Second, SWOT will be used to explain why Apple has been able to maintain its sales leadership year after year in the retail industry with many competitors. Third, STP strategy will focus on Apple sales market analysis. Fourth, this part will highlight how Apple’s perfect supply chain help the company improve company resilience.
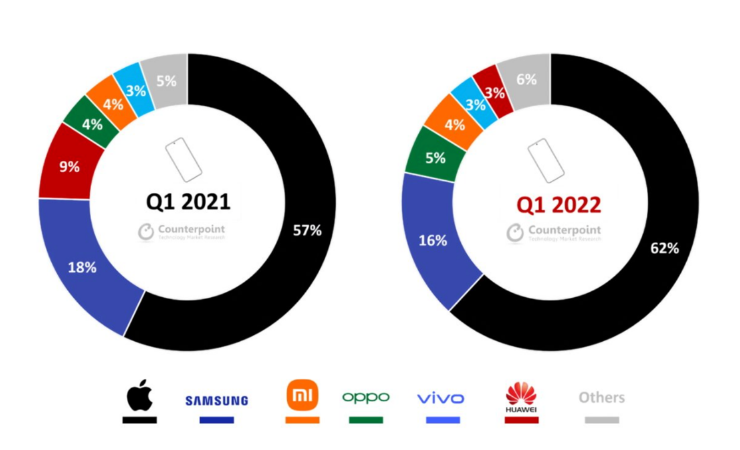
Figure 1: iPhone market share.
Image source: Counterpoint.
2. The Marketing Strategy Theory of 4Ps
The marketing Strategy Theory of 4Ps was proposed by American marketing scientist Jerry McCarthy in 1960. The essence of this theory is a combination of marketing strategies. The objective of using marketing mix can help company complete their goals in the targeted market (Philip) [4].
2.1. Product
Product is one of the most basic factors of 4Ps marketing theory. Products emerge to meet the needs of consumers. Therefore, in order to be more relevant to the needs of customers, the company has to produce products with uniqueness. There is no doubt that Apple’s products have product differentiation compared to its competitors. The main reason is that Apple has a unique operating system, like iOS. According to figure 2 (Mobile OS Share in North America 2018-2021, n.d.) [5], the number of iOS operating system users and Android system users basically spit the entire mobile operating system market equally. The operating system differentiation helps Apple to gain a big advantage in the market competition. In addition, the connectivity of Apple’s operating system allows all of the company’s products to work together. When users share an Apple account across all devices, all files and phots can be viewed. Android cannot guarantee to share files at all times. Rapid product updates also mean that Apple will continue to develop new technologies to attract customers to buy. Apple used 10 years to update 7 generations of smartphones, far beyond the development speed of other brands.
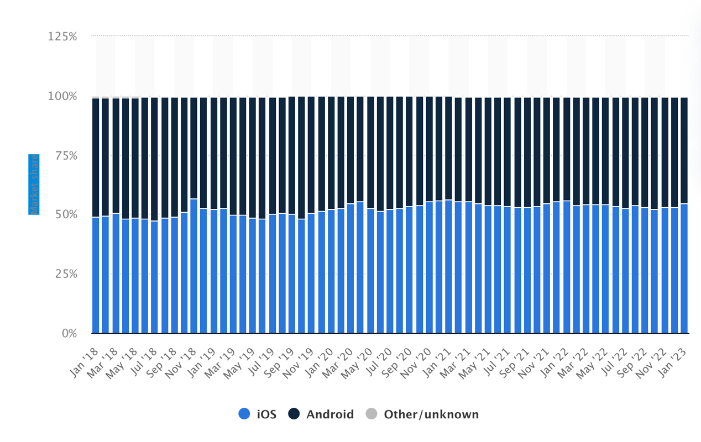
Figure 2: Market share of mobile operating system in USA.
Image source: Statista.
2.2. Price
Apple products are far more expensive than their counterparts, but Apple’s sales can still be far higher than other brands. According to figure 3 (Infographic: The Smartphone Price Gap, n.d.) [6], the unit price of iPhone is more $600, while other brands of smartphones are only $200.
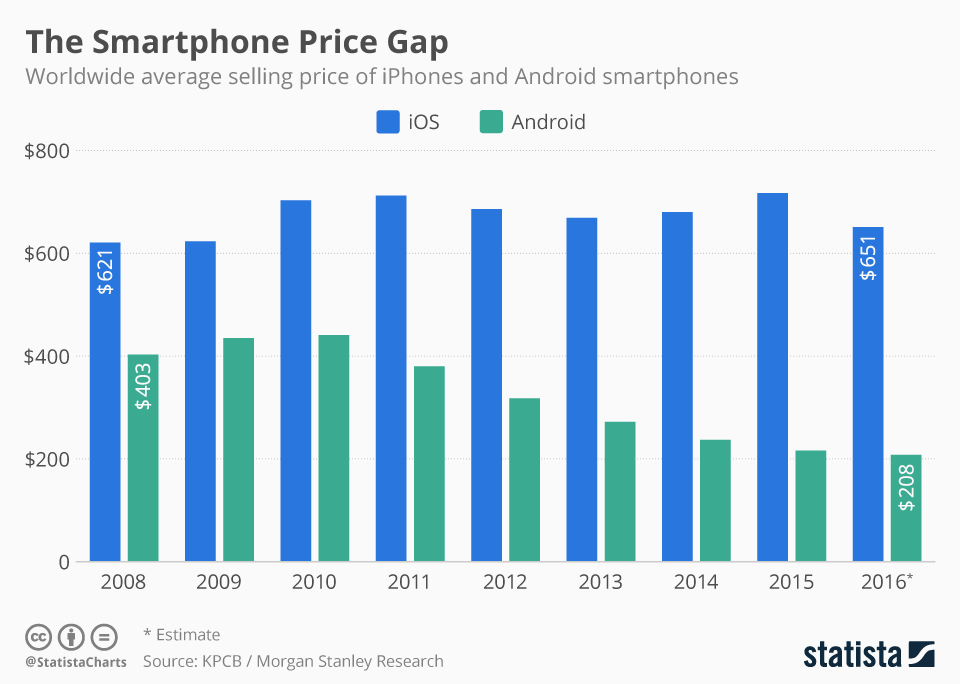
Figure 3: Smartphone price gap.
Image source: Statista.
The main reason for this phenomenon is that Apple’s pricing strategy is customer-driven pricing, which means the pricing of Apple products is determined by market demand. This can help the company make more profit compared to other brans’ cost-oriented pricing method. The cost-oriented pricing method is usually applied to some affordable brands, such as Xiaomi. The price of smartphone uses the cost plus the expected profit set by the company. Customer-driven pricing is a way for Apple to determine the price of its products based on the status of the company’s products in the minds of consumers. If customers are more interested in buying Apple products, the higher the price of Apple’s products will be.
The second pricing method is also one that Apple has used in the early years called market-skimming pricing. According to Hanif [7], the definition of market-skimming pricing is the company sells goods that have never been available in the market at a higher price and then gradually reduces the price of products over time. Apple’s iPod product was a success as soon as was introduced in 2001. The first generation of the product retailed at $399, which was a high-priced product even for Americans, but there were many customers willing to buy it. Apple thought it could still make more money, so within 6 months Apple launched another iPod with a larger capacity, priced at $499, which still sold very well.
2.3. Place
Apple has two main distribution places, one is the offline Apple Store and the other is the online store. The most important feature of Apple’s offline store location is the superior geographic location, the economic prosperity of the location as Apple Store. In other words, Apple Store could even become a local symbolic building. There are two main reasons for choosing sites in these locations: First, Apple clearly understands that its target customers are those with ultra-high spending levels. Secondly, when Apple builds offline stores, it blends technology with local culture to form a unique building that reflects Apple’s “Think Different” philosophy. In fact, the opening of offline stores allowed Apple to go from a net loss in 2001 to a net income of $65 million in 2002.
With the development of technology, more and more customers are accustomed to online shopping. Especially due to the outbreak of COVID-19, some offline Apple stores had to close, which stimulated the revenue of online stores. According to figure 4 (E-Commerce Net Sales of Apple.com from 2014 to 2022, n.d.) [8], the net sales of Apple remain at $25 billion before 2019. In contrast, in 2022, Apple’s e-commerce net sales are up to $57 billion.
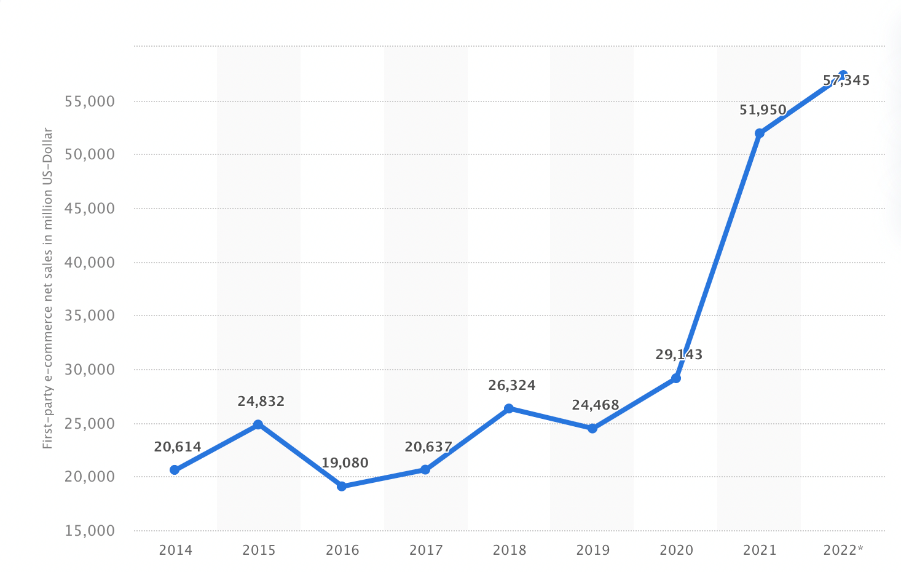
Figure 4: E-commerce net sales of apple.
Image source: Statista.
2.4. Promotion
In 2022, Apple teamed up with several famous American country musicians to create the “Apple Music Sessions”. These singers perform their classic works in a new way and these works will be exclusively collected by Apple Music. If fans of these artists want to hear these works, they will have to choose to buy Apple products. At the same time, Apple can also use the popularity of these singers to promote its products.
Another way that Apple advertises its products is through educational offers. At the beginning of each school year, Apple offers a discount for student who purchase iPads and MacBook. The broadest audience for Apple education offers is college student. College students are a group of young people who love pop culture and have the ability to lead in consumption. They represent the youngest consumer trend in a country during their school years and the 5-10 years after graduation. Once Apple’s education offer attracts college students to become its users, these students will bring these products into their work and life after graduation, and these young people represent the future consumer trend, so they will lead more people to become Apple users.
3. SWOT Analysis
SWOT strategy is a company’s ability to anticipate future growth through existing resources including internal and external (Namugenyi et al.) [9].
3.1. Strength
First, Apple’s revenue is no longer limited to the revenue generated by its iPhone, iPad, MacBook, but also includes revenue generated by Apple’s services and applications like iCloud and App Store. According to Richter [10], from the first quarter of 2014 to the second quarter of 2020, Apple's services revenue increased (see Fig. 5). Apple opened new markets in the creation of iPhone, iPad and MacBook, followed by the launch of the wearable device like Apple watch and other accessories like Airpods. Apple remains one of the most creative companies in the world.
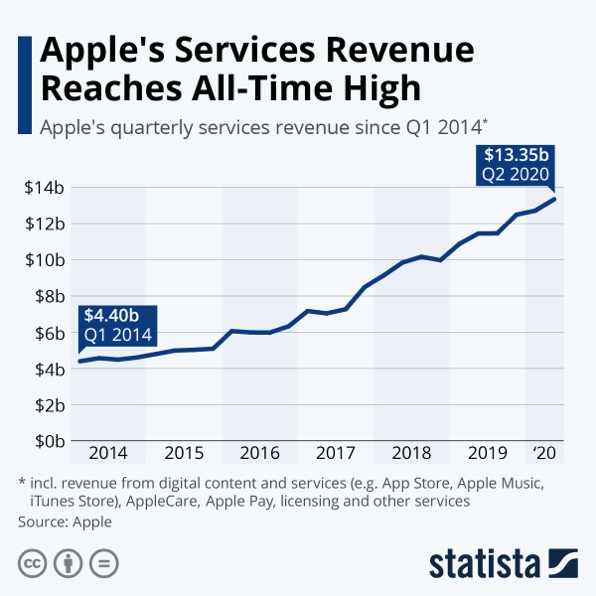
Figure 5: Apple’s services revenue.
Image source: Statista.
Second, the security of Apple operating system is very advantageous. According to Wise [11], in the comparison of these 6 aspects, the security of iOS is significantly better than Android (see Fig. 6).
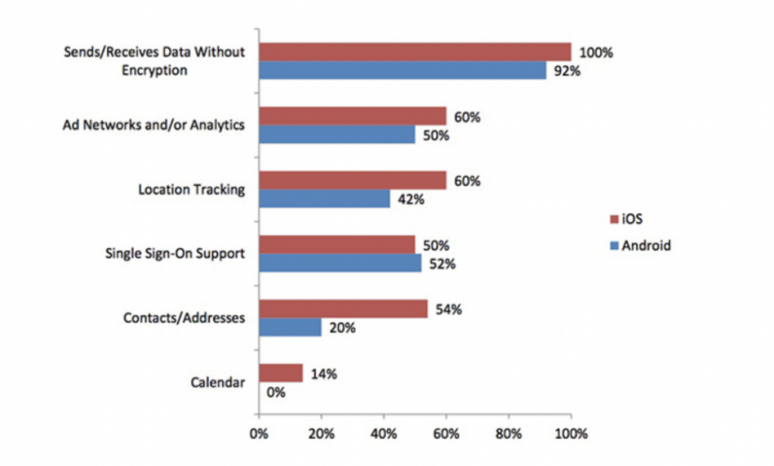
Figure 6: Mobile security—iOS vs. Android.
Image source: David Wise.
The only way to download software is from the Apple Store, and all applications on the Apple Store have to go through a rigorous review process, which means that a lot of malicious software is killed at the source by Apple. At the same time, Apple’s operating system grants very limited permissions to applications developers. Only with the users’ consent can these applications access the user’s geolocation, address book, etc. All of these methods are actions taken by Apple to protect the privacy of its customers.
3.2. Weakness
First, the price of Apple products is increasing year by year, which is very unfriendly to customers. Data show that the price of iPhone 11 is nearly $500 higher than the price of the iPhone 4 (How the Prices of Latest iPhones Today Got up to $999, n.d.) [12]. Although this strategy, which the price of Apple products is much higher than competitors, can bring greater returns in the short term, but in the long run, Apple is difficult to retain customers.
Second, Apple has lacked innovation in recent years. Apple, as the world’s top technology company, needs to invest a lot of money in technology research. According to Savitz [13], Apple spends only 2.2% of its total revenue on research, far less than what its competitors spend on research.
3.3. Opportunity
First, Apple can continue to develop new products in the future. Because of services revenue growing every year, Apple expects to launch TV streaming service, which to produce original programming and use it to compete for Emmy award and Oscars. Apple can continue to expand its product line, thus forming a complete operating system of all the company’s products. Once Apple forms its own complete system, users can share resources on all devices more easily and efficiently. This will be an advantage that another brand will not have. In addition, Apple could incorporate more scientific technology like AR, VR into wearable devices. Figure 7 shows that Apple’s wearable devices units grow every year (Above Avalon: Apple Has a Decade-Long Lead in Wearables, n.d.) [14], so this is a great opportunity for Apple to develop technology in the wearable industry.
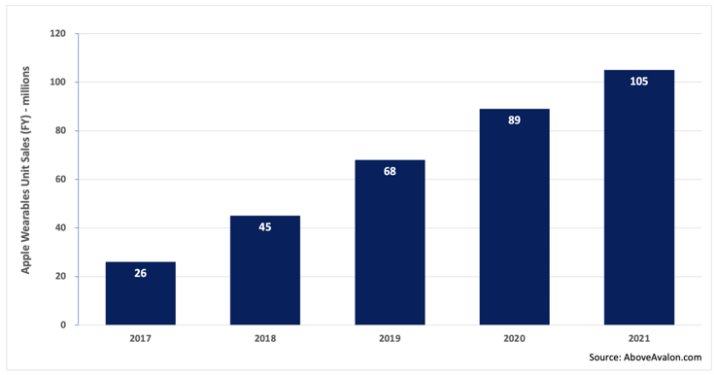
Figure 7: Apple wearables unit sales.
Source: AboveAvalon.com.
Second, Apple could open up entirely new markets in other areas, such as self-driving cars. Apple is seeking strategic partners to join the new industry. According to the research (Autonomous Vehicle Market Size, Share, Trends, Report 2022-2030, n.d.) [15], the global market for autonomous vehicle is valued at $126 billion this year. Over the next 10 years, the value of this market will be on an upward trend and by 2030, the market for self-driving cars will be worth $1808 billion. While it is limited to innovate the current technology, the potential for innovation in the new industry is enormous.
Third, Apple’s customer will be more diversified, especially for some people in developing countries. According to the distribution of iPhone users worldwide (5. The Distribution of the iPhone | Making of the iPhone, n.d.) [16], it is clear that the majority of consumers using Apple products are located in the more affluent regions of the world, like North America and Western Europe. The total number of iPhone users in these two regions accounts for 80% of the world’s iPhone users. Apple can look for potential developing countries, such as China, as targets to promote its products.
3.4. Threats
First, as a multinational company, the trade war poses significant risks to Apple’s operations and markets. Since apple’s products are mainly produced in Asia and the United States is the largest sales region for Apple’s products, a trade war between the two countries would lead to an increase in tariffs on Apple products, which would lead to higher prices for Apple products. Therefore, Apple need to do its best to rule out some uncontrollable factors that could cause the company’s sales to decline.
Second, in this field, Apple has a large number of competitors. For example, in the Chinese market, Apple’s biggest competitor is HUAWEI. Compared to iPhone, each series of HUAWEI smartphones have their own characteristics, which can meet the requirements of different people. While Apple’s products have uniformity and cannot meet a large number of people at the same time. In addition, due to some regional policies, many applications from the Apple Store are not available for download in China, which greatly reduced the customer’s experience. To solve this problem, Apple needs to establish its own bran’s unique advantages to attract customers to buy, but with the development of technology, such advantages are difficult to establish.
4. STP Strategy
Apple could achieve its strategic goals more easily if it can better target its customers. As experts (Levy et al.; Shapiro & Varian) [17] say, companies can only effectively apply strategic objectives if they understand exactly how their customers behave.
4.1. Segmentation
Segmentation refers to the division of customer groups according to different attributes to help companies better understand the requirements of their customers. Apple’s most typical segmentation approach is geographic segmentation. Figure 8 [18] clearly shows that Apple’s primary markets are the United States and Canada, which means that Apple prioritizes the preferences of customers in these regions in the production of its products. In addition, Apple makes changes to product features based on the behavioral habits of customers in different regions. For example, in 2018, Apple launched “Dual SIM Dual Standby” for the Chinese market. Since Chinese people are more used to separate their life and work, the demand for dual SIM cards is very high. This decision by Apple proved to be very correct. In 2019, the dual SIM iPhone XR became the most popular smartphone in the world.
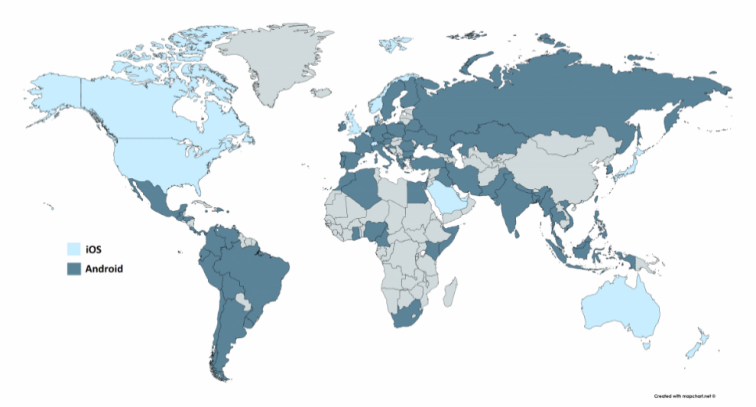
Figure 8: Which countries prefer Android, and which prefer iOS?
Image source: Device Atlas.
4.2. Targeting
The primary audience for Apple’s products is targeted at middle class and above customers who can afford to pay a higher price for the company’s products, especially those business people with independent financial resources. In addition, Apple’s products are also aimed at those young people who like to pursue fashion. For instance, the advent pf the iPod not only changed the way people listened to music at the time (from cassette taps to digital music), but also quickly became a hit with young people because of its stylish appearance.
4.3. Positioning
Apple is marketed as an innovative technology company, which is one of the main reasons for Apple’s high customer brand loyalty. Apple’s products have a unique operating system, and each series of Apple products has been changed from the previous ones. In addition, Apple updates the operating system from time to time to ensure a better user experience. Apple’s innovation is not only applied every product, but also to the brand’s logo. Apple’s logo has undergone several changes in order to attract customers through the most simple and recognizable way.
5. Supply Chain
Apple has been awarded “Supple Chain Master” for 10 consecutive years, and Apple’s CEO Tim Cook is also known as “Supply Chain Guru”. Therefore, Apple’s supply chain is also one of the reasons why Apple still has an absolute advantage among so many competitors. the most important feature of Apple’s inventory management is just-in-time (JIT). The core concept of the JIT production model is to Abdon the previous mass procurement of materials, mass production, and replace it with an order-driven production model. In other words, Apple produce and purchase only when there is a demand. This model effectively avoids inventory backlogs and saves inventory costs.
6. Conclusion
As one of the most successful companies in the technology field, Apple’s marketing strategy and management model have certain implications for other companies. Nowadays, Apple has become more than just a brand, but a symbol. It is through these effective strategies that Apple has been able to develop its brand over time.
References
[1]. Curry, D. Apple statistics (2021). Business of Apps. October 28, 2022. https://www.businessofapps.com/data/apple-statistics/.
[2]. CNN Business. Toh, M. Samsung profits sink to 8-year low as smartphone and PC demand drops. January 31 ,2023. https://edition.cnn.com/2023/01/30/tech/samsung-electronics-earnings-q4-2022-intl-hnk/index.html.
[3]. AppleInsider. Hilliard, W. iPhone dominates premium smartphone market with 62% of sales in Q1 2022. June 23, 2022. https://appleinsider.com/articles/22/06/23/iphone-dominates-premium-smartphone-market-with-62-of-sales-in-q1-2022.
[4]. Pearson Custom Publishing. Philip, K. Marketing Management, Millenium Edition. 2002.
[5]. Statista. Mobile OS share in North America 2018-2021. (n.d.). https://www.statista.com/statistics/1045192/share-of-mobile-operating-systems-in-north-america-by-month/.
[6]. Statista. Felix Richter. The Smartphone Price Gap. (n.d.). Statista Infographics. June 2, 20016. https://www.statista.com/chart/4954/smartphone-average-selling-prices/.
[7]. Hanif, M. Market Skimming Price: An Examination of Elements Supporting High Price for New Products in Pakistan. European Journal of Business and Management, Vol.6. 2014.
[8]. Statista. E-Commerce net sales of apple.com from 2014 to 2022. (n.d.). https://www.statista.com/forecasts/1218311/apple-revenue-development-ecommercedb.
[9]. Namugenyi, C., Nimmagadda, S. L., & Reiners, T. Design of a SWOT Analysis Model and its Evaluation in Diverse Digital Business Ecosystem Contexts. Procedia Computer Science, 159(159), 1145–1154. 2019. https://doi.org/10.1016/j.procs.2019.09.283.
[10]. Statista. Richter, F. Infographic: Apple’s Services Revenue Reaches All-Time High. Statista Infographics. May 4, 2020. https://www.statista.com/chart/14629/apple-services-revenue/.
[11]. One Click Root. Wise, D. Mobile Security Showdown - iOS vs Android. October 12, 2014. https://oneclickroot.com/android-security/mobile-security-showdown-ios-vs-android/.
[12]. Digital Information World. How The Prices Of Latest iPhones Today Got Up To $999. (n.d.). September 16, 2019. https://www.digitalinformationworld.com/2019/09/iphone-price-history.html.
[13]. Barron’s. Savitz, E. J. Apple Is Spending “Dramatically Below Peers” on Innovation. August 18, 2020. https://www.barrons.com/articles/apple-innovation-research-development-acquisitions-cash-flow-buybacks-51597786424.
[14]. Above Avalon. Apple Has a Decade-Long Lead in Wearables. (n.d.). May 27, 2021. https://www.aboveavalon.com/notes/2021/5/27/apple-has-a-decade-long-lead-in-wearables.
[15]. Precedence research. Autonomous Vehicle Market Size, Share, Trends, Report 2022-2030. (n.d.). https://www.precedenceresearch.com/autonomous-vehicle-market.
[16]. The Ohio State University. 5. The distribution of the iPhone | Making of the iPhone. (n.d.). April 6, 2015. U.osu.edu. https://u.osu.edu/iphone/the-distribution-of-iphone/.
[17]. Levy, M., Weitz, B. and Grewal, D. Retail Management (10th edition). McGrawHill. 2019.
[18]. DeviceAtlas. Android v iOS market share 2019. June 6, 2019. https://deviceatlas.com/blog/android-v-ios-market-share.
Cite this article
Zhang,R. (2023). Analysis of Apple’s Marketing Strategy and Management Model. Advances in Economics, Management and Political Sciences,29,24-32.
Data availability
The datasets used and/or analyzed during the current study will be available from the authors upon reasonable request.
Disclaimer/Publisher's Note
The statements, opinions and data contained in all publications are solely those of the individual author(s) and contributor(s) and not of EWA Publishing and/or the editor(s). EWA Publishing and/or the editor(s) disclaim responsibility for any injury to people or property resulting from any ideas, methods, instructions or products referred to in the content.
About volume
Volume title: Proceedings of the 7th International Conference on Economic Management and Green Development
© 2024 by the author(s). Licensee EWA Publishing, Oxford, UK. This article is an open access article distributed under the terms and
conditions of the Creative Commons Attribution (CC BY) license. Authors who
publish this series agree to the following terms:
1. Authors retain copyright and grant the series right of first publication with the work simultaneously licensed under a Creative Commons
Attribution License that allows others to share the work with an acknowledgment of the work's authorship and initial publication in this
series.
2. Authors are able to enter into separate, additional contractual arrangements for the non-exclusive distribution of the series's published
version of the work (e.g., post it to an institutional repository or publish it in a book), with an acknowledgment of its initial
publication in this series.
3. Authors are permitted and encouraged to post their work online (e.g., in institutional repositories or on their website) prior to and
during the submission process, as it can lead to productive exchanges, as well as earlier and greater citation of published work (See
Open access policy for details).
References
[1]. Curry, D. Apple statistics (2021). Business of Apps. October 28, 2022. https://www.businessofapps.com/data/apple-statistics/.
[2]. CNN Business. Toh, M. Samsung profits sink to 8-year low as smartphone and PC demand drops. January 31 ,2023. https://edition.cnn.com/2023/01/30/tech/samsung-electronics-earnings-q4-2022-intl-hnk/index.html.
[3]. AppleInsider. Hilliard, W. iPhone dominates premium smartphone market with 62% of sales in Q1 2022. June 23, 2022. https://appleinsider.com/articles/22/06/23/iphone-dominates-premium-smartphone-market-with-62-of-sales-in-q1-2022.
[4]. Pearson Custom Publishing. Philip, K. Marketing Management, Millenium Edition. 2002.
[5]. Statista. Mobile OS share in North America 2018-2021. (n.d.). https://www.statista.com/statistics/1045192/share-of-mobile-operating-systems-in-north-america-by-month/.
[6]. Statista. Felix Richter. The Smartphone Price Gap. (n.d.). Statista Infographics. June 2, 20016. https://www.statista.com/chart/4954/smartphone-average-selling-prices/.
[7]. Hanif, M. Market Skimming Price: An Examination of Elements Supporting High Price for New Products in Pakistan. European Journal of Business and Management, Vol.6. 2014.
[8]. Statista. E-Commerce net sales of apple.com from 2014 to 2022. (n.d.). https://www.statista.com/forecasts/1218311/apple-revenue-development-ecommercedb.
[9]. Namugenyi, C., Nimmagadda, S. L., & Reiners, T. Design of a SWOT Analysis Model and its Evaluation in Diverse Digital Business Ecosystem Contexts. Procedia Computer Science, 159(159), 1145–1154. 2019. https://doi.org/10.1016/j.procs.2019.09.283.
[10]. Statista. Richter, F. Infographic: Apple’s Services Revenue Reaches All-Time High. Statista Infographics. May 4, 2020. https://www.statista.com/chart/14629/apple-services-revenue/.
[11]. One Click Root. Wise, D. Mobile Security Showdown - iOS vs Android. October 12, 2014. https://oneclickroot.com/android-security/mobile-security-showdown-ios-vs-android/.
[12]. Digital Information World. How The Prices Of Latest iPhones Today Got Up To $999. (n.d.). September 16, 2019. https://www.digitalinformationworld.com/2019/09/iphone-price-history.html.
[13]. Barron’s. Savitz, E. J. Apple Is Spending “Dramatically Below Peers” on Innovation. August 18, 2020. https://www.barrons.com/articles/apple-innovation-research-development-acquisitions-cash-flow-buybacks-51597786424.
[14]. Above Avalon. Apple Has a Decade-Long Lead in Wearables. (n.d.). May 27, 2021. https://www.aboveavalon.com/notes/2021/5/27/apple-has-a-decade-long-lead-in-wearables.
[15]. Precedence research. Autonomous Vehicle Market Size, Share, Trends, Report 2022-2030. (n.d.). https://www.precedenceresearch.com/autonomous-vehicle-market.
[16]. The Ohio State University. 5. The distribution of the iPhone | Making of the iPhone. (n.d.). April 6, 2015. U.osu.edu. https://u.osu.edu/iphone/the-distribution-of-iphone/.
[17]. Levy, M., Weitz, B. and Grewal, D. Retail Management (10th edition). McGrawHill. 2019.
[18]. DeviceAtlas. Android v iOS market share 2019. June 6, 2019. https://deviceatlas.com/blog/android-v-ios-market-share.