


1 Introduction
While Markowitz advanced the portfolio theory which include two important elements: mean-variance model and efficient frontier. From then on, the portfolio theory were widely used, For the investor, most of them are loss-averse, Mi and Zhang proposed if the benchmark lower limit constraint is considered, its investment strategy is relatively conservative, which can avoid large losses caused by mutations [1], while Wang and He considering the optimal combination of "disappointment" and "regret" emotions is more stable than the combination of only "disappointment" emotions which more in line with the investment psychology of investors [2]. Moreover, portfolio theory also play an important role in different markets, along with the development of the international trade, Zhu gave the theoretical optimal adjustment of the reserve structure [3]. The portfolio theory is also used into the theory of financial futures and option derivative securities and analyzes the difficulties of risk control in securities management [4].
We find that nowadays, many scholars focus on the portfolio selection, few research aim to technology stocks. Under the assumption that investors have high loss aversion and weak risk tolerance, most of papers are based on the overall market environment. Yuan and Liu researched the impact of financial opening on the fixed assets and financial assets portfolios of real economy enterprises at different levels [5]. Li and Teo researched portfolio optimization based on the uncertain financial market [6], while Li analysed portfolio theory under the policy positive background [7]. Moreover, Kenig analyzed portfolio selection in non-stationary environment [8]. Meanwhile, some scholars studied in different areas under various financial market environment. Liu and Chen pay attention to the oil industry which is known for its high risk, constantly faces major problems in project selection and capital allocation [9], while Chen aim to analyze portfolio selection of new energy industry [10]. But few scholars are focus on portfolio creating of technology stocks. So, our goal is to select the optimal construction of the portfolios of the five representative companies in the technology industry and the portfolio construction after adding the risk-free assets.
The whole process can be summarized as follow. At first, we choose 5 companies in technology industry i.e., Tencent, China Mobile, Techtronic Industries Co Ltd, Sunny Optical Technology Group Co Ltd and Lenovo. And we collect the data of stocks in Hang Seng index. Second, we use Fama experiement to make sure all the stocks are without idiosyncratic risk. Third, we construct certain portfolios with risky assets by the select securities, i.e., the maximum sharpe ratio portfolio and minimum variance portfolio, the results show that the China Mobile occupies the the most weight in the portfolio. Fourth, we construct certain portfolios without risky assets, i.e., the maximum Sharpe ratio portfolio and minimum variance portfolio, the results show that the C.M and Sunny occupy the most weight in the portfolio. At last, we contrast the two cases, we find that both maximum return portfolios have the high return, and the portfolio contains risk-free assets is higher than portfolios without risk-free assets both in the maximum return portfolio, but lower in the maximum Sharpe ratio portfolio.
2 Methods
2.1 Fama Experiment
Fama experiment is a mathematical method for eliminate idiosyncratic risk which refers to the inherent factors that can badly impact the portfolio. When the number of stocks in the portfolio reaches a certain number, the trait risk will disappear, and the portfolio will only face systemic risk. So Fama experiment is used by investors to reduce uncertain risk and decide the appropriate quantity of portfolios. As the number of assets increase, idiosyncratic risk gradually equals to 0, while the total risk and systematic risk will slowly decrease. When the total risk of portfolio equals to systematic risk, which means the portfolio is only affected by systematic risk, idiosyncratic risk equals to 0, number of assets in the trial portfolio at this time means the lowest number of assets in the portfolio.
2.2 Mean-Variance
Rubinstein states that the mean-variance analysis has been a standard method for measuring and constructing asset portfolios [11]. The mean-variance analysis is a mathematical method for evaluating risk, as indicated by variance, to expected return. The mean-variance analysis is used by investors to make investment decisions. They might evaluate the amount of risk they are prepared to assume in return for various degrees of reward. Then, maximise the anticipated profit or minimise the risk. Overall, the portfolio could be expressed by,
\( Portfolio=\sum _{i=1}^{5}{α_{i}}{X_{i}}{{+D∗{ α_{6}}r_{f}}={α_{1}}X_{1}}+{{α_{2}}X_{2}}+{{α_{3}}X_{3}}{+ {α_{4}}X_{4}}{+{ α_{5}}X_{5}}{+D∗{ α_{6}}r_{f}} \) | (1) |
Where αi are the weights and Xi are the assets, i=1(‘Tencent’), 2(‘C.Mobile’), 3(‘Techron’), 4(‘Sunny’), 5(‘Lenovo’). D is a dummy variable which could be 1 or 0. This category into two cases: (1) D=0, the portfolio is made by five risky assets only; (2) D=1, the portfolio is established by five risky assets and one risk-free asset. The sum of weights of each asset must equal to 1. The expected return of an asset is the overall average return through the time series.
\( E[{X_{i}}]=\frac{{X_{i}}{|_{t=1}}+{X_{i}}{|_{t=2}}+{X_{i}}{|_{t=3}}…+{X_{i}}{|_{t=n}}}{n periods} \) | (2) |
When we calculated the weights and the mean return of each asset, we could find out the expected return, variance, and Sharpe ratio of our portfolio. The mean return of the portfolio is the weighted average by assets return:
\( E[Portfolio]=\sum _{i=1}^{5}{α_{i}}E[{X_{i}}]={α_{1}}E[{X_{1}}]+{α_{2}}E[{X_{2}}]+{α_{3}}E[{X_{3}}]{+ α_{4}}E[{X_{4}}]+{α_{5}}E{[X_{5}}] \) | (3) |
The variance of the portfolio is the sum of the asset covariances times their weighed.
\( VAR[Portfolio]=\sum COV[{X_{i}}∗{X_{j}}]∗{Weigℎt_{i}}∗{Weigℎt_{j}} \) | (4) |
While we get the mean and variance, the Sharpe Ratio is expressed by:
\( Sℎarpe Ratio= \frac{E[{X_{i}}]−rf}{sd[{X_{i}}]} \) | (5) |
3 Results
3.1 Fama Experiment for Portfolio
Idiosyncratic risk refers to the inherent factors that can negatively impact individual securities or a very specific group of assets [12]. Idiosyncratic risk occurs due to the fact that each firm has its own unique strengths and weaknesses, competitive landscape, management style, and external threats. It can be managed by adding more assets to a portfolio that can offset the distinctive risks of certain stocks. Thus, Fama-Experiment tested at least how many assets need to be chosen to to mitigate idiosyncratic risk. Figure 1 indicates in dark grey the systematic risk, in light grey the idiosyncratic risk. Since grey shaded tends to be stable when n = 5, thus at least 5 stocks must be chosen to deal with the idiosyncratic risk.
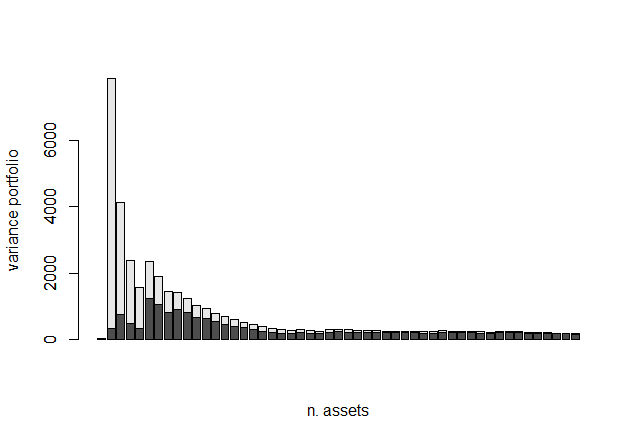
Figure 1. Fama Experment Results
3.2 Maximum Return Portfolio
Investors differ in the amount of risk they are willing to take for a given return. Investors who are risk-averse require a greater return for a given amount of risk than a risk lover [13]. The efficient frontier is a graphical representation of portfolios that maximise returns for specific level of risk. The portfolio's investment combinations determine the portfolio's returns. The standard deviation of a security is associated with its risk.
Table 1. Maximum Return portfolio and five stocks returns
‘Tencent’ | ‘C.Mobile' | 'Techron' | 'Sunny.' | 'Lenovo' | |
Asset return mean | 0.0220 | -0.0016 | 0.0266 | 0.0470 | 0.0095 |
Weighted(without rf) | 132.97% | -226.56% | 135.78% | 168.05% | -110.24% |
Table 2. Maximum Return portfolio including one risk-free asset
RF | ‘Tencent’ | ‘C.Mobile' | 'Techron' | 'Sunny.' | 'Lenovo' | |
Mean | 0.0167 | 0.0220 | -0.0016 | 0.0266 | 0.0470 | 0.0095 |
Weighted(with rf) | -451.32% | 146.87% | -212.14% | 247.82% | 351.90% | 124.47% |
The efficient frontier comprises investment portfolios that offer the highest expected return for a specific level of risk [14]. Thus, we only invest the portfolios on the efficient outlier, that is, under the same variance, portfolios with higher returns should be chosen. Also, we controlled the mean return should be greater than 4.7%, otherwise, the portfolio is 100% weighted in ‘Sunny’. Under this treatment, table 1 indicates, 'Tencent has the largest weight in the maximum return portfolio, accounting for 132.97%, and ‘C.Mobile’ has the least weight due to its negative return. Thus, the maximum return portfolio with five risky assets would be 15.46%, which is higher than any risky assets themselves. The negative 226.56% for ‘C.Mobile’ means we should short the asset with leverage.
Including risk-free rate, we controlled that the rate of return must greater than rf ratio= 1.67%. Under this treatment, the table 2 indicates, taking risk-free rate into account, weighed of ‘Tencent’ and ‘Techron’ will be more and we short less weighed of ‘C.Mobile’. These chances are affected by the return of risk-free rate with only 1.67%, thus we short 451.32% rf by leverage to get a higher return of 16.25% for our new portfolio.
3.3 Minimum Variance Portfolio
The minimum-volatility anomaly or the low-risk effect suggests that the assets with low volatility could get higher returns than the assets with high volatility [15]. Assume a risk-seeking investor selects assets using the efficient frontier. The investor would choose stocks that are located on the right side of the efficient frontier. The right end of the efficient frontier consists of assets that are anticipated to have a high degree of risk and high potential returns, making them ideal for investors with a high risk tolerance. In contrast, assets located on the left end of the efficient frontier would be excellent for investors who are risk-averse. The efficient frontier consists of investment portfolios with the best projected rate of return for a given amount of risk.
Table 3. Minimum Variance portfolio and five stocks returns
‘Tencent’ | ‘C.Mobile' | 'Techron' | 'Sunny.' | 'Lenovo' | |
Sharpe Ratio | 0.0876 | 0.0501 | 0.0931 | 0.1366 | 0.1027 |
Weighted (without rf) | 22.55% | 32.94% | 27.23% | 19.69% | -24.23% |
As the table 3 indicates, 'C.Mobile' has the least weight in the minimum Variance portfolio, accounts for 0.0501, and ‘Lennovo’ has the least weight since it has the largest variance than other assets. Thus, the minimum variance portfolio with five risky assets would be 0.0467, which should be less than any other risky assets. While considering the risk-free rate into account, the portfolio constructed with five risky assets and one risk-free asset with the minimum variance must be 100% invested in the risk-free rate. This is because the risk-free rate has 0 variances since it is the rate of return provided by an investment with no risk. Every financial item involves some risk, no matter how tiny. Hence minimum variance portfolio is a risk-free rate itself with a return of 2% per annual.
3.4 Maximum Sharpe Ratio Portfolio
Maximum Sharpe Portfolio is a portfolio positioned at the point where a line from (0, risk-free rate) is tangent to the efficient frontier. The portfolio is suitable for investors with stable growth expectations and a low appetite for risk.
Table 4. Maximum Sharpe ratio portfolio and five stocks returns
‘Tencent’ | ‘C.Mobile' | 'Techron' | 'Sunny.' | 'Lenovo' | |
Sharpe Ratio | 25.15% | -3.13% | 28.51% | 34.40% | 9.27% |
Weighted (without rf) | 73.68% | -100% | 73.68% | 73.68% | -21.05% |
Table 5. Maximum Sharpe ratio portfolio including one risk-free asset
RF | ‘Tencent’ | ‘C.Mobile' | 'Techron' | 'Sunny.' | 'Lenovo' | |
Sharpe Ratio | Not exist | 25.15% | -3.13% | 28.51% | 34.40% | 9.27% |
Weighted (with rf) | 21.18% | 21.49% | -31.49% | 20.31% | -6.58% | 75.08% |
As the table 4 indicates, 'Sunny' has the largest weight in maximum Sharpe ratio portfolio, accounts for 34.40%, and ‘C.Mobile’ has the least weight due to its negative sharpe ratio. Thus, the maximum sharpe ratio portfolio with five risky assets would be 43.03%, which is higher than any risky assets itself. As the table 5 indicates, taking risk-free rate into account, weighed of each asset would be change. Since risk free rate does not have Sharpe ratio due to the 0 variance, we short less weighted of ‘C.Mobile’. Finally, the maximum Sharpe ratio of new portfolio will be 42.02%, with 1.01% less than portfolio without rf.
4 Discussion
The benefits of technology equities on the Hong Kong market are mostly centred in the Internet sector, where homegrown Internet businesses dominate. They can be employed as high-quality assets for long-term allocation in the long run. All of them possess pretty advanced technology and are uncommon in Hong Kong listings. Due to the influence of COVID19 on the industry, the stock price has recently seen a significant drop, and its short-term profitability has been under pressure. However, the company's strategy for medium- and long-term growth remains unchanged. Profits generated in the short term can be invested in the company's growth throughout the medium and long terms. In terms of average market capitalisation, the communications industry is the leading economic sector (telecommunications business). In this business, "China Mobile" has the largest market value, reaching about 1,709.7 billion Hong Kong dollars, which is greater than five times the market value of "China Telecom" and greater than fifty percent of the market value of "Tencent". (Li Fang, 2021) Moreover, the value is supported by solid performance. China Mobile's profit margin has reached 15.35 percent over the last year, and its net profit has reached an astounding 127.1 billion Hong Kong dollars, which is more than 2.6 times that of Tencent. More than six times the net profit, but its stock price performance over the past year has been unsatisfactory, falling -14.58 percent. This is in stark contrast to the "Tencent" stock price, which has risen 61.35 percent. This demonstrates that investors consider a company's development potential and growth space in addition to its profitability and cash flow. The callback facilitates the digestion of high values and possesses a particular allocation value. With the return of Chinese concept stocks, the weight of new economic industries represented by "Internet" is anticipated to expand further in Hong Kong stocks.
5 Conclusion
We apply the Fama-Experiment to determine the minimum number of equities required for portfolio construction. The majority of portfolio research is currently focused on an investigation of overall market conditions or a particular industry. Our study's objective is to conduct a portfolio analysis of the technology industry to assist potential investors in making investment decisions. In the research, we employ time-series analysis to determine the anticipated asset allocation data. The mean-variance analysis is then used to optimise the portfolio and design one with the highest return, lowest volatility, and highest Sharpe ratio. Portfolios should be built around technology companies in Hong Kong.
References
[1]. Mi, H., Zhang, S. G.: Dynamic portfolio selection of loss-aversion investors under wealth constraints. System Engineering Theory and Practice, 33(5), 9(2013).
[2]. Wang, Z. R., H, T. T.: Portfolio selection research under "disappointment" and "regret" sentiment. Journal of Systems Engineering, 36 (6), 11(2021).
[3]. Zhu, S. Z.: Analysis of the portfolio risk and return of China's foreign exchange reserves. Shanghai Finance (7), 3(2002).
[4]. James, Jr. L. F., Walter. J. R.: Investment Portfolio Management Theory and Its Application. China Machinery Industry Press (2000).
[5]. Yuan, S. G., Liu, L. F.: Study on the influence of financial opening on enterprise fixed assets and financial asset portfolio. Nankai Economic Research (1), 18 (2022).
[6]. Li,B., Teo, K. L.: Portfolio optimization in real financial markets with uncertainty and randomness. The Applied Mathematical Model, 100,125-137(2021).
[7]. Li, H.: Xinjiang plate stock portfolio in the favorable policy can outperform the market? Financial modeling and quantitative investment application of —— based on non-normal yield distribution. (2015-3),82-87 (2021).
[8]. Kenig, E.: Portfolio selection in non-stationary markets.Algorithm Finance, (preprint), 1-13.
[9]. Liu, J. L., Chen, L. H. Hao, J. C.: Oil Industry Portfolio Optimization Model Method Based on Fuzzy Decision Theory. Industrial Engineering, 8 (4), 4 (2005).
[10]. Chen, W. J. Research on Investment Optimization Model of New Energy Power Generation Enterprises. (Doctoral dissertation, North China Electric Power University) (2012).
[11]. Rubinstein, M.: Markowitz's " Portfolio Selection: a 50-year retrospective. Financial Journal, 57 (3), 1041-1045(2002).
[12]. Li. B., Rajgopal. S., Venkatachalam. M.: The r2 and the special risk are not interchangeable. Accounting Review, 89 (6), 2261-2295(2014).
[13]. William D.: Financial management: Are you risk or loss aversion? The Daily Record, The New York Times (Rochester, New York) (2010).
[14]. Das. S., Markowitz. H., Scheid,J., Statman,M.: Portfolio Optimisation & Psychological Account. Journal of Financial and Quantitative Analysis, 45 (2), 311-334(2010).
[15]. Lv, Z., Chu, A. M. Y, Wong, W. K., Chiang, T. C.: Maximum return and minimum volatility effect: Evidence of choosing risky and risk-free assets to form a portfolio. Risk Management, 23 (1-2), 97-122 (2021).
Cite this article
Deng,D.;Zheng,J. (2023). Portfolio Optimization for Five Influencing Companies of Technology Industry in the Hong Kong Stock Market. Advances in Economics, Management and Political Sciences,4,548-553.
Data availability
The datasets used and/or analyzed during the current study will be available from the authors upon reasonable request.
Disclaimer/Publisher's Note
The statements, opinions and data contained in all publications are solely those of the individual author(s) and contributor(s) and not of EWA Publishing and/or the editor(s). EWA Publishing and/or the editor(s) disclaim responsibility for any injury to people or property resulting from any ideas, methods, instructions or products referred to in the content.
About volume
Volume title: Proceedings of the 6th International Conference on Economic Management and Green Development (ICEMGD 2022), Part Ⅱ
© 2024 by the author(s). Licensee EWA Publishing, Oxford, UK. This article is an open access article distributed under the terms and
conditions of the Creative Commons Attribution (CC BY) license. Authors who
publish this series agree to the following terms:
1. Authors retain copyright and grant the series right of first publication with the work simultaneously licensed under a Creative Commons
Attribution License that allows others to share the work with an acknowledgment of the work's authorship and initial publication in this
series.
2. Authors are able to enter into separate, additional contractual arrangements for the non-exclusive distribution of the series's published
version of the work (e.g., post it to an institutional repository or publish it in a book), with an acknowledgment of its initial
publication in this series.
3. Authors are permitted and encouraged to post their work online (e.g., in institutional repositories or on their website) prior to and
during the submission process, as it can lead to productive exchanges, as well as earlier and greater citation of published work (See
Open access policy for details).
References
[1]. Mi, H., Zhang, S. G.: Dynamic portfolio selection of loss-aversion investors under wealth constraints. System Engineering Theory and Practice, 33(5), 9(2013).
[2]. Wang, Z. R., H, T. T.: Portfolio selection research under "disappointment" and "regret" sentiment. Journal of Systems Engineering, 36 (6), 11(2021).
[3]. Zhu, S. Z.: Analysis of the portfolio risk and return of China's foreign exchange reserves. Shanghai Finance (7), 3(2002).
[4]. James, Jr. L. F., Walter. J. R.: Investment Portfolio Management Theory and Its Application. China Machinery Industry Press (2000).
[5]. Yuan, S. G., Liu, L. F.: Study on the influence of financial opening on enterprise fixed assets and financial asset portfolio. Nankai Economic Research (1), 18 (2022).
[6]. Li,B., Teo, K. L.: Portfolio optimization in real financial markets with uncertainty and randomness. The Applied Mathematical Model, 100,125-137(2021).
[7]. Li, H.: Xinjiang plate stock portfolio in the favorable policy can outperform the market? Financial modeling and quantitative investment application of —— based on non-normal yield distribution. (2015-3),82-87 (2021).
[8]. Kenig, E.: Portfolio selection in non-stationary markets.Algorithm Finance, (preprint), 1-13.
[9]. Liu, J. L., Chen, L. H. Hao, J. C.: Oil Industry Portfolio Optimization Model Method Based on Fuzzy Decision Theory. Industrial Engineering, 8 (4), 4 (2005).
[10]. Chen, W. J. Research on Investment Optimization Model of New Energy Power Generation Enterprises. (Doctoral dissertation, North China Electric Power University) (2012).
[11]. Rubinstein, M.: Markowitz's " Portfolio Selection: a 50-year retrospective. Financial Journal, 57 (3), 1041-1045(2002).
[12]. Li. B., Rajgopal. S., Venkatachalam. M.: The r2 and the special risk are not interchangeable. Accounting Review, 89 (6), 2261-2295(2014).
[13]. William D.: Financial management: Are you risk or loss aversion? The Daily Record, The New York Times (Rochester, New York) (2010).
[14]. Das. S., Markowitz. H., Scheid,J., Statman,M.: Portfolio Optimisation & Psychological Account. Journal of Financial and Quantitative Analysis, 45 (2), 311-334(2010).
[15]. Lv, Z., Chu, A. M. Y, Wong, W. K., Chiang, T. C.: Maximum return and minimum volatility effect: Evidence of choosing risky and risk-free assets to form a portfolio. Risk Management, 23 (1-2), 97-122 (2021).