


1. Introduction
Since the Japanese bubble crisis in the 1990s, Japan has been in an economic environment of low demand, low inflation and sluggish growth. In order to address Japan's chronic deflation and sluggish economic growth, the Japanese government has adopted policies of zero interest rates, quantitative easing, quantitative and qualitative easing and negative interest rates [1].
However, the introduction of a negative interest rate policy accompanied by a decline in short-term policy rates has brought about considerable risk and negative impact on the financial markets. Some Japanese companies have stopped buying money management funds (MMF) in the short-term market, making it more difficult to operate in the financial fund market. Commercial banks' earnings also decreased as the interest rate differential between deposits and loans narrowed. In addition, financial institutions such as insurance companies and pension funds, which operate mainly with long-term funds, have had difficulty operating in the ultra-low interest rate environment and have announced the cessation of sales of single-pay whole life insurance products. In order to avoid excessive downward movement of the yield curve and excessive leveling and to stabilize the financial system, in September 2016, the Bank of Japan began to implement a yield curve control policy (YCC) [2]. The YCC policy, whereby the Japanese government controls both short-term and long-term interest rates by continuously purchasing government bonds in the secondary market, maintains the yield on short-term government bonds at -0.1% and the yield on 10-year government bonds at 0%, with a daily floating ceiling of no more than 0.25%.
The launch of the YCC has had some positive effects on the economy. For example, the price level in Japan has emerged from negative growth and continued to perform positively, the trade surplus has persisted and the employment environment has improved significantly. However, since its implementation, the YCC has faced controversies such as unclear policy signals, arbitrage distortions and monetization of the fiscal deficit [3]. Since 2022, global inflationary pressures have continued to increase and international financial markets have been severely volatile. As the Japanese government purchases government bonds (JGB) with ten-year maturities and below, resulting in higher yields on JGB with ten-year maturities and above, the YCC has reduced the attractiveness of JGB and exacerbated the depreciation of the yen while maintaining government bond yields at low levels and effectively resisting deflationary risks [4]. The yen remains under pressure to depreciate against the backdrop of continued interest rate hikes by the Federal Reserve [5].
Japanese yen assets are a mecca for arbitrage trading for global funds. the YCC creates an arbitrage opportunity in an otherwise friction less and arbitrage free government bond market, where yields on assets available for investment in Japan are chronically low and low interest rates on the yen provide liquidity to international markets [6]. Financial institutions can take advantage of this opportunity. This arbitrage created a transfer of wealth from the Bank of Japan to these financial institutions, allowing investors in Japan and abroad to borrow funds to buy assets overseas at almost zero cost [7]. As of March 2021, the size of the Japanese bond market reached 128.5 billion, making it the third largest in the world and the second largest in Asia. Foreign investors' positions in Japanese bonds are mostly dominated by government bonds, with up to 79% of the size of their positions. Moreover, due to the low-risk nature of Japanese government bonds, they are the preferred choice for global safe-haven funds. Under the YCC expansionary fiscal policy, the structure of the Japanese bond market is highly unbalanced, with the ratio of the size of the government bond market reaching 83% [8]. As can be seen, the Japanese government bond market is closely linked to the global financial markets. However, due to the Japanese government's long-standing YCC policy, the Japanese government bond market has long suffered from distorted market pricing and an abnormal state of the yield curve. The deficiencies of the Japanese government bond market itself have also affected the international bond market to a certain extent [9]. At the December 2022 monetary policy meeting, the Japanese government announced a revision to its YCC policy, raising the yield target to plus or minus 0.5%, an action that triggered a short-lived shock in international markets [10].
Despite the shortcomings of the YCC, the Bank of Japan stated at its January meeting that it would continue its yield curve control program due to realistic considerations of financial environment and inflation stability as well as political factors [11]. The study of Japan's YCC has important implications for the implementation of prudent monetary policy in countries around the world. This paper examines the impact of the YCC on inflation in the light of its implementation in Japan and analyses the reasons for the unsatisfactory implementation of the YCC policy in the context of Japan's national circumstances.
2. Methods
2.1. Data Source
In order to ensure the accuracy and authority of the data, the monthly data of CPI, the consumer price index used in this paper are obtained from the Organization for Economic Co-operation and Development. The annual data of CPI are obtained from the International Monetary Fund. Inflation is defined as a general and sustained increase in the price level. CPI is an important macroeconomic indicator that reflects changes in the price level of consumer goods and services related to people's lives and is an important indicator of inflation. This paper uses the CPI to measure inflation in Japan.
2.2. Selection and Description of Indicators
Monthly CPI data and personal deposits in this paper are taken from April 1, 2013 to March 1, 2023 for a total of 120 months due to the different timing and methodology of each data. Annual CPI and population ageing share are taken for a total of 41 years from 1980 to 2020. For Japan, 33 years of data from 1990 to 2022 are used for the average wage level.
2.3. Granger Causality Test
The Granger causality test was created by Clive W. J. Granger and is used to analyze the causal relationship between individual economic variables. It is applied to predict and analyze economic variables by using the variance of the best least squares prediction of all information at past points in time. The Granger causality test model is:
\( {Y_{t}}=\sum _{i=1}^{m}{α_{i}}{X_{t-i}}+\sum _{i=1}^{m}{β_{i}}{Y_{t-i}}+{μ_{1t}} \) (1)
\( {X_{t}}=\sum _{i=1}^{m}{γ_{i}}{Y_{t-i}}+\sum _{i=1}^{m}{δ_{i}}{X_{t-i}}+{μ_{2t}} \) (2)
Original hypothesis 1: "X is not a Granger cause of Y" is equivalent to:
\( {H_{0}}:{α_{1}}={α_{2}}=⋯={α_{m}}=0 \) (3)
Original hypothesis 2: "Y is not a Granger cause of X" is equivalent to:
\( {H_{0}}:{γ_{1}}={γ_{2}}=⋯={γ_{m}}=0 \) (4)
The Granger test is a two-way test, completed by a constrained F-test, with the following test statistic constructed:
\( F=\frac{({RSS_{R}}-{RSS_{U}})/m}{{RSS_{U}}/(n-k)} \) (5)
If \( F \lt {F_{α}}(m,n-k) \) ,accept the original hypothesis; if \( F \gt {F_{α}}(m,n-k) \) , then the original hypothesis is rejected.
After regression analysis of the variables, the significance is observed to determine whether there is a causal effect. However, the results of the Granger causality test refer to causality in a statistical sense, not necessarily true causality, so the results need to be viewed in the context of a macro perspective. In this paper, the Eviews default lag period of 2 is chosen and the original hypothesis is accepted when the concomitant probability is greater than 0.10 and a causal relationship can be assumed not to exist.
3. Results and Conclusion
As shown in Figure 1, Japan's CPI rose steadily between 2010 and 2014, turned from negative to positive and then fell sharply, dropping back to 0 in early 2016. after the implementation of the YCC policy in September 2016, Japan's domestic CPI rose flatly to 1% for two consecutive years before starting to fall again, with the CPI index falling back into negative territory after 2020. the YCC, which lasted for four years from 2016 to 2020 policy effect, the CPI index only peaked at around 1%. During this period Japan's economy emerged from deflationary difficulties, but there is still a large gap between it and Japan's inflation target of 2%. Under the normal money market transmission mechanism, lower interest rates in the money market would have transmitted liquidity inflation in the capital and commodity markets.
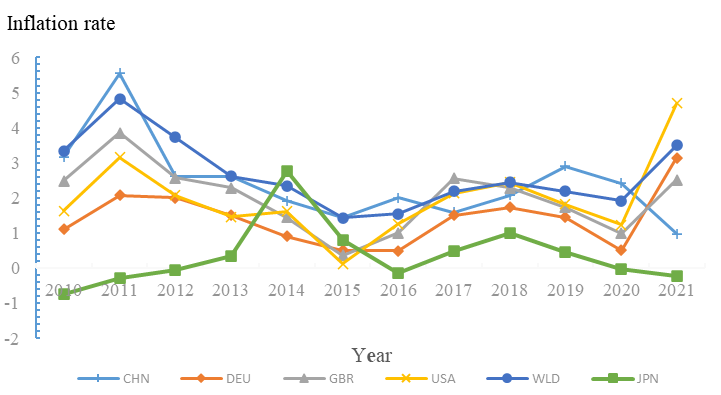
Figure 1: Graph of CPI index by country (source: IMF international financial statistics).
Under quantitative easing, the Bank of Japan hopes to get more money circulating in the market by way of treasury bond purchases. As of today, the BoJ's treasury holdings are over 50% and Japan's total treasury debt is a whopping US$10 trillion, 2.4 times its GDP. The BoJ has also made massive purchases of ETF traded open-ended index funds in order to make more money circulate in the market and circulate more widely. By the end of 2022, the BOJ held 62.5% of the total ETFs.
The Japanese government has implemented quantitative easing so aggressively, but it has still not led to an increase in inflation as envisaged and the effect of the policy is not obvious. This is closely related to the special social environment in Japan.
The ageing of the population is the main reason why Japan's various economic policies have had little effect. After the bursting of the bubble economy, Japan's economy gradually slumped, with the Nikkei index falling by 70% and the country's economic development level at a lower level. The prosperity of the bubble-era economy, with its frenzied consumerism, contrasted sharply with the post-burst depression. The people lost confidence in life and their willingness to have children declined. The population is the driving force behind the country's economic development, and Japan's ageing is causing a significant dampening of aggregate social demand.
As shown in Figure 2, the rate of natural increase has been declining year on year and has been negative for the last ten years. Older people are becoming a larger part of society and there will be less of a labor force. Japan is also one of the world's longest-living countries, with a life expectancy of 85 years. The increasing number of elderly people makes the whole society's domestic demand even more inadequate and makes it difficult for the economy to grow. Compared to other groups of people, the older people have the least demand in society. Japan has a loose monetary policy and even if money is given directly to the elderly, they will most likely choose to save it rather than spend it.
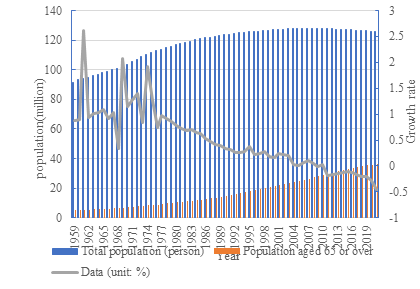
Figure 2: Graph of Japan's natural population growth rate and ageing (source: https://data.gotohui.com/).
As shown in Figure 3, the US and the UK, also developed countries, have significantly lower savings rates as a percentage of GDP compared to Japan. The many financial crises that Japan has experienced have severely undermined the self-confidence of the Japanese people, leading them to the extreme of desperate saving. At the end of June 2022, the financial assets of Japanese households reached ¥2007 trillion, of which cash and deposits accounted for a high 53.63%. The high savings rate means that the masses are reluctant to spend, and Japan's low-desire social status quo is getting worse. Young people are reluctant to socialize, to get married and have children, to buy houses and cars, and have no strong desire for material things. With the YCC policy, the Japanese government wants to stimulate long-term borrowing by companies and individuals by lowering long-term interest rates, hoping that companies will improve the current depressed economic situation by increasing market liquidity through marketing, management, production and investment to get money circulating in the market.
However, due to the low aggregate demand in Japanese society, companies are unable to make profits from investments such as expanding production, marketing and investment, choosing instead to invest their money in financial markets such as the stock market, bonds or overseas markets. This has led companies to choose to use this money to buy stocks, funds, bonds or invest in overseas markets. This money is then released by the central bank and flows back into the capital markets and into the real economy, as the government expects, in order to boost consumption and improve the overall economic downturn.
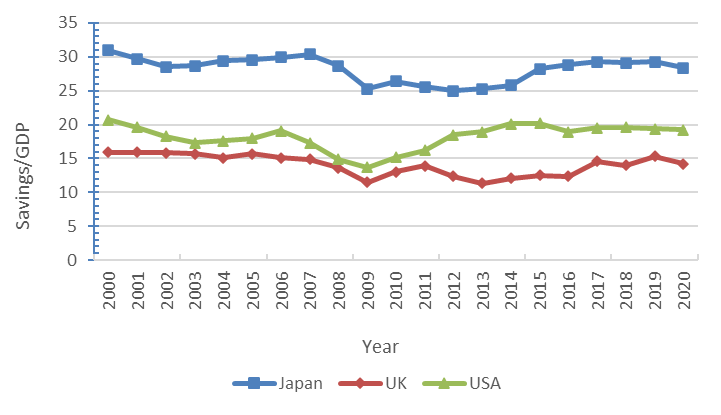
Figure 3: Graph of savings rate/GDP in the UK, US and Japan (source: international monetary fund).
The anchoring of price expectations is also the reason for the lack of significant YCC effects. Japanese wages have remained stable for a long time since the 1990s, causing the nation to form an anchor of expectation that prices will remain unchanged, leading firms to shy away from raising prices on goods. The YCC policy was not only about injecting liquidity into the market and controlling long-term interest rates, but the government also wanted to signal to consumers that prices could rise as liquidity became available in the market. But Japan's thirty-year-long stable price level is hardly likely to be readjusted. Without a rise in wages, consumption can hardly be driven up and inflation can hardly be effectively stimulated.
In a social environment of low desirability and severe ageing and people's anchored price expectations, the demand for domestic consumption in Japan has not increased as a result of the YCC policy and liquidity in the market has not been enhanced. In this context, the low volume of money entering the real economy and the low velocity of circulation naturally prevented prices from rising, making it difficult to achieve the Bank of Japan's inflation target.
The following Table 1 gives the results of the Granger Test for the above reasons. There is no causal relationship between the change in personal savings and the change in CPI. It is because the money in the hands of residents is not only in the form of bank deposits, but also in other forms such as cash, so the result of this test does not affect the conclusion. Residents' willingness to save also makes domestic demand in Japan decrease. Changes in the share of the elderly population and changes in the average wage level are not Granger causes of changes in the CPI, but changes in the CPI are Granger causes of changes in the share of the ageing population and the average wage level. Changes in personal savings are not causally related to changes in the CPI. Since Granger causality tests can only test for causality in a statistical sense, and the CPI index is influenced by numerous macro indicators and policies, a change in one indicator cannot be directly causally related to a change in the CPI.
However, from the results of the test, there is a causal relationship between the CPI index on the share of the ageing population and the average wage level. This suggests that deflation in Japan will further contribute to an ageing society in Japan and will also prevent wages from rising. After the bubble crisis, Japan already had an environment of non-rising wages and an ageing society, which led to its economic recession and the inability of the CPI index to grow as expected, which in turn led to an economic depression due to the inability of the CPI index to grow as expected, further making the vicious circle of people's willingness to have children declining, an ageing society intensifying, lower demand, lower corporate profits and the inability of wages to rise. This cycle is very difficult to break by the YCC policy.
Table 1: Granger causality tests.
Original assumptions | P-value | Result |
Proportion of aged population does not Ganger Cause CPI | 0.4623 | accept |
CPI does not Granger Cause Proportion of aged population | 0.0283 | reject |
Average wage does not Ganger Cause CPI | 0.3412 | accept |
CPI does not Granger Cause Average wage | 0.0225 | reject |
Individual deposit does not Ganger Cause CPI | 0.7045 | accept |
CPI does not Granger Cause Individual deposit | 0.5310 | accept |
4. Conclusion
Although the YCC policy has lifted Japan out of deflation, the CPI is below the Japanese government's expectation of 2%. In theory, the YCC policy should have had a significant stimulating effect on the economy and might even have led to severe international inflation. However, in the course of its implementation, the effect was less than satisfactory, which is closely related to Japan's special national conditions. After the bubble crisis, a succession of financial crises hit the nation's confidence in the economy. From the money-spinning days of the bubble era to extreme savings and fear of consumption, Japan has developed a low-desire society. At the same time, there is an expectation anchoring effect of prices in the market due to the ageing population, which has prevented the Japanese economy from increasing liquidity and the money in circulation from meeting the government's expectations. The Granger causality test shows that the inflation rate affects the problem of increased ageing and the expected price anchoring of society in Japan, which can lead to increased social conditions of low demand and difficulty in meeting inflation expectations, thus making the YCC effect less effective. The current situation in Japan is a wake-up call for all countries in the world. Once aggregate domestic demand continues to fail to improve and liquidity is low, any aggressive monetary policy will not be very strong in addressing the situation. Population is the engine of a country's development, but in reality, without the desire to consume, people cannot drive a country's economy. Countries around the world need to keep an eye on the future development of their populations and keep an eye on people's desire to consume, and start preventing problems before they occur when economic indicators are warning.
References
[1]. Liu, Q. L., Ye, A. Z.: The effect of quantitative easing monetary policy in Japan Empirical analysis based on SVAR model. Contemporary economy 22, 15-16 (2018).
[2]. Liu, R.: A New Framework for Quantitative and Qualitative Easing in Japan: Yield curve control policy analysis. North East Asia Journal 6,3 2-37 (2017).
[3]. Zhang, X. C., Li, H. J.: The Bank of Japan's yield curve control policy is in trouble. Financial Review 129, 82-87 (2023).
[4]. Chen, J. Y.: Japanese bond liquidity continues to deteriorate Bank of Japan's YCC policy is in question. Shanghai Securities News 03, 1-2 (2022).
[5]. Wen, B.: Analysis of Japan's monetary policy and the outlook of the future trend of the yen. Tsinghua Financial 209, 32-24 (2022).
[6]. Jarrow, R., Lamichhane, S.: The effects of yield control monetary policy: A helicopter money drop to financial institutions. The Quarterly Journal of Finance 10, 1 (2020).
[7]. Zhong, L., Luo Q. M.: Key characteristics of JGB yield curve changes, influence and revelation. Global perspective 03, 86-90 (2023).
[8]. Li, S. Q.: Analysis of foreign investor behavior in the process of bond market opening The Japanese Experience and Enlightenment. International Finance 93, 104-106 (2021).
[9]. Zeng, Y.: Analysis of the causes of abnormal fluctuations in the Japanese government bond futures market-- The perspective of the yield curve control policy. Financial Development Research 9, 86-89 (2016).
[10]. Xiang, M. X.: December monetary policy meeting flies out of the "black swan" The Bank of Japan's adjustment of its yield curve control plan has triggered financial market volatility. Financial 8, 1-2 (2022).
[11]. Xiang, M. X.: The Bank of Japan's adjustment of its yield curve control plan has triggered financial market volatility. Global Financial Times 08, 1-2 (2022).
Cite this article
Hu,J. (2023). The Impact of Japan's “Yield Curve Control” (YCC) on Inflation of Japan. Advances in Economics, Management and Political Sciences,39,39-46.
Data availability
The datasets used and/or analyzed during the current study will be available from the authors upon reasonable request.
Disclaimer/Publisher's Note
The statements, opinions and data contained in all publications are solely those of the individual author(s) and contributor(s) and not of EWA Publishing and/or the editor(s). EWA Publishing and/or the editor(s) disclaim responsibility for any injury to people or property resulting from any ideas, methods, instructions or products referred to in the content.
About volume
Volume title: Proceedings of the 7th International Conference on Economic Management and Green Development
© 2024 by the author(s). Licensee EWA Publishing, Oxford, UK. This article is an open access article distributed under the terms and
conditions of the Creative Commons Attribution (CC BY) license. Authors who
publish this series agree to the following terms:
1. Authors retain copyright and grant the series right of first publication with the work simultaneously licensed under a Creative Commons
Attribution License that allows others to share the work with an acknowledgment of the work's authorship and initial publication in this
series.
2. Authors are able to enter into separate, additional contractual arrangements for the non-exclusive distribution of the series's published
version of the work (e.g., post it to an institutional repository or publish it in a book), with an acknowledgment of its initial
publication in this series.
3. Authors are permitted and encouraged to post their work online (e.g., in institutional repositories or on their website) prior to and
during the submission process, as it can lead to productive exchanges, as well as earlier and greater citation of published work (See
Open access policy for details).
References
[1]. Liu, Q. L., Ye, A. Z.: The effect of quantitative easing monetary policy in Japan Empirical analysis based on SVAR model. Contemporary economy 22, 15-16 (2018).
[2]. Liu, R.: A New Framework for Quantitative and Qualitative Easing in Japan: Yield curve control policy analysis. North East Asia Journal 6,3 2-37 (2017).
[3]. Zhang, X. C., Li, H. J.: The Bank of Japan's yield curve control policy is in trouble. Financial Review 129, 82-87 (2023).
[4]. Chen, J. Y.: Japanese bond liquidity continues to deteriorate Bank of Japan's YCC policy is in question. Shanghai Securities News 03, 1-2 (2022).
[5]. Wen, B.: Analysis of Japan's monetary policy and the outlook of the future trend of the yen. Tsinghua Financial 209, 32-24 (2022).
[6]. Jarrow, R., Lamichhane, S.: The effects of yield control monetary policy: A helicopter money drop to financial institutions. The Quarterly Journal of Finance 10, 1 (2020).
[7]. Zhong, L., Luo Q. M.: Key characteristics of JGB yield curve changes, influence and revelation. Global perspective 03, 86-90 (2023).
[8]. Li, S. Q.: Analysis of foreign investor behavior in the process of bond market opening The Japanese Experience and Enlightenment. International Finance 93, 104-106 (2021).
[9]. Zeng, Y.: Analysis of the causes of abnormal fluctuations in the Japanese government bond futures market-- The perspective of the yield curve control policy. Financial Development Research 9, 86-89 (2016).
[10]. Xiang, M. X.: December monetary policy meeting flies out of the "black swan" The Bank of Japan's adjustment of its yield curve control plan has triggered financial market volatility. Financial 8, 1-2 (2022).
[11]. Xiang, M. X.: The Bank of Japan's adjustment of its yield curve control plan has triggered financial market volatility. Global Financial Times 08, 1-2 (2022).