


1. Introduction
1.1. Background
In recent years, the pace of society is getting faster and faster and employment is becoming more and more difficult. Also, the pressure of study and work is constantly rising, and the cost of living is still rising. These all lead to great stress for people now. For relaxation, people often choose to drink. The most popular category they chose was beer. From this, it can be predicted that the future development prospects of the beer industry are great. Thus, analyzing the leading enterprise AB-InBev can help investors determine the optimal investment.
1.2. Related Research
Many scholars studied the M&A of AB-InBev. Ye analyzed the factors affecting the quality of the M&A of AB-InBev through financial performance and non-financial performance. The result of this research is that if the company's motivation for M&A matches its business development strategy and this company can choose the proper target company and reasonably integrate, M&A is a good choice to expand capital and increase the value of the company [1]. Hong analyzed the financial performance and non-financial performance of AB-InBev to find what affects the quality of M&A. Specifically, the author analyzed financial performance from profitability, growth, operating capacity, and debt paying ability and non-financial performance from market size, market power, and market reputation. This research concludes that the company implements M&A according to its strategy and changes with the actual situation, to achieve effective M&A [2]. Zhang studied the sales and marketing strategy of AB-InBev through the PEST analysis method, Porter's Five Forces model, SWOT model, STP analysis method, and 4P combination theory. This research showed both strengths of AB-InBev and problems in products, price, channels, and promotional strategies. Also, the author provided targeted advice such as decreasing operating costs and carrying out different brand activities. These can also be extended to other companies in the industry for reference [3].
Some scholars have conducted in-depth research on consumers' preferences for products. Frake investigated why audiences have no preference for companies that act inauthentically. The author took AB-InBev as an example showing that although AB-InBev has been the leader in the beer industry, consumers will still distrust the quality of products because of the acquisition of Goose Island. Through testing various mechanisms in the craft beer industry, the result of this research is that the inauthentic action of the company does affect consumer perception of product value [4]. Yang investigated the influence of objective environment and incentive conditions on brand preference. The author established a mathematical model based on the economic framework of utility maximization and discrete choice and collected data on beer consumption from 842 consumers everywhere. The final result of this research is that using objective environment and incentive conditions to analyze brand preferences is very effective and it can help the company to make the best marketing strategy decisions [5]. Bronnenberg investigated why beer preference in the United States has increased rapidly since the emergence of millennial consumers. The authors tested two competing mechanisms, which are differences in taste and differences in consumption capital. After a series of analyses, the result of this research is that the most important factor affecting preferences is the difference in consumption capital and the author predicted that the beer market structure will continue to split over the next decade [6].
Huang built a model to analyze consumers' consumption of beverages. This model indicated that consumers regulate their consumption through balanced short-term demands and balanced long-term goals. Using this model helps the company to judge whether this new product satisfies the needs of consumers or not and improve it in time. This model is also widely applicable to other industries [7]. Khessina analyzed how product name sentiment affects the appeal and authenticity of the craft beer market. The author conducted a regression analysis on the relevant data of the American craft beer industry from 1996 to 2012. The final result is that the name of a negative mood increases the appeal of a beer and positive emotions reduce the perception of authenticity. These conclusions also apply to other industries [8].
Many scholars focus on the distribution of retailers and manufacturers. Friberg studied the effect of retail distribution on the market share of alcoholic beverages. The author used the data which includes sales of wine, beer, and alcohol sold by the Swedish Retail liquor monopoly from 2006 to 2011. After analysis, this research concludes that the wider the retail distribution, the more sales a company makes. This can also further expand the market share [9]. Luo studied the relationship between manufacturers and retailers in product distribution. The author formalized the industry's notion of a relationship with a repeated game for analyzing and took AB-InBev and MillerCoors as examples. The final result of this research is that this harmonious relationship between manufacturers and retailers can increase social welfare, but it limits the impact of regulation. That means the regulation can't create a free competitive environment for manufacturers [10].
1.3. Objective
This article mainly analysis of the beer industry-leading enterprise AB-InBev to give investment advice. Specifically, first of all, the capital structure of the company is analyzed by specific calculations. In addition, the company's business risks are evaluated by analyzing the company's financial data and competitors. the investment value of this company is also evaluated. Finally, investment recommendations are derived from all the above analyses.
2. Analysis of AB-InBev’s Capital Structure
2.1. AB-InBev's History of Capital Expansion
In the process of AB-InBev’s development, it has been through a lot of acquisitions. Two of them were the most significant. The first one is that in 2004, Belgium's Interbrew and Brazil's AmBev merged into InBev. Another one is that in 2008, InBev paid $52 billion for Anheuser-Busch. After that, AB-InBev became the largest brewing group in the world. Through these various mergers, AB-InBev completed capital expansion rapidly, which has laid a solid foundation for the later development of the company in terms of capital and business scale. They have played an important role in effectively seizing the market share and increasing the value of the company.
2.2. AB-InBev’s Current Capital Structure
Through searching data of AB-InBev in 2022 on Yahoo Finance, the market value of equity is 130.76 billion and the market value of debt is 80.18 billion. Debt over equity is equal to 61.32% and debt over value is equal to 38.01%, as shown in Table 1.
Table 1: Data related to equity and debt.
Equity | Debt | D/E | D/V | |
AB-InBev | 130.76B | 80.18B | 61.32% | 38.01% |
The risk-free rate refers to the 10-year Treasury rate, which is 3.39%, and the market return refers to the S&P500, which is 6.97%. The equity beta of AB-InBev is 1.12 and the delever beta is 0.75. Also, the corporate return of this company is 6.09%, as shown in Table 2.
Table 2: Data related to risk.
Equity beta | Rf | Rm | Delever beta | Corporate return | |
AB-InBev | 1.12 | 3.39% | 6.79% | 0.78 | 6.09% |
After getting the data above, it is easier to calculate the expected cost of equity capital(rE), the expected cost of debt capital(rD), and the weighted average cost of capital (WACC) of AB-InBev. RE can be calculated by the CAPM model, which is 7.38% and rD of 13.26% can be calculated by the formula, which divides the interest expense by debt. Finally, the WACC of 9.25% is calculated by the formula which is the sum of two parts. One of the parts is equity over value and times rE. Another part is that debt over value and times one minus corporate tax rate and times rD, as shown in Table 3.
Table 3: Data related to the cost of capital.
rD | rE | WACC | |
AB-InBev | 13.26% | 7.38% | 9.25% |
For analyzing these data of AB-InBev, its capital is very sufficient for development. Debt over value is equal to 38.01%, which indicates that the company's ability to expand business is strong. However, this debt ratio is not low so it may affect the ability to repay the debt and lead to more risks. Relatively speaking, the equity over value isn't high and it makes the value of AB-InBev not worth so much. Also, the high equity beta indicates the high risk of this company. Then this company's WACC is high. When valuing a company, cash flows are discounted using WACC as the interest rate. Therefore, because of the high WACC, the value of AB-InBev can be low. In general, AB-InBev's capital structure is well enough, but there are still things that can be improved such as appropriately raising the equity and declining the WACC to maximize the value of this company.
3. Business Risk Analysis
3.1. Financial Statements
3.1.1 Analysis of Profitability
It can be seen from the data in the following table that AB-InBev has strong profitability. First, its revenue always maintains a stable level and rises steadily. That confirms that this company's products sell well and it has many customers. Secondly, its gross profit margin has remained stable and high, which states high competitiveness and high operating efficiency. It also indicates the high prices of this company. Finally, both its net profit margin and EPS has been increasing greatly except for 2020, which proves that this company is very profitable and its management is very competent.
All of the indicators in the table below showed significant declines in 2020. That's because of the COVID-19 pandemic, which made the demand for beer all over the world decrease rapidly. Especially in China, everyone was always quarantined at home and they only bought food for daily cooking. Also, meeting and traveling have declined dramatically. These all led to the extremely low sales volume and then revenue and profit fell sharply.
For the impact of the pandemic, AB-InBev has taken various effective measures. For example, it keeps developing e-commerce to promote product sales. Meanwhile, this company insisted on developing the DTC model business, which led to further sales growth. Therefore, the data in 2021 and 2022 rises rapidly. This fully demonstrates the company's strong ability to adjust, as shown in Table 4. These all strengths reduce the risk of AB-InBev.
Table 4: Data related to profitability.
2022 | 2021 | 2020 | 2019 | 2018 | |
Revenue | 57.79B | 54.3B | 46.88B | 52.33B | 53.04B |
Revenue growth | 6.41% | 15.83% | -10.41% | -1.34% | -3.31% |
Gross profit | 31.48B | 31.21B | 27.25B | 31.97B | 33.11B |
Gross profit margin | 54.48% | 57.47% | 58.12% | 61.09% | 62.42% |
Net profit | 5.97B | 4.67B | 1.41B | 9.17B | 4.37B |
Net profit margin | 13.15% | 11.26% | 4.7% | 19.9% | 10.72% |
EPS | 2.97 | 2.33 | 0.7 | 4.62 | 2.21 |
3.1.2 Solvency Analysis
It can be obtained from the following data that the solvency of AB-InBev is poor. On the one hand, its liquidity ratio has been low for the last five years and has not gone above one. That means that the ability of this company to repay short-term debts is weak. On the other hand, its highest quick ratio in the last five years is only 0.68 and its lowest quick ratio is 0.4. This shows that this company doesn’t have one reasonable current asset structure, which severely reduces the ability to repay the debts. As a whole, AB-InBev’s weak ability to repay the debts increases its risk, as shown in Table 5.
Table 5: Data related to solvency.
2022 | 2021 | 2020 | 2019 | 2018 | |
Liquidity ratio | 0.67 | 0.7 | 0.82 | 0.83 | 0.52 |
Quick ratio | 0.48 | 0.54 | 0.68 | 0.7 | 0.4 |
3.1.3 Analysis of Return on Investment
According to the data from Table 6, AB-InBev's ability to use assets efficiently is strong. Its ROE and ROA have both grown in the last five years except in 2020 due to the impact of the pandemic. Especially, the average ROE of the beverage industry is only 5%. Except for 2020, the ROE of AB-InBev in the last five years has all gone above 5%. This shows that this company's investment brings high returns and its capital utilization efficiency is high. Thus, its strong ability to use assets helps this company reduce risk.
Table 6: Data related to return on investment.
2022 | 2021 | 2020 | 2019 | 2018 | |
ROE | 8.4% | 6.83% | 1.95% | 13.08% | 6.38% |
ROA | 2.77% | 2.1% | 0.61% | 3.9% | 1.81% |
3.2. Cost-risk Analysis
One of the reasons why AB-InBev is so popular with consumers is the quality of its product is great. However, it leads to higher costs containing many parts, which increases the risk for the company.
To be specific, it concludes material cost, cost of technology, and packing expenses. AB-InBev strictly controls the quality of materials to maintain excellent taste. In addition, this company insists on using the aging process of beech wood, which can give the beer a special flavor, although it's very expensive. To ensure high-quality standards, the bottle, bottle cap, and rubber gasket of its products are made by foreign companies, which charge a lot. All this makes the cost very high.
One consequence of high costs is high prices, which can decrease the demand for products. Therefore, if the sales volume decreases, the revenue will decrease and the profit will decline sharply. That makes it easier for AB-InBev to lose money so that its risk rises, as shown in Table 7.
Table 7: Data on the cost of sales.
2022 | 2021 | 2020 | |
Sales revenue | 57.79B | 54.3B | 46.88B |
Cost of sales | 26.31B | 23.1B | 19.63B |
The reasons also include that AB-InBev has been implementing various marketing activities and its daily management is great. Although these ways increase sales and are good to ensure the daily operation of the company, they lead to high costs. Also, not all marketing is profitable so it is easy to choose the wrong solution to reduce profits or even cause losses. Thus, these increase the costs and then the risks of this company become higher, as shown in Table 8.
Table 8: Data on marketing and general costs.
2022 | 2021 | 2020 | |
Marketing costs | 6.752B | 7.292B | 6.861B |
General costs | 4.414B | 4.394B | 3.404B |
3.3. Competitor Analysis
In the Asia-Pacific region, the main competitors of AB-InBev are China Resources Beer and Tsingtao Beer. As shown in Figure 1 and Figure 2, since Anheuser-Busch InBev entered the market, it has been very popular with consumers and ranks among the top three beer suppliers in China together with China Resources Beer and Tsingtao Beer. Meanwhile, because of the strategic reform and upgrading of China Resources Beer and Tsingtao Beer and also epidemic, its revenue growth in Asia-Pacific markets has slowed and its market share in China has declined. This puts it further away from China Resources Beer and Tsingtao Beer gradually, as shown in Figure 1 and Figure 2.
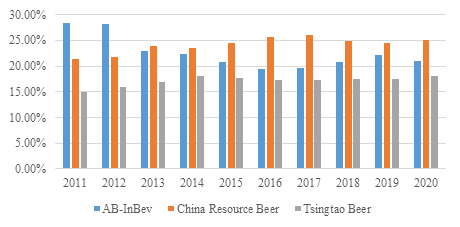
Figure 1: The market share of three companies in the Chinese beer industry from 2011 to 2020. (Photo/Picture credit: Original)
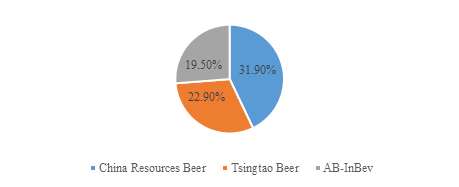
Figure 2: The market share of three companies in the Chinese beer industry in 2022. (Photo/Picture credit: Original)
In the European region, Heineken, which is one of the top two beer brands in the world always insists on the differentiation of a high-quality brand strategy. This company is very profitable and its market share in the world is getting closer to AB-InBev. It's also in a leading position among global high-end brands.
From the above analysis, it is obvious to find that AB-InBev has many competitors and these companies all get great promotion through the reform and expansion. This poses a great threat to this company, which leads to higher risk.
4. Investment Value
4.1. Business Model Analysis
Initially, this company adopts the brand strategy, which includes two parts. The first one is that AB-InBev has been absorbing different brands and it now owns more than 500 beer brands. These brands are all well-known first-tier brands with strong premiums. The second part is that this company insists on a blend of international and local brands. That means that AB-InBev has different marketing methods for different regions and different consumers to manage the portfolio of brands. This company uses international brands to grab the high-end market and uses local brands to expand consumer scale. These two parts greatly increase the profit.
In addition, AB-InBev has made good use of the DTC mode, which means that it uses e-commerce to communicate directly with consumers and facilitate direct purchases as an independent entity, without the need for intermediary channels such as wholesale retailers. This action not only decreases the costs paid to the intermediary but also helps this company get more information from consumers so that it can market better and increase its sales volume. Meanwhile, e-commerce has become mainstream and is expected to continue to grow in the future. That makes AB-InBev more potential in the future.
Finally, AB-InBev pays attention to corporate culture and values and attaches importance to excellent talents. This company will give appropriate training and awards to its employees to make them better. Through these ways, this company's management and operation capabilities are constantly improving.
As a whole, it’s obvious that AB-InBev has one appropriate business model. Investing in this company is more likely to yield higher returns in the future.
4.2. Financial Data Analysis
For capital structure, AB-InBev has sufficient capital and it has many successful experiences in M&A. The peak increase in this company's operating profit always occurs after the completion of the M&A. It shows that this company has strong integration ability, which has laid a solid foundation for its subsequent sustainable development. However, although AB-InBev has succeeded in M&A many times, M&A remains risky. It makes it easier to bring large losses to the company. In addition, this company's WACC is high, which indicates the lower corporate value and high risk of this company.
For specific financial indicators, AB-InBev has strong profitability and high investment efficiency. This means that this company will have continuous cash flow coming in in the future, which makes it a good investment option. Nevertheless, this company's costs are high and it has weak solvency. These bring more risk to this company.
In conclusion, investing in AB-InBev will bring better returns, but you also have to take higher risks
4.3. The Suited Investors for AB-InBev
Risk-neutral or risk seekers are suitable for investing in this company. The reasons are as follows.
From all the above, it's clear to find that AB-InBev is very strong and has potential, but its risk is high. This company has a great business model helping it become more profitable and potential, which can bring more investment returns. Meanwhile, it's hard for this company to reduce the costs of both financial capital and production and become more competitive. Although it has a great management level, the risk of M&A is still difficult to decrease or eliminate. Therefore, the risk of this company will maintain a high level. Thus, for investors who want to get more returns and are willing to take high risks for it, AB-InBev is a great choice.
5. Conclusion
In general, this paper makes a detailed analysis of AB-InBev and gives some investment suggestions. Through the analysis, on the one hand, it is obvious to find that this company has sufficient capital, which provides good conditions for business development. Also, this company is good at mergers and acquisitions so can lower the risks to achieve capital structure. Furthermore, the profitability of AB-InBev is very strong and its assets are used efficiently. Also, the management level of this company is high. On the other hand, the risk of this company is very high. Specifically, to begin with, AB-InBev has a high cost of capital as well as operating costs. In addition, this company's solvency is weak. It also has plenty of strong competitors who have been taking market share with it. Thus, Investors investing in the company should be risk-neutral or risk-loving people who pursue higher returns and are willing to take higher risks for the company. This paper only selects AB-InBev and its competitors for detailed analysis and investment suggestions. If investors want to analyze and invest in other companies in the beer industry, this paper can be an example for them to refer to, and compare to make optimal investment decisions.
References
[1]. Qingcong Ye. Performance of AB-InBev and Its Influencing Factors Analysis-Based on the Perspective of M&A in China[D]. XMU, 2014.
[2]. Xin Zhang. The Research of AB-InBev Sales &Marketing Strategy[D]. SJTU, 2017.
[3]. Wenwen Hong. Research on the Performance of Anheuser-Busch InBev’s M&A Strategy and Influencing Factors in China[D]. LNU, 2013.
[4]. Justin Frake. Selling Out: The Inauthenticity Discount in the Craft Beer Industry. Management Science, vol. 63, pp:3930-3943, 2017.
[5]. Sha Yang, Greg M. Allenby, Geraldine Fennell. Modeling Variation in Brand Preference: The Roles of Objective Envi-ronment and Motivating Conditions. Marketing Science, vol. 21, pp:14-31, 2002.
[6]. Bart Bronnenberg, Jean-Pierre Dube, Joonhwi Joo. Millennials and the Takeoff of Craft Brands: Preference For-mation in the U.S. Beer Industry. Marketing Science, vol. 41, pp:710-732, 2022.
[7]. Guofang, Huang, Ahmed Khwaja, K. Sudhir. Short-Run Needs and Long-Term Goals: A Dynamic Model of Thirst Management. Marketing Science, vol. 34, pp:702-721, 2015.
[8]. Olga M. Khessina, J. Cameron Verhaal, Stanislav D. Dobrev. Bottled Up or Poured Out: How Product Name Emotions Affect Appeal and Authenticity in the Market for Craft Beer. Strategy Science, vol. 0, pp:1-20, 2022.
[9]. Richard Friberg, Mark Sanctuary. The Effect of Retail Distribution on Sales of Alcoholic Beverages. Marketing Sci-ence, vol. 36, pp:626-641, 2017.
[10]. Bowen Luo. Manufacturer–Retailer Relationships and the Distribution of New Products. Marketing Science, vol. 0, pp:1-24, 2023.
Cite this article
Meng,S. (2023). Research on Capital Structure and Investment Value of the Beer Industry. Advances in Economics, Management and Political Sciences,40,53-60.
Data availability
The datasets used and/or analyzed during the current study will be available from the authors upon reasonable request.
Disclaimer/Publisher's Note
The statements, opinions and data contained in all publications are solely those of the individual author(s) and contributor(s) and not of EWA Publishing and/or the editor(s). EWA Publishing and/or the editor(s) disclaim responsibility for any injury to people or property resulting from any ideas, methods, instructions or products referred to in the content.
About volume
Volume title: Proceedings of the 7th International Conference on Economic Management and Green Development
© 2024 by the author(s). Licensee EWA Publishing, Oxford, UK. This article is an open access article distributed under the terms and
conditions of the Creative Commons Attribution (CC BY) license. Authors who
publish this series agree to the following terms:
1. Authors retain copyright and grant the series right of first publication with the work simultaneously licensed under a Creative Commons
Attribution License that allows others to share the work with an acknowledgment of the work's authorship and initial publication in this
series.
2. Authors are able to enter into separate, additional contractual arrangements for the non-exclusive distribution of the series's published
version of the work (e.g., post it to an institutional repository or publish it in a book), with an acknowledgment of its initial
publication in this series.
3. Authors are permitted and encouraged to post their work online (e.g., in institutional repositories or on their website) prior to and
during the submission process, as it can lead to productive exchanges, as well as earlier and greater citation of published work (See
Open access policy for details).
References
[1]. Qingcong Ye. Performance of AB-InBev and Its Influencing Factors Analysis-Based on the Perspective of M&A in China[D]. XMU, 2014.
[2]. Xin Zhang. The Research of AB-InBev Sales &Marketing Strategy[D]. SJTU, 2017.
[3]. Wenwen Hong. Research on the Performance of Anheuser-Busch InBev’s M&A Strategy and Influencing Factors in China[D]. LNU, 2013.
[4]. Justin Frake. Selling Out: The Inauthenticity Discount in the Craft Beer Industry. Management Science, vol. 63, pp:3930-3943, 2017.
[5]. Sha Yang, Greg M. Allenby, Geraldine Fennell. Modeling Variation in Brand Preference: The Roles of Objective Envi-ronment and Motivating Conditions. Marketing Science, vol. 21, pp:14-31, 2002.
[6]. Bart Bronnenberg, Jean-Pierre Dube, Joonhwi Joo. Millennials and the Takeoff of Craft Brands: Preference For-mation in the U.S. Beer Industry. Marketing Science, vol. 41, pp:710-732, 2022.
[7]. Guofang, Huang, Ahmed Khwaja, K. Sudhir. Short-Run Needs and Long-Term Goals: A Dynamic Model of Thirst Management. Marketing Science, vol. 34, pp:702-721, 2015.
[8]. Olga M. Khessina, J. Cameron Verhaal, Stanislav D. Dobrev. Bottled Up or Poured Out: How Product Name Emotions Affect Appeal and Authenticity in the Market for Craft Beer. Strategy Science, vol. 0, pp:1-20, 2022.
[9]. Richard Friberg, Mark Sanctuary. The Effect of Retail Distribution on Sales of Alcoholic Beverages. Marketing Sci-ence, vol. 36, pp:626-641, 2017.
[10]. Bowen Luo. Manufacturer–Retailer Relationships and the Distribution of New Products. Marketing Science, vol. 0, pp:1-24, 2023.