


1. Introduction
Tesla is a leading global electric automobile and clean energy company founded in the United States in 2003. Tesla develops and produces stationary batteries, solar panels, electric vehicles (cars and trucks), as well as related goods and services. Tesla is best known for its range of electric vehicles, which feature the world's first self-driving technology and offer outstanding performance and long range. In addition to this, Tesla is also committed to promoting the development of electric vehicle infrastructure, with a network of Superchargers around the world and the acquisition of SolarCity, a solar energy company, to continue to develop its renewable energy business.
Tesla is currently famous for its purely electric cars. These electric cars are equipped with the world's first self-driving technology and offer excellent performance as well as a long range. Model 3, which was on sale since 2017, and Model Y, which was on sale since 2020, became popular worldwide due to their cheap prices ($30,000 to $50,000) [1, 2]. According to Tesla's financial results for 2022, a total of 1,247,146 model 3/Y units were sold worldwide in 2022 [3]. Tesla thus retains its position as the world's top seller of electric vehicles. Tesla currently has the so-called Gigafactories in California, Nevada, Texas, Shanghai, and Berlin, with an annual production capacity of over 1.9 million electric vehicles, according to its 2022 financial report. In the battery energy storage section, With 6.5 GWh of installed battery energy storage systems by 2022, Tesla is already among the world's largest suppliers of these systems [3].
In terms of financial performance, Tesla had an excellent 2022. Revenue was US$81,462 million and net income was US$12,556 million, an increase of 51.35% and 127.5% respectively over last year. The gross margin was 25.6%, with no major improvement from last year's level (25.3%) [2]. Net margin was 15.41% in 2022, a greater improvement compared to last year's level of 10.25% [4]. This is due to an increase in the operating margin and the fact that SG&A and R&D expenses are not significantly higher than last year, expanding the net margin. This also indicates that Tesla is now experiencing a significant scale effect.
2. Accounting Analysis
All of Tesla's consolidated financial statements have been prepared in accordance with GAAP and include both the company's own accounts and operations as well as those of the subsidiaries it owns a controlling financial interest in. According to GAAP, the management must make estimates and assumptions that have an impact on the reported amounts of revenue, costs, and expenses as well as any associated disclosures in the accompanying notes in order to prepare the financial statements.
2.1. Revenue Recognition
In 2022, Tesla generated $81,462 million in total revenue, which can be divided into four main parts: Automotive Sales & Leasing, Energy generation & storage set sales & Leasing, Automotive Regulatory Credits, and other services.
When a vehicle is delivered to the customer, which is when actual control of the vehicle transfers, Tesla recognizes income from both the sale of automobiles as well as its Full self-driving (FSD) service [5]. Other automotive-related features and services, including software updates, Supercharging, and internet access, are recognized over time in a straight line as the customers receive the services. In the United States, Canada, and a few European nations, Tesla Automotive operates vehicle leasing programmes that let customers lease cars directly from Tesla for up to 48 months. The revenue from leasing cars is calculated on a straight-line basis over the duration of the agreement, and the revenue is offset by the depreciation of the vehicles. Tesla claimed a revenue of $69,686 million in the 2022 fiscal year in Automotive sales and leasing segments, rising by 52.26% compared to 2021.
Automotive Regulatory Credits are the tradeable credits for car sales in some U.S. states that are based on rules for greenhouse gases, fuel economy, and clean fuel. To satisfy other obligations and adhere to pollution rules, Tesla sells the credits to other organizations. Due to changes in regulation, Tesla reported an additional $288 million in revenue for the 2022 fiscal year, bringing its total to $1,776 million. For the Energy generation & storage system, it shares similar accounting policies with automotive vehicles, with all revenue being recognized upon delivery to the customer. It is vital to note that Tesla may offer the client performance guarantees that the system will meet or surpass the minimal energy generation standards stated in the contract. If the system does not meet the guaranteed requirements, Tesla would pay liquidated damages to the customers. In the 2022 fiscal year, Tesla claimed a revenue of $3,909 million in Energy generation and storage sales & leasing in total. The remaining revenue is generated by the Services and other sources, such as sales of used cars, non-warranty aftermarket automobiles, paid Supercharging, retail goods, and vehicle insurance revenue. Revenue is recognized at various periods for various services, depending on the type of service. Tesla claimed revenue of $6,091 million in the 2022 fiscal year.
In recognizing revenue, Tesla follows the principle of rigor by setting up provision accounts for multiple revenue sources and making critical assumptions for accruals based on historical sales [6]. For example, the price of electric vehicles is frequently adjusted throughout the year, which can impact the likelihood that customers would use their resale value guarantees. The estimated release of the reserve is based on the possible return rate of the vehicles. As of December 31, 2022, $324 million of the total income had been recognized, making the difference between the net release of reserves in 2022 and 2021 insignificant.
2.2. Warranties
According to the sales agreement, Tesla offers 10 to 25 year guarantees on all new and used cars as well as on the installation of energy generation and storage equipment. Every product it sells generates a warranty reserve that includes an estimate of the price of repairs or replacements under warranties. The projections are based on past claims' actual frequency and expenses for particular time periods. In the condensed statements of operations, warranty expenses are reported as a component of Cost of revenues, and the amount of the warranty reserve is included in Accrued liabilities and others. A $1,685 million increase in warranty provision will take effect in 2022, and the accrued warranty will total $3,505 million at the end of the fiscal year. As most of the warranties are related to the sales of vehicles or energy generation systems, we can expect the same trend in the growth of total sales and warranties level.
2.3. Digital Assets
Tesla's CEO Elon Musk is an investor in digital currencies, and according to his own statements, he currently holds three different types of digital currencies, while his comments about them on social media are often controversial. Tesla has similarly invested in digital assets. According to ASC 350, Intangibles-Goodwill and Other, all of Tesla's digital assets are recognized as intangible assets. To ascertain the fair worth of its digital assets, Tesla conducts an examination every three months. Digital assets have experienced an impairment loss when their current carrying value is higher than their fair value, which is calculated every quarter. The loss is equal to the difference between the carrying value and fair value of the digital assets. Tesla reported realized gains of $64 million in 2022 and losses of $204 million related to impairment impairments on digital assets. Its digital assets had a fair market value of $191 million as of December 31, 2022, compared to their carrying value of $184 million.
3. Performance Evaluation
Tesla's outstanding performance in 2022 and the continued growth of Tesla's electric car sales worldwide allow Tesla to further reduce the price of its own electric cars to grab market share and become a price setter in the electric passenger car market. Four companies, Volkswagen, General Motors, Li Auto, and Nio have been chosen as Tesla's competitors and this will analyze Tesla's performance last year by comparing their financial metrics [7-10].
3.1. Trend Analysis
As shown in Figure 1, Tesla's revenue is growing year on year and shows the biggest rise in 2022, from $53,823 million in 2021 to $81,462 million in 2022. This is mainly due to the high growth rate of Tesla's revenue from all its main businesses, especially in its rising sales of electric vehicles worldwide. On the net income side, Tesla achieves profitability for the first time in 2020 and rises at a soaring rate from there. The GAAP net income of Tesla increases from $5,519,000,000 in 2021 to $12,556,000,000 in 2022. Notice that Tesla's net income in 2021 and 2022 will be enough to offset the net loss from all previous years combined.
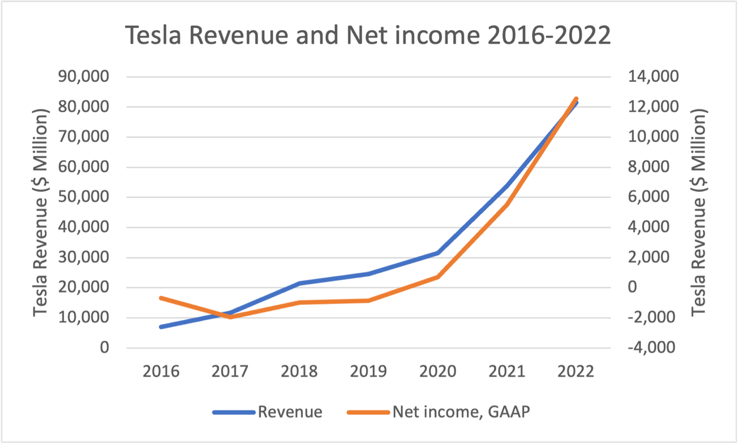
Figure 1: Tesla revenue and net income (2016-2022).
3.2. Expenses
As Figure 2 has shown, both SG&A and R&D expenses show an increasing trend. One possible reason for the most significant increase in 2021 is that to match the newly established factory capacity, Tesla has increased marketing-related expenses to boost sales, while it still needs to continuously make upgrades for the launch of the new product model Y, thus increasing R&D expenses. On the income tax side, as Tesla's operating capacity rises, income tax expense also rises to some extent.
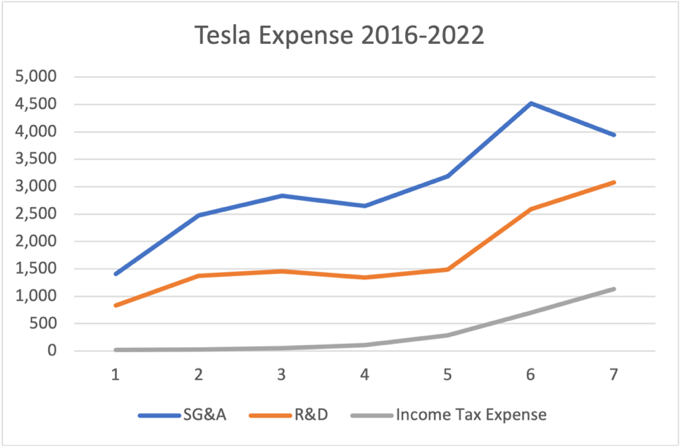
Figure 2: Tesla expense (2016-2022).
3.3. Liquidity
Table 1 shows that Tesla has strong liquidity in 2022. Good operations allow Tesla to maintain positive operating cash flow. In the balance sheet, Tesla has $16,253 million in cash and equivalents in 2022, while significantly increasing its short-term investments from 2021 to $5,932 million. The table shows that Tesla's liquidity is significantly stronger than that of Volkswagen and General Motors, which share a similar operating scale. While NIO and Li show greater liquidity, these new energy automotive companies are still growing, and too much liquidity reflects not allocating cash properly.
Table 1: Liquidity ratios of tesla and its competitors.
Company name | Current ratio | Quick ratio |
Tesla | 1.53 | 0.95 |
Volkswagen | 1.23 | 0.85 |
GM | 1.1 | 0.86 |
NIO | 1.29 | 1.01 |
Li | 2.45 | 2.07 |
3.4. Leverage
Tesla's level of financial leverage has decreased significantly over the last 5 years. Tesla's debt-to-equity ratio has declined year over year from 219.04 in 2018 to 12.52 in 2022, with other leverage metrics showing the same downward trend. This is because Tesla has been paying down its debt over the past few years and has no need to borrow new debt due to increased operating cash flow. With a peak of $10,375 million at the end of 2019 and a low of $1,029 million in 2022, Tesla's balance sheet reveals that it holds less than a tenth of one percent of the company's long-term debt. Table 2 shows that Tesla's competitors all have high financial leverage, except for Li which is at low leverage from 2020 onwards. This means that Tesla has good operating income with strong ability to pay debt.
Table 2: Leverage ratios of Tesla and its competitors.
Total Debt to Equity | Total Debt to Total Capital | Total Liabilities to Total Assets | |
Tesla | 12.52 | 11.13 | 44.26 |
VW | 115.06 | 53.5 | 68.43 |
GM | 160.36 | 61.59 | 72.62 |
NIO | 85.91 | 46.21 | 71.28 |
Li | 27.14 | 21.35 | 47.78 |
3.5. Efficiency
As Tesla's sales have increased year over year, Tesla's asset turnover and accounts receivable turnover are significantly higher than those of its competitors, with asset turnover increasing significantly over the past three years, from 0.73 in 2020 to 1.13. The significantly higher turnover than that of its competitors represents Tesla's strong operating capacity.
Table 3: Turnover ratios of Tesla and its competitors.
Total Asset Turnover | Accounts Receivable Turnover | Inventory Turnover | |
Tesla | 1.13 | 31.93 | 6.52 |
VW | 0.51 | 13.63 | 4.24 |
GM | 0.62 | 13.89 | 8.95 |
NIO | 0.55 | 12.45 | 8.6 |
Li | 0.61 | NM | 8.67 |
3.6. Profitability
Tesla has shown an impressive level of profitability in 2022. Gross margin stabilized at a level like 2021, and all other profitability criteria rose from last year. Tesla's competitors are all below it in terms of profitability, especially the new energy vehicle companies represented by NIO and Li still face the question of whether they can be profitable (see Table 4). In terms of return on investment, the beyond-expectation financial performance allowed Tesla to outperform the industry (see Table 5).
Table 4: Profitability ratios of Tesla and its competitors.
Gross Margin | Operating Margin | Net Income Margin | EBITDA Margin | |
Tesla | 25.6 | 16.82 | 15.41 | 21.41 |
VW | 17.73 | 8.26 | 5.53 | 12.46 |
GM | 13.5 | 7.66 | 6.34 | 11.37 |
NIO | 10.53 | -31.65 | -29.55 | -25.87 |
Li | 19.41 | -8.07 | -4.44 | -5.39 |
Table 5: Investment ratios of Tesla and its competitors.
ROE | ROA | ROC | |
Tesla | 33.6 | 11.85 | 18.58 |
VW | 9.76 | 2.64 | 3.9 |
GM | 14.06 | 2.95 | 4.11 |
NIO | -44.79 | -10.88 | -17.79 |
Li | -4.71 | -3.08 | -4.3 |
4. Valuation
4.1. Income Statement Forecasts
4.1.1. Revenue
The total revenue forecast is divided into automotive and other operations. Automotive revenue is highly correlated with the number of total vehicles sold worldwide, so predicting Tesla’s total sales figure for the next two years is a vital part of the revenue forecast [11]. According to the financial report for Q1 2023, Tesla sold 440,808 automobiles in Q1 2023. An assumption that Tesla can achieve similar performance in the coming quarters is made, so the estimated total sales in 2023 are annualized by multiplying the Q1 figure by 4. For 2024, a growth rate of 15% is used to predict the total sales figure. Ultimately, the estimated automotive revenue can be estimated by multiplying the total sales figure of each year by the average revenue per sale, which is calculated with the method of dividing revenue from automotive by total delivery after 2020, when Model Y went on to the market [12]. The predicted revenue per sale in 2023 & 2024 is $47,000, which leads to the predicted automotive revenue of $82,872 and $95,303 million in 2023 and 2024. Revenues from other operations are estimated using the average growth rate of the past 2 years. As a result, Tesla’s total estimated revenue for 2023 and 2024 is $103,944 and $126,919 million respectively.
4.1.2. Costs & Expenses
The Costs of Goods Sold are similarly divided into two parts, and the forecast uses similar methods to the revenue forecast. The average cost per sale for automotive costs is multiplied by the anticipated sales volume, whereas the average annual growth rate for costs for other goods and services is used to forecast them. R&D costs have increased over the last three years, hence the average annual growth rate of the previous two years was applied for expenses. SG&A expenses and other expenses including Interest Expenses and Restructuring Expenses did not show a significant trend, so a three-year moving average was used to estimate. As a result, Tesla’s total estimated costs and expenses in 2023 and 2024 are $90,586 and $110,161 million respectively.
4.1.3. Income Tax
The provision for income tax should be a proportion of the earnings before taxes, so an estimated ratio of Income tax to EBIT calculated from the past 2 years is used to estimate the future income tax level. The applied ratio is 9.64%, and the estimated Provision for Income Tax for 2023 and 2024 is $1,287 and $1,615 million respectively.
4.2. Balance Sheet and EPS Forecasts
Tesla will not borrow heavily on long-term debt over the next two years as Tesla currently has a stable operating cash flow. Continued good performance will keep Tesla's assets on a growing trend. Based on reasonable assumptions about accounting entries, Tesla's total assets are expected to reach $93,321 and $111,626 million in 2023 and 2024 respectively.
Based on the forecast of the income statement, the estimated EPS level of Tesla in 2023 and 2024 is 3.82 and 4.81 respectively (see Table 6). The same results of the EPS forecast from Yahoo! Finance and Nasdaq also show a similar result, although my forecast in 2023 is higher than the other two, caused by underestimated costs or overestimated revenue [13, 14].
Table 6: EPS forecasts.
Forecasts of EPS | FY 2023 | FY 2024 |
EPS forecast of this paper | 3.82 | 4.81 |
Yahoo! Finance | 3.46 | 4.85 |
Nasdaq | 3.03 | 4.45 |
5. Conclusion
Tesla's excellent financial performance in 2022 is due to three main reasons: expanded net income from good sales performance in the electric vehicles as well as in battery storage; expanded production capacity from newly established plants to ensure adequate supply for the world market; and free cash flow from repayment of significant long-term debt. Whether these characteristics would continue in the future depends on Tesla's ability to continue to maintain a high market share in the electric vehicle segment. The main products in the current EV market are constantly changing, and although Tesla currently has the world's best-selling EVs, it is difficult to respond to consumer demand for a long time with only four products. The best-selling products will become weak if no changes are made, which is the reason why Tesla's revenue is not expected to grow too much in the whole year of 2023 as predicted in the previous article. Therefore, if Tesla wants to continue to perform well in the future, it needs to increase R&D spending and introduce new products to cater to the market while maintaining good sales of existing models. Since Tesla has far better profitability and shareholder returns than its competitors and will continue to be the leader in the new energy vehicle industry in the near term, investors are suggested to hold Tesla's stock for the long term and earn significant returns.
References
[1]. Chen, Y., Perez, Y.: Business Model Design: Lessons Learned from Tesla Motors. In: da Costa, P., Attias, D. Towards a Sustainable Economy . Sustainability and Innovation. Springer, Cham (2018).
[2]. Ding, J., & He, Y.: Tesla Pricing Strategy Analysis: Take Model 3 as an Example. In 2022 7th International Conference on Social Sciences and Economic Development, Atlantis Press, 1010-1014 (2022).
[3]. Tesla Inc. 2022 Annual Report (for the fiscal year ended December 31, 2022). https://www.sec.gov/Archives/edgar/data/1318605/000095017023001409/tsla-20221231.htm, last accessed 2023/6/20.
[4]. Tesla Inc. 2021 Annual Report (for the fiscal year ended December 31, 2021). https://www.sec.gov/Archives/edgar/data/1318605/000095017022000796/tsla-20211231.htm, last accessed 2023/6/20.
[5]. Xianjun Li, Wei Liu, Bowen Zhang, Donghui Meng.: New entrants versus establishers in China and US electric vehicle marketplace: a comparative analysis. Asia Pacific Business Review 25 (1), 19-39 (2019).
[6]. Tesla Inc. 2020 Annual Report (for the fiscal year ended December 31, 2020). https://www.sec.gov/Archives/edgar/data/1318605/000156459021004599/tsla-10k_20201231.htm, last accessed 2023/6/20.
[7]. Volkswagen AG 2022 Annual Report. https://www.volkswagen-newsroom.com/en/publications/corporate/annual-report-2022-1682, last accessed 2023/6/20.
[8]. General Motors Company 2022 Annual Report. https://stocklight.com/stocks/us/manufacturing/nyse-gm/general-motors/annual-reports/nyse-gm-2022-10K-22581477, last accessed 2023/6/20.
[9]. Li 2022 Annual Report. https://liauto.gcs-web.com/financial-information/financial-reports/, last accessed 2023/6/20.
[10]. NIO 2022 annual report. https://ir.nio.com/financials/annual-reports/, last accessed 2023/6/20.
[11]. Five trends transforming the automotive industry. PwC (2023).
[12]. Liu, S. (2021). Competition and Valuation: A case study of Tesla Motors. IOP Conference Series: Earth and Environmental Science, 692(2), 022103.
[13]. Yahoo Finance. https://consent.yahoo.com/v2/collectConsent?sessionId=3_cc-session_6b6f28a0-8663-4625-b324-91c7e40f9dd5, last accessed 2023/6/20.
[14]. Tesla, Inc. (TSLA) Earnings Report Date. Nasdaq. https://www.nasdaq.com/market-activity/stocks/tsla/earnings, last accessed 2023/6/20.
Cite this article
Cao,Z. (2023). Financial Analysis and Valuation on Tesla, Inc.. Advances in Economics, Management and Political Sciences,42,217-224.
Data availability
The datasets used and/or analyzed during the current study will be available from the authors upon reasonable request.
Disclaimer/Publisher's Note
The statements, opinions and data contained in all publications are solely those of the individual author(s) and contributor(s) and not of EWA Publishing and/or the editor(s). EWA Publishing and/or the editor(s) disclaim responsibility for any injury to people or property resulting from any ideas, methods, instructions or products referred to in the content.
About volume
Volume title: Proceedings of the 7th International Conference on Economic Management and Green Development
© 2024 by the author(s). Licensee EWA Publishing, Oxford, UK. This article is an open access article distributed under the terms and
conditions of the Creative Commons Attribution (CC BY) license. Authors who
publish this series agree to the following terms:
1. Authors retain copyright and grant the series right of first publication with the work simultaneously licensed under a Creative Commons
Attribution License that allows others to share the work with an acknowledgment of the work's authorship and initial publication in this
series.
2. Authors are able to enter into separate, additional contractual arrangements for the non-exclusive distribution of the series's published
version of the work (e.g., post it to an institutional repository or publish it in a book), with an acknowledgment of its initial
publication in this series.
3. Authors are permitted and encouraged to post their work online (e.g., in institutional repositories or on their website) prior to and
during the submission process, as it can lead to productive exchanges, as well as earlier and greater citation of published work (See
Open access policy for details).
References
[1]. Chen, Y., Perez, Y.: Business Model Design: Lessons Learned from Tesla Motors. In: da Costa, P., Attias, D. Towards a Sustainable Economy . Sustainability and Innovation. Springer, Cham (2018).
[2]. Ding, J., & He, Y.: Tesla Pricing Strategy Analysis: Take Model 3 as an Example. In 2022 7th International Conference on Social Sciences and Economic Development, Atlantis Press, 1010-1014 (2022).
[3]. Tesla Inc. 2022 Annual Report (for the fiscal year ended December 31, 2022). https://www.sec.gov/Archives/edgar/data/1318605/000095017023001409/tsla-20221231.htm, last accessed 2023/6/20.
[4]. Tesla Inc. 2021 Annual Report (for the fiscal year ended December 31, 2021). https://www.sec.gov/Archives/edgar/data/1318605/000095017022000796/tsla-20211231.htm, last accessed 2023/6/20.
[5]. Xianjun Li, Wei Liu, Bowen Zhang, Donghui Meng.: New entrants versus establishers in China and US electric vehicle marketplace: a comparative analysis. Asia Pacific Business Review 25 (1), 19-39 (2019).
[6]. Tesla Inc. 2020 Annual Report (for the fiscal year ended December 31, 2020). https://www.sec.gov/Archives/edgar/data/1318605/000156459021004599/tsla-10k_20201231.htm, last accessed 2023/6/20.
[7]. Volkswagen AG 2022 Annual Report. https://www.volkswagen-newsroom.com/en/publications/corporate/annual-report-2022-1682, last accessed 2023/6/20.
[8]. General Motors Company 2022 Annual Report. https://stocklight.com/stocks/us/manufacturing/nyse-gm/general-motors/annual-reports/nyse-gm-2022-10K-22581477, last accessed 2023/6/20.
[9]. Li 2022 Annual Report. https://liauto.gcs-web.com/financial-information/financial-reports/, last accessed 2023/6/20.
[10]. NIO 2022 annual report. https://ir.nio.com/financials/annual-reports/, last accessed 2023/6/20.
[11]. Five trends transforming the automotive industry. PwC (2023).
[12]. Liu, S. (2021). Competition and Valuation: A case study of Tesla Motors. IOP Conference Series: Earth and Environmental Science, 692(2), 022103.
[13]. Yahoo Finance. https://consent.yahoo.com/v2/collectConsent?sessionId=3_cc-session_6b6f28a0-8663-4625-b324-91c7e40f9dd5, last accessed 2023/6/20.
[14]. Tesla, Inc. (TSLA) Earnings Report Date. Nasdaq. https://www.nasdaq.com/market-activity/stocks/tsla/earnings, last accessed 2023/6/20.