


1 Introduction
Hong Kong is one of the world's financial centers and its stock market is important in the financial world. In 2021, Hong Kong became the second largest stock market in Asia and the third largest in the world [1]. Proper asset planning in this market will bring many benefits to investors. A portfolio is a common investment tool used by investors, through which they can reduce investment risk while increasing their rate of return. A portfolio allows for faster balanced asset allocation, maximized returns and rational allocation of resources. There are two main objectives for a portfolio of financial products, one is to maximize the rate of return and the other is to minimize risk [2]. By finding a balance between these two points, it can help investors to profit in the financial markets. At the same time, by analyzing the portfolio of the Hong Kong stock market, we can derive the corresponding investment recommendations, such as a certain industry with a high proportion in the portfolio, and thus give the corresponding investment recommendations.
Currently, there are numerous investigations regarding the portfolios in the financial markets. For example, in a paper on the use of intelligent computing for equity portfolio management, it is mentioned that by designing the program properly and identifying variables such as risk and return, it is possible to achieve higher rates of return despite a downtrend in the market. In this literature, the authors use some artificial intelligence algorithms to predict future developments by looking at the past performance of the selected stocks, and also by planning the portfolio for the developments, and get good results in the simulation of the data: the return of the portfolio is much higher than the return of investing in individual stocks, and the risk remains in a manageable range, and it is also mentioned in the paper that with a reasonable design, by It is also mentioned in the paper that with a reasonable design, the portfolio can even achieve a higher return despite the downward trend of the market [3]. Another paper on portfolios in the Chinese financial industry also mentions that introducing risk tolerance into the portfolio management problem by considering the risk contribution of the portfolio components, through a new risk measure that takes into account the risk tolerance, can significantly reduce losses in the presence of market risk. A portfolio with such a measure can helps investors to cope with potential market risks [4]. Another literature on portfolio models mentions that in modern portfolio theory, portfolio optimization can be performed based on a mean-variance model, where returns and risks can be represented by the mean and variance of historical data on stock returns, respectively. By optimizing the portfolio model, the risk can be further reduced while the return can be optimized [5]. In addition to this, a paper based on improved genetic algorithms for portfolio optimization in uncertain environments also mentions that portfolio models can be effectively solved in uncertainty theory using some strategies that usually have better performance to solve the portfolio, and these portfolios can improve returns [6]. A literature on portfolio management with background risk under uncertain mean-variance mentions that when investors have mean-variance preferences, there are more static effects in the portfolio selection problem, but the securities market is complex, so by optimizing the mean-variance model, the portfolio can be optimized to some extent to obtain better results [7].
This study is based on the mean-variance model. By analyzing the return of the screened Hong Kong stocks, we can calculate the return with or without portfolio and the risk distribution, so as to derive the importance of the portfolio. The results show that with reasonable asset planning, higher rates of return or lower risk can be achieved than with individual investments. Secondly, through the analysis of the portfolio, we can also derive the weighting data of different industries, so that we can judge which industries are more suitable to be invested and can make corresponding investment recommendations based on the results. Overall, the E-Commerce and Internet Services industry is the worthiest of investment, although its risk is higher than other industries, but its rate of return is also much higher than other industries, on the whole, it is more worthy of consumers' attention and investment.
2 Method
2.1 Data Collection
According to the data given by Asdaq Finance, the Hong Kong stock market can be divided into a total of 84 industry classifications [8]. In this research, the stock screening will use the top 10 stocks with the highest market capitalization from the top 4 industry categories in the current Hong Kong stock market to calculate the average return as the industry representative. The length of time involved is selected as long as possible, because each company Time to market varies, so average returns are calculated based on the returns of companies with actual data. The higher the volume of the sector indicates that it is more favored by investors, and the higher the market capitalization of the stock indicates that the company corresponding to the stock is larger, and that investors trust these companies more. The names of the selected industries are as follows:
Table 1. The names of the selected industries.
Industry | Turnover (HKD) | Average price-earnings ratio |
E-Commerce and Internet Services | 8.544 billion | 14.42 |
Investment and Asset Management | 2.849 billion | 4.47 |
Auto & Parts | 1.115 billion | 60.02 |
Bank | 904 million | 7.53 |
Notes: Data Source: Asdaq Finance
Based on the previous selection, we identified the top 10 stocks in terms of market capitalization from each of the 4 industries and obtained all adjusted closed market prices for each stock where possible [9], and calculated the return for each stock in Excel, followed by the average return for all stocks in each individual industry. And the weekly average returns of these four industries were combined to then obtain the primary research data for this study. Some basic descriptive statistics of the selected assets are shown in the following Table 2.
Table 2. Descriptive statistics of the selected assets.
Industry | Min | Max | Mean | Std. dev |
E-Commerce and Internet Services | -0.2537 | 0.2009 | 0.0049 | 0.0531 |
Investment and Asset Management | -1.7109 | 0.1831 | -0.0028 | 0.0689 |
Auto & Parts | -0.3617 | 0.1721 | 0.0009 | 0.0500 |
Bank | -1.6316 | 0.1234 | -0.0012 | 0.0622 |
From the above Table 2, several interesting discoveries can be found. The Investment and Asset Management and Bank industries’ standard deviation are both larger than 0.06, while the return for these two industries are both negative, E-Commerce and Internet Services and Auto & Parts industries’ return are both positive while the return of E-Commerce and Internet Services is larger than Auto & Parts. Meanwhile, the standard deviation of E-Commerce and Internet Services is about 0.003 larger than Auto & Parts. Through these data, the E-Commerce and Internet Services is a good industry for investor to invest.
2.2 Research Method
After obtaining the primary data set, we can input the data into R and simulate the data using the mean-variance model. The mean-variance model was proposed by economist Harry Markowitz in 1952 as a mathematical framework mostly used in asset portfolios to maximize the expected return for a given level of risk [10]. The combination of multiple assets will result in much less risk than selecting a single asset to invest in, while maximizing the rate of return. The main idea of the mean-variance model is that the risk and return of an asset should not be evaluated separately, but rather the overall risk and return should be considered [11].
In order to calculate the portfolio, return by using the mean-variance model, the formula is below:
\( E({R_{p}})={w_{A}}E({R_{A}})+{w_{B}}E({R_{B}})+ {w_{c}}E({R_{C}})+ {w_{D}}E({R_{D}}) \) | (1) |
where \( {R_{p}} \) is the return on the portfolio, \( {R_{A,B,C,D}} \) is the return on the chosen four industries respectively, \( {w_{A,B,C,D}} \) is the weighting of chosen four industries, respectively.
Due to the theory of weight, the limited function 2 is below:
\( {w_{A}}+ {w_{B}}+{w_{C}}+{w_{D}}=1 \) | (2) |
According to formula 2, the formula 1 can be changed to:
\( E({R_{p}})={w_{A}}E({R_{A}})+{w_{B}}E({R_{B}})+ {w_{c}}E({R_{C}})+(1-{w_{A}}-{w_{B}}-{w_{C}})E({R_{D}}) \) | (3) |
The below formula is for calculate portfolio variance:
\( σ_{p}^{2}= w_{A}^{2}σ_{A}^{2}+w_{B}^{2}σ_{B}^{2}+w_{C}^{2}σ_{C}^{2}+w_{D}^{2}σ_{D}^{2}+2{w_{A}}{w_{B}}{σ_{A}}{σ_{B}}{ρ_{AB}}+ 2{w_{A}}{w_{C}}{σ_{A}}{σ_{C}}{ρ_{AC}}+ 2{w_{A}}{w_{D}}{σ_{A}}{σ_{D}}{ρ_{AD}}+2{w_{B}}{w_{C}}{σ_{B}}{σ_{C}}{ρ_{BC}}+ 2{w_{B}}{w_{D}}{σ_{B}}{σ_{D}}{ρ_{BD}}+2{w_{C}}{w_{D}}{σ_{C}}{σ_{D}}{ρ_{CD}} \) | (4) |
where σ(A,B,C,D) is the standard deviation of the periodic returns on four chosen industries respectively, and ρ(AB,AC,AD,BC,BD,CD) is the correlation coefficient between the return on industries A&B, A&C, A&D, B&C, B&D, C&D respectively.
The risk of the portfolio is standard deviation, it is easy to get it through below function by using variance:
\( {σ_{p}}= \sqrt[]{σ_{p}^{2}} \) | (5) |
The dependent variables in this study are the mean of the set value y, which can be interpreted as the rate of return, and the standard deviation, which can be interpreted as the value at risk.
The key independent variables in this study are the weight values, and in order to be able to cover all the weight values as much as possible, we have used the exhaustive method so as to obtain all possible weight data.
3 Result
3.1 Overall
After calculations, it is easy to know that the return for all portfolio is range from 0.0365 to -0.03235, while the risk for all portfolio is range from 0.0403 to 0.7124. The individual stocks selected in the previous section are mainly concentrated in the first half of the plot. The picture of all possible portfolio with individual industries are followed:
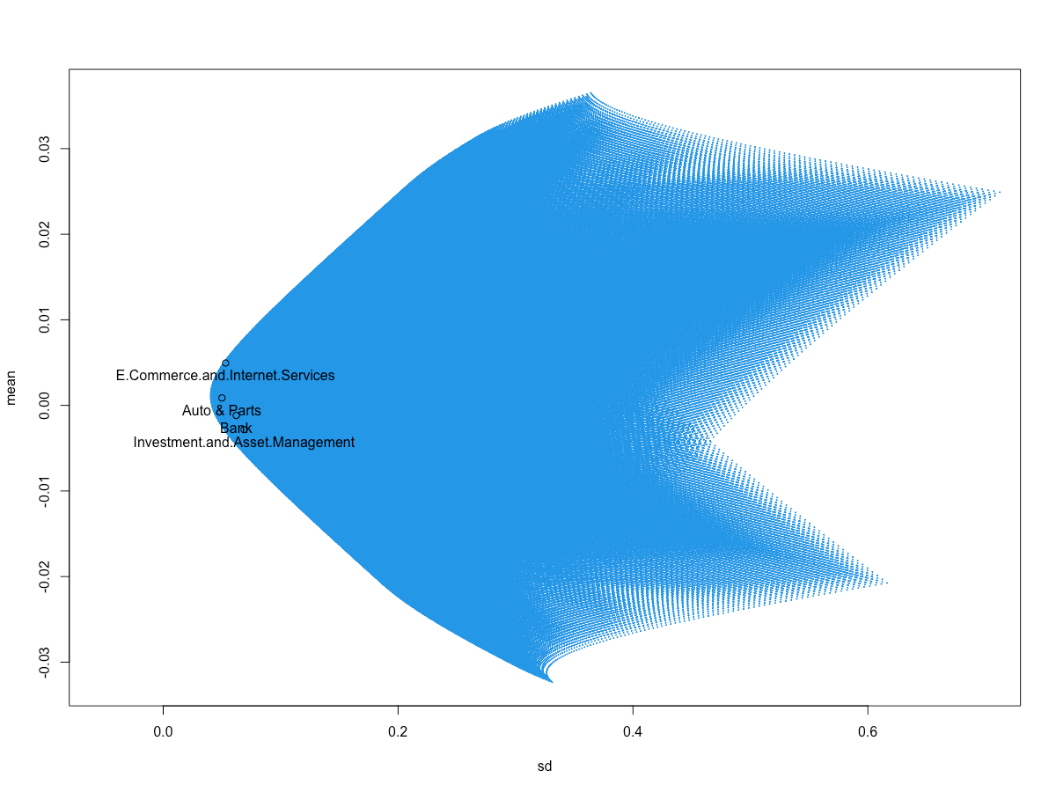
Fig. 1. All the possible portfolio with single industry’s mean and standard deviation.
In the graph, the return on all possible asset portfolios and the risk are shown in blue, while the risk and return if investing in individual sectors are also marked in the graph.
3.2 Maximum Return and Minimum Risk Portfolio
Based on the results obtained, we can find the asset portfolio with the highest return and minimum risk among all the portfolio information is as follows.
Table 3. The detail of maximum return and minimum risk portfolio.
E-Commerce and Internet Services | Investment and Asset Management | Auto & Parts | Bank | |
Sigle Return | 0.0049 | -0.0028 | 0.0087 | -0.0012 |
Sigle Risk | 0.0531 | 0.0689 | 0.0500 | 0.0621 |
Maximum Return Portfolio Weight | 400% | -300% | 400% | -400% |
Maximum Return Portfolio Return | 0.0365 | |||
Maximum Return Portfolio Risk | 0.3641 | |||
Minimum Risk Portfolio Weight | 32.3232% | 11.1111% | 32.3232% | 24.2424% |
Minimum Risk Portfolio Return | 0.0013 | |||
Minimum Risk Portfolio Risk | 0.0403 | |||
The position of these two-asset portfolio on the chart is as follows:
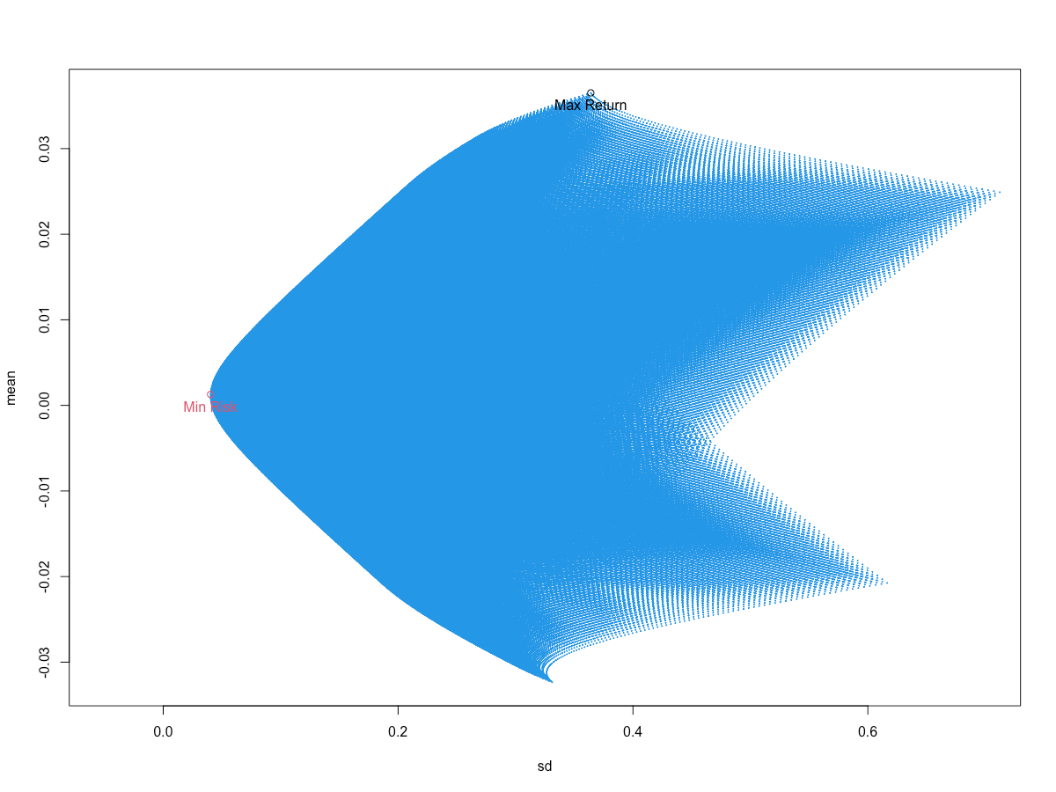
Fig. 2. The position of minimum risk portfolio and maximum return portfolio in plot.
If we compare these two points with the points of individual industries, the plot is below:

Fig. 3. The position of minimum risk portfolio and maximum return portfolio in plot.
The chart shows that if the portfolio with the highest return is chosen, the risk will be substantially increased compared to investing in one sector alone, and if the least risky is chosen, the return will remain positive but substantially reduced compared to choosing the four sectors alone. In the plot, it shows that, the Auto & Parts industries is very closed to the minimum risk portfolio. But its risk is higher than the minimum risk portfolio and the return is lower than the minimum risk portfolio. The point of maximum return portfolio represents the highest return, but also with higher risk than the other four individual industries.
By calculation, the highest yield E-Commerce and Internet Services industry has a yield of 0.0049, so we can calculate the minimum risk portfolio with the same yield as follows:
Table 4. The portfolio with same return but lower risk compared to individual invest E-Commerce and Internet Services industry.
E-Commerce and Internet Services | Investment and Asset Management | Auto & Parts | Bank | |||
Portfolio Weight | 86.9859% | -16.0137% | 25.9742% | 3.0536% | ||
Sigle Risk | 0.0531 | 0.0689 | 0.0500 | 0.0622 | ||
Portfolio Risk | 0.0514 | |||||
Portfolio Return | 0.0049 | |||||
Relative Risk | -3.31% | -25.461% | 2.717% | -17.367% | ||
If investors accept the same rate of return, through portfolio management can reduce the risk by about 3.31%, or even by 25% while increasing the rate of return. This shows that a reasonable portfolio is very important.
In addition, from the three special points derived, it is easy to see that the E-Commerce and Internet Services industry has been in a larger position, which may be used as a reference recommendation for investors to invest. Investors can choose the E-Commerce and Internet Services industry as much as possible as an investment target.
4 Conclusion
After the above calculations and results, it is easy to see that risk can be effectively avoided by a portfolio while obtaining a high rate of return, in addition to finding a better balance between choosing risk or choosing return and increasing the rate of return while limiting risk. For some investor, the main invest aim can be set to the E-Commerce and Internet Services industry, this industry have highest return with a lower risk. According to the result of portfolio, the weight of this industry is always higher than the others.
However, this study also has the same drawbacks, for example, the selected order of magnitude is not enough to reflect the overall situation of the market, generally there will be a large number of stocks in an industry, think dry stock market there are also thousands of stocks, the analysis of all stocks can be better to find a more general point of view, but at the same time will also consume a lot of time. Selecting some stocks as representatives can effectively reduce the computing time, but it will also make the results lose generality. In addition, the most important thing is that the financial market has strong uncertainty. Therefore, the above results can only be used as a reference for the current point in time and do not indicate the future direction of changes in the stock market.
References
[1]. Qin Dian Star - International Financial Centre - How did Hong Kong develop?, https://www.qindianstar.com/34915/.html, last accessed 2022/06/18.
[2]. Cooper R G, F., Edgett S J, S., Kleinschmidt E J, T.: Portfolio Management. Pegasus, New York (2001).
[3]. DÍAZ, R., F., SOLARES, E., S., DE-LEÓN-GÓMEZ, V.,T., etal.: Stock Portfolio Management in the Presence of Downtrends using Computational Intelligence. Journal 12(8), 4067, (2022).
[4]. LIU, J., F., CHENG, Y., S., LI, X., T., etal.: The Role of Risk Forecast and Risk Tolerance in Portfolio Management: A Case Study of the Chinese Financial Sector. Journal 11(3), 134 (2022).
[5]. PUSHPA, N.R., F., Luan Carlos de Sena, S., Monteiro Ozelim, T., etal.: Portfolio Management of Copula-Dependent Assets Based on Reliability Models: Revisiting Frank Copula and Dagum Distributions. Journal 4(4), 1027 (2021).
[6]. MITTAL, S.K., F., and NAMITA, S., S.: Mean-Variance-Skewness Portfolio Optimization Under Uncertain Environment using Improved Genetic Algorithm. Journal 54(8), 6011-6032 (2021).
[7]. HUANG, X., F., and GUOWEI, J., S.: Portfolio Management with Background Risk Under Uncertain Mean-Variance Utility. Journal 20 (3), 315-330 (2021).
[8]. All Industry Classifications, http://www.aastocks.com/sc/stocks/market/industry/industry-performance.aspx?&s=4&o=0, last accessed 2022/06/18.
[9]. Yahoo Finance Home Page, https://hk.finance.yahoo.com/, last accessed 2022/06/18.[9] Yahoo Finance Home Page, https://hk.finance.yahoo.com/, last accessed 2022/06/18.[9] Yahoo Finance Home Page, https://hk.finance.yahoo.com/, last accessed 2022/06/18.
[10]. Markowitz, H.M., F.: Portfolio Selection. Journal 7(1), 77-91, (1952).
[11]. Financial Time, https://www.ft.com/content/be68aac6-3d13-11e8-b9f9-de94fa33a81e, last accessed 2022/06/18
Cite this article
Li,Q. (2023). Mean-Variance Application of Portfolio Management in Hong Kong Stock Market. Advances in Economics, Management and Political Sciences,3,729-735.
Data availability
The datasets used and/or analyzed during the current study will be available from the authors upon reasonable request.
Disclaimer/Publisher's Note
The statements, opinions and data contained in all publications are solely those of the individual author(s) and contributor(s) and not of EWA Publishing and/or the editor(s). EWA Publishing and/or the editor(s) disclaim responsibility for any injury to people or property resulting from any ideas, methods, instructions or products referred to in the content.
About volume
Volume title: Proceedings of the 6th International Conference on Economic Management and Green Development (ICEMGD 2022), Part Ⅰ
© 2024 by the author(s). Licensee EWA Publishing, Oxford, UK. This article is an open access article distributed under the terms and
conditions of the Creative Commons Attribution (CC BY) license. Authors who
publish this series agree to the following terms:
1. Authors retain copyright and grant the series right of first publication with the work simultaneously licensed under a Creative Commons
Attribution License that allows others to share the work with an acknowledgment of the work's authorship and initial publication in this
series.
2. Authors are able to enter into separate, additional contractual arrangements for the non-exclusive distribution of the series's published
version of the work (e.g., post it to an institutional repository or publish it in a book), with an acknowledgment of its initial
publication in this series.
3. Authors are permitted and encouraged to post their work online (e.g., in institutional repositories or on their website) prior to and
during the submission process, as it can lead to productive exchanges, as well as earlier and greater citation of published work (See
Open access policy for details).
References
[1]. Qin Dian Star - International Financial Centre - How did Hong Kong develop?, https://www.qindianstar.com/34915/.html, last accessed 2022/06/18.
[2]. Cooper R G, F., Edgett S J, S., Kleinschmidt E J, T.: Portfolio Management. Pegasus, New York (2001).
[3]. DÍAZ, R., F., SOLARES, E., S., DE-LEÓN-GÓMEZ, V.,T., etal.: Stock Portfolio Management in the Presence of Downtrends using Computational Intelligence. Journal 12(8), 4067, (2022).
[4]. LIU, J., F., CHENG, Y., S., LI, X., T., etal.: The Role of Risk Forecast and Risk Tolerance in Portfolio Management: A Case Study of the Chinese Financial Sector. Journal 11(3), 134 (2022).
[5]. PUSHPA, N.R., F., Luan Carlos de Sena, S., Monteiro Ozelim, T., etal.: Portfolio Management of Copula-Dependent Assets Based on Reliability Models: Revisiting Frank Copula and Dagum Distributions. Journal 4(4), 1027 (2021).
[6]. MITTAL, S.K., F., and NAMITA, S., S.: Mean-Variance-Skewness Portfolio Optimization Under Uncertain Environment using Improved Genetic Algorithm. Journal 54(8), 6011-6032 (2021).
[7]. HUANG, X., F., and GUOWEI, J., S.: Portfolio Management with Background Risk Under Uncertain Mean-Variance Utility. Journal 20 (3), 315-330 (2021).
[8]. All Industry Classifications, http://www.aastocks.com/sc/stocks/market/industry/industry-performance.aspx?&s=4&o=0, last accessed 2022/06/18.
[9]. Yahoo Finance Home Page, https://hk.finance.yahoo.com/, last accessed 2022/06/18.[9] Yahoo Finance Home Page, https://hk.finance.yahoo.com/, last accessed 2022/06/18.[9] Yahoo Finance Home Page, https://hk.finance.yahoo.com/, last accessed 2022/06/18.
[10]. Markowitz, H.M., F.: Portfolio Selection. Journal 7(1), 77-91, (1952).
[11]. Financial Time, https://www.ft.com/content/be68aac6-3d13-11e8-b9f9-de94fa33a81e, last accessed 2022/06/18