


1. Introduction
SSEC and SZSE are broad price indexes in China, reflecting the stock market changes to some extent, the investors are able to measure the economic cycle changes based on these indexes, using them as barometers for the stock market [1]. Meanwhile, the results of the empirical analysis show that the monthly weighted average interest rates of Chinese interbank lending rates have an inverse trend with the SSEC and SZSE. Although the impact between interest rate and stock market is not significant enough for the imperfect structure of Chinese stock market and unstandardized market operation, it can illustrate that SSEC and SZSE have a reflection of Chinese rate [2].
In the case of the SSEC, some scholars have linked it with international gold and crude oil prices and used time series analysis to demonstrate the time series characteristics and dynamic relationship between SSEC-WTI crude oil prices and SSEC-gold price fluctuations at different frequencies, with the aim of providing new ideas for risk investors to reduce their risk exposures [3]. Also, researcher have sampled the weekly return time series of the SZSE, focusing on the performance of the SZSE during the two financial crises to analyze the degree of market efficiency at that time, and concluded that the financial crisis had a significant positive effect on market regulation, trading system improvement and overall market efficiency in the long run [4]. These cases show that SSEC and SZSE can reflect the characteristics or trends of the economic situation in China or even the world, providing some guidance for investors and policy makers in the implementation of plans. Studies have shown that stock market fluctuations have state persistence, correlation and regularity and the predictability of SSEC and SSZE has been demonstrated by previous authors, so this paper intends to perform their predictive analysis to specifically analyze the movements of the Chinese stock market [5].
In late 2019, the routine life of Chinese people was disrupted by the sudden outbreak of COVID-19, and with the introduction of nationwide home quarantines, work stoppages, and other regulated control measures, it was difficult for economic activities in China to proceed smoothly [6]. Findings show that long-term and short-term implications of the coronavirus pandemic appear to be different, with the global economy gradually returning to the baseline just after a short rebound. From the industrial perspective, a significant decline in global services and agricultural output has been witnessed in the short term. From the long-term perspective, however, the pattern of manufacturing global value chains has changed profoundly [7]. In terms of individual market risk volatility, the pandemic has a significant positive short-term impact on stock market risk volatility across countries, causing systemic risk. In terms of cross-market risk contagion levels, the spillover effects of the pandemic on inter-stock markets are also amplified in the short run but gradually decrease [8]. On March 9, 2020, there existed a plunge in global equity markets in chain reaction, hit by the coronavirus pandemic. The U.S. S&P 500 index fell by 7%, the Nikkei 225 index plunged 5.07%, the Hang Seng index closed down 4.23%, and the SSEC index fell 7.72%, all the largest declines within one day in latest years [9]. Global financial markets are increasingly interdependent in this highly globalized world as stock market volatility individually do not always stay steady and financial volatility between regions can be mutually disruptive. There is increasing risk of resonance in global markets and systematic risk is exacerbated.
At the beginning of 2022, China's zero-COVID policy had rapidly stopped a number of coronavirus outbreaks linked to cases of foreigners entering, providing assurance of reasonableness to maintain the policy for more than one year and a half, but in many ways limited economic development. It is believed that changes will happen in the near future, as COVID-19 is considered to coexist with people as a general infectious disease [10]. The previous experiment depicted a new quantitative relationship between psychological reactions and stock prices during the pandemic, expressing the mechanism of shocks to the stock market through the specific function of impulse responses [11].
On April 11, 2022, in Shanghai, the government announced that city's closure control would be gradually reduced [12]. Evidence suggested that in the early stages of the pandemic social policy responses mainly concentrated on meeting people’s temporary needs. The focus was on unconventional social policy instruments in addition to labor market and social assistance measures [13]. Yet, differences in the implementation of prevention and control measures raised questions about why countries adopt social distance policies, whether there is rational analysis based on their own conditions or just a copy of other countries' policies. [14].
The Chinese government finally declared the deregulation policy on December 8, 2022. As a result, this paper intends to use ARIMA model with the data during the pandemic (January 24, 2020 to December 8, 2022) as the training set and the values for two months after the deregulation as the test set, compare the two data set and get some conclusion. There are experiments that have illustrated the possibility and practicability of using ARIMA to study stock prices, providing theoretical guidance for this experiment [15].
The road to recovery after the pandemic still requires continuous efforts and reflections, and certain experiences and lessons should be learned from this pandemic [16]. The COVID-19 pandemic has influenced the trend of structural changes over the world economy. New ways of living and working have been created with the introduction of national closure control policies and the iteration of new technologies. In the future, countries around the world must increase cooperation and adopt open policies together [17]. COVID-19 pandemic aggravates the flock effect, expands the ups and downs of the stock market and intensifies product’s volatility and reduces market effectiveness. It is of importance to accurately identify the flock effect in the future to stabilize the economic development and prevent systematic financial risks [18].
Next, information about the data source, data stability, and the models are covered in Section 2. Section 3 follows with a full discussion of the results from the ARIMA model, as well as additional analysis on the stock return and market participants' behavior. Following that, there is a discussion on the study's focus, objective and importance. Finally, Section 5 reiterates the final conclusion briefly.
2. Research Design
2.1. Data Source
Among the most famous social economic indexes, SSEC and SZSE have large masses of data available; they can be representative and serve as barometers of current stock market. The study extracted daily closing stock prices of SSEC and SZSE between January 24, 2020 and December 8, 2022 from investing.com. The rationale for halting data collection till now is to avoid the impact of the issue that China released its deregulation policy, the accurate date of which is December 9, 2022. Data processing is required to figure out the impact of deregulation policy on SSEC and SZSE stock return fluctuations. SSEC and SZSE stock returns are obtained by dividing the difference between two days' closing stock prices by the one on the previous day, and data is transformed by the formula \( ln{(1+x)} \) , continuing analysis in the logarithmic scale. With the updated edited data, Stata was used to analyze the data and construct models for further exploration.
2.2. ADF Test
Testing whether or not the data are stationary should be considered before proceeding [19]. The relevant experimental steps are implemented in Stata, and the p-values for raw and differenced variables of SSEC and SZSE are shown below in Table 1. The p-values of raw statistics are large, indicating that they are not stationary, while the p-values of differenced data equal to 0, which are considered statistically significant [20]. In all, the differenced variables are stationary models built on them are proper.
Table 1: ADF test.
Variables | t-statistic | p-value |
Raw | ||
SSEC | -2.188 | 0.4964 |
SZSE | -1.947 | 0.6299 |
Difference | ||
SSEC | -8.558 | 0.0000*** |
SZSE | -8.184 | 0.0000*** |
2.3. ARIMA Model
ARIMA model is one of the time series predictive analysis methods. The autoregressive model, AR(p) model, is a model that describes the effect of the past p values on the current value in a time series. A non-stationary time series is one in which the trend or periodicity of the data changes rapidly, which can lead to poor model predictions. An integrated model is a model used to deal with non-stationary time series [21]. It can transform a non-stationary time series into a stationary one by d-order difference, which makes the model easier to describe. The moving average model, or MA(q) model, is a model that describes the relationship between the error value at a point in the time series and the error value at q past points [22].
AR and MA are combined to obtain the ARMA (p, q) model within the expression:
\( {y_{t}}=c+\sum _{i=1}^{p}{∅_{i}}{y_{t-i}}+\sum _{i=1}^{q}{θ_{i}}{ε_{t-i}}+{ε_{i}} \) | (1) |
where: \( {y_{t}} \) is the current moment of the time series; \( c \) is the constant term; \( {∅_{i}} \) is the coefficient of the autoregressive term used to describe the effect of the values of the past p values on the current moment; \( {θ_{i}} \) is the coefficient of the moving average term to describe the effect of the past q error terms on the current moment; \( {ε_{i}} \) is the random error term.
3. Experimental Process and Analysis
3.1. Order of ARIMA Model
In order to determine p and q in the ARIMA model, PACF and ACF plots of the log-return data after one difference are needed.
This part uses the PACF plot to determine the order of q: when the xth order line exceeds the confidence interval x can be assigned to q. PACF plot is used to determine the order of p: when the xth order line exceeds the confidence interval x can be assigned to p. ACF plot is used to determine the order of p: when the xth order line exceeds the confidence interval x can be assigned to p.
PACF | ACF | |
SSEC | ||
|
| |
SZSE | ||
|
| |
Figure 1: PACF and ACF. | ||
Photo credit: Original | ||
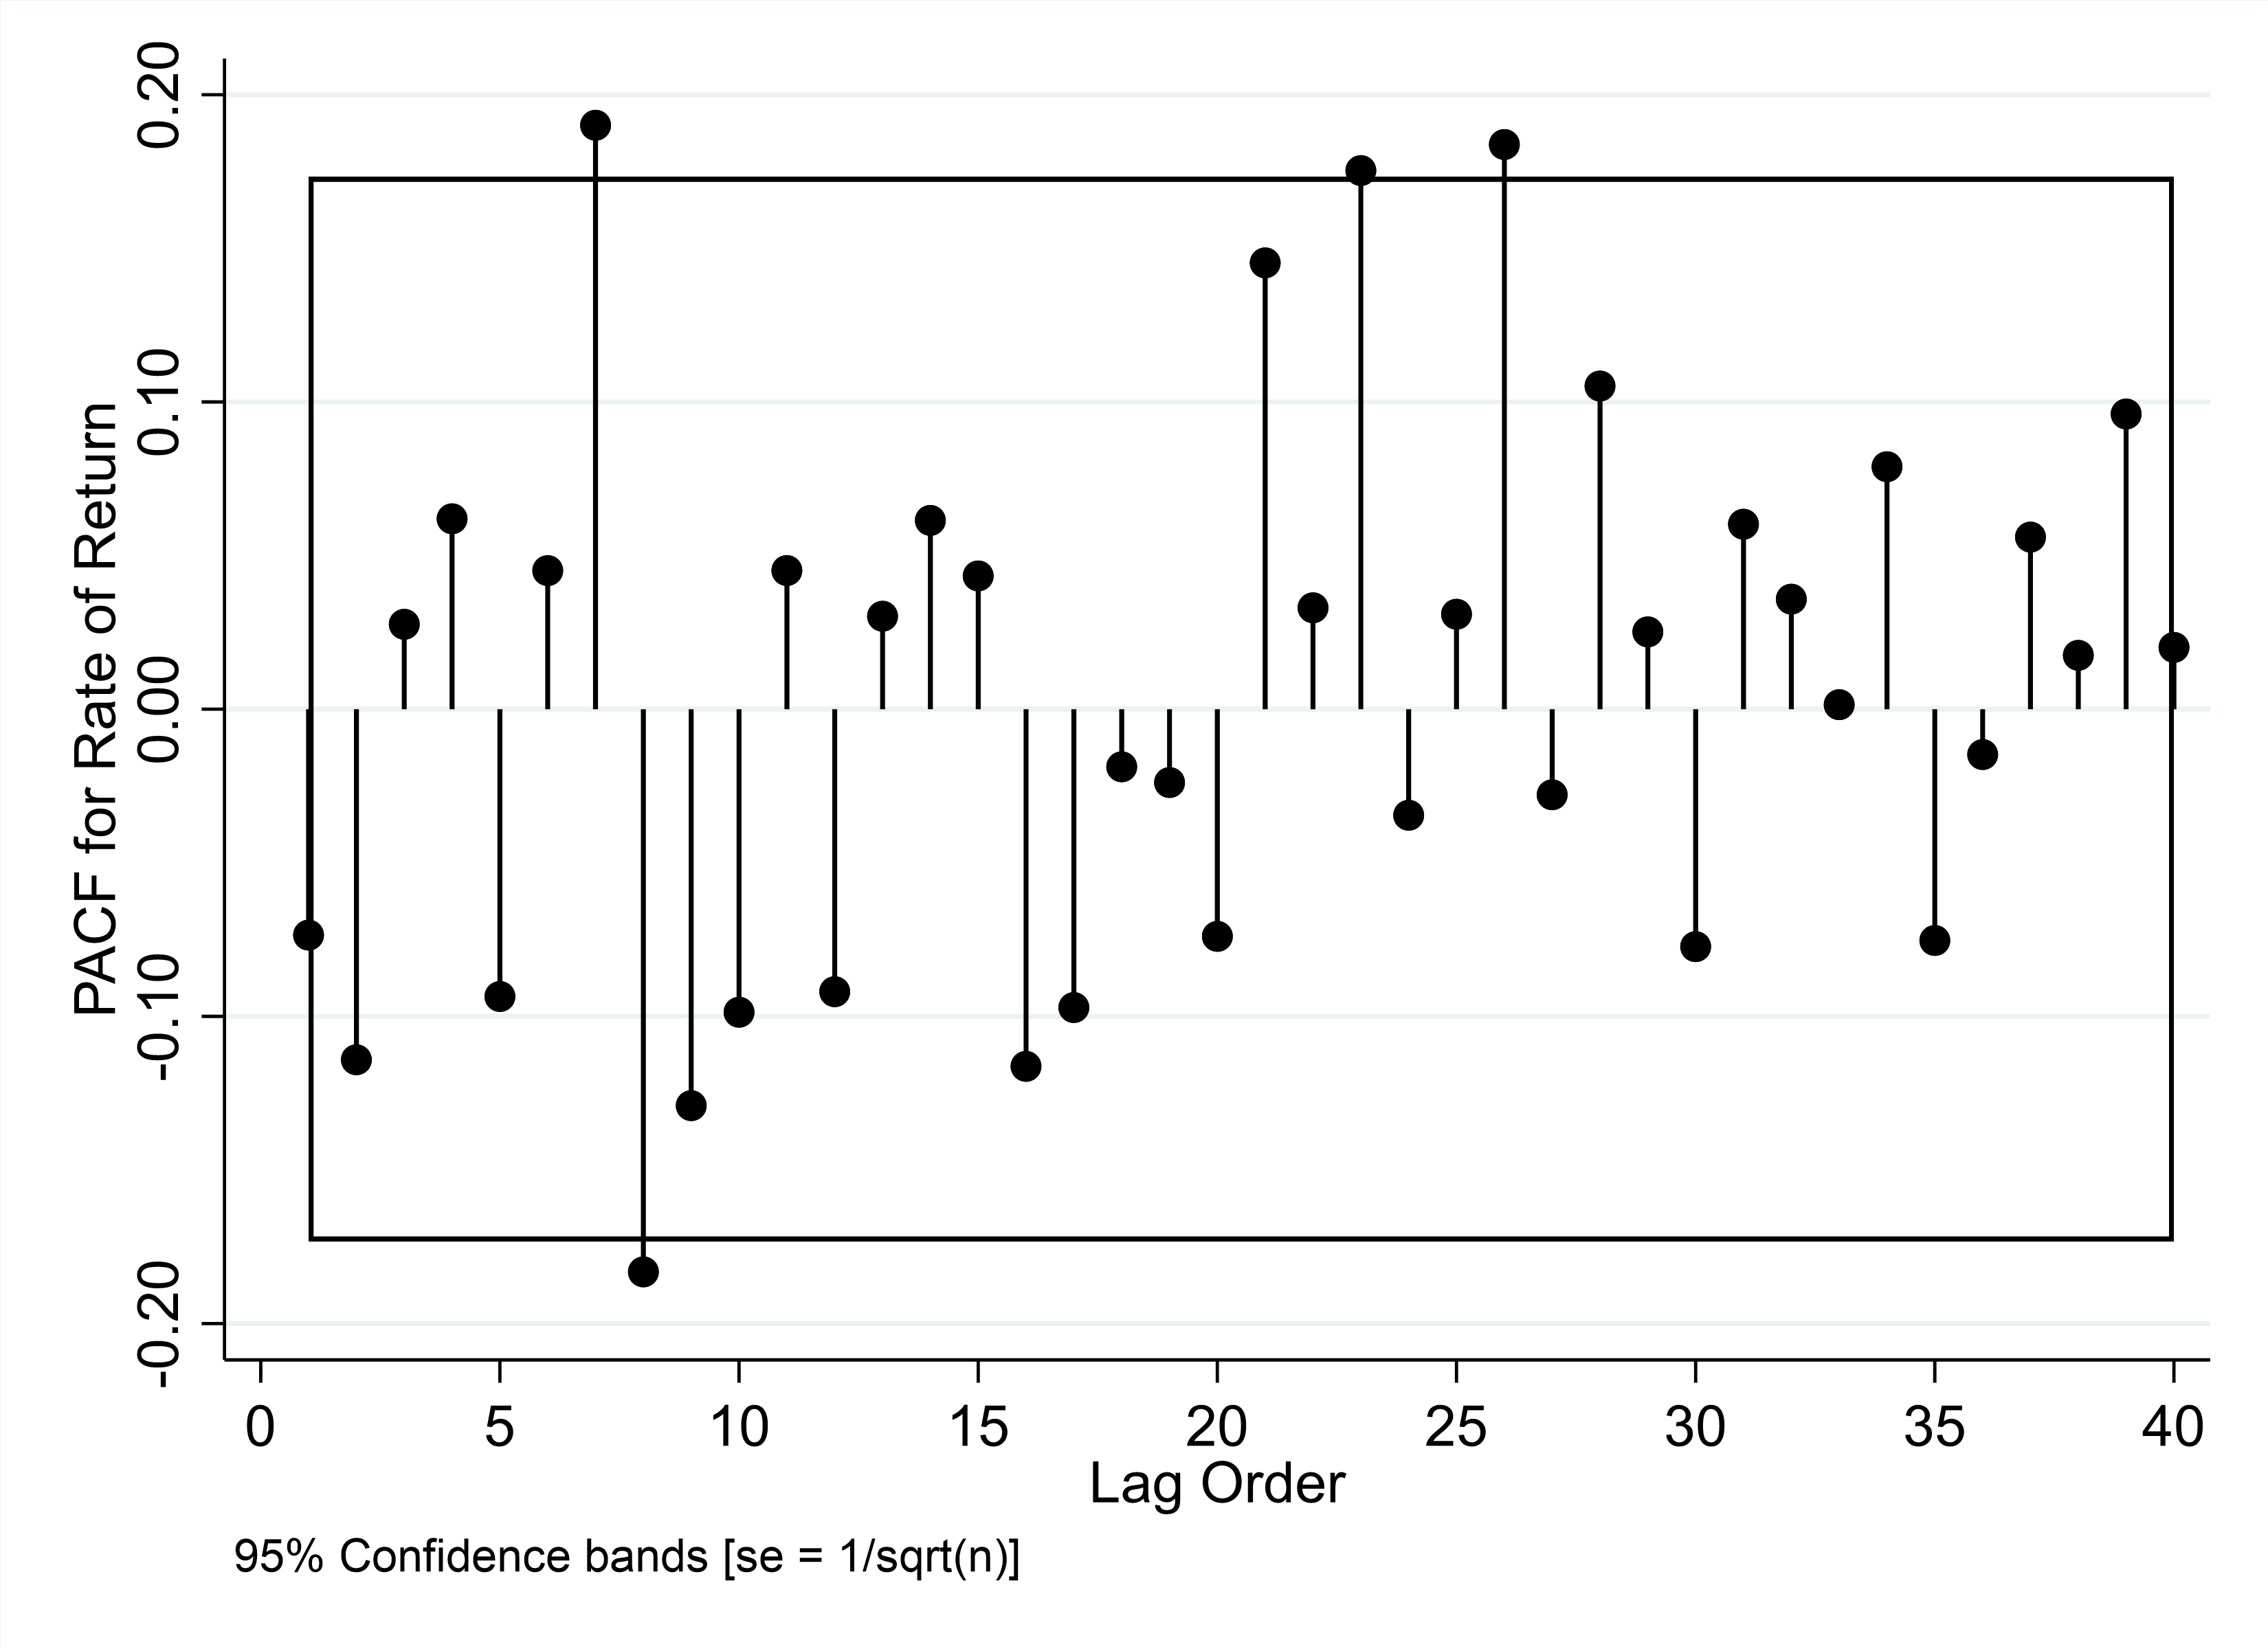
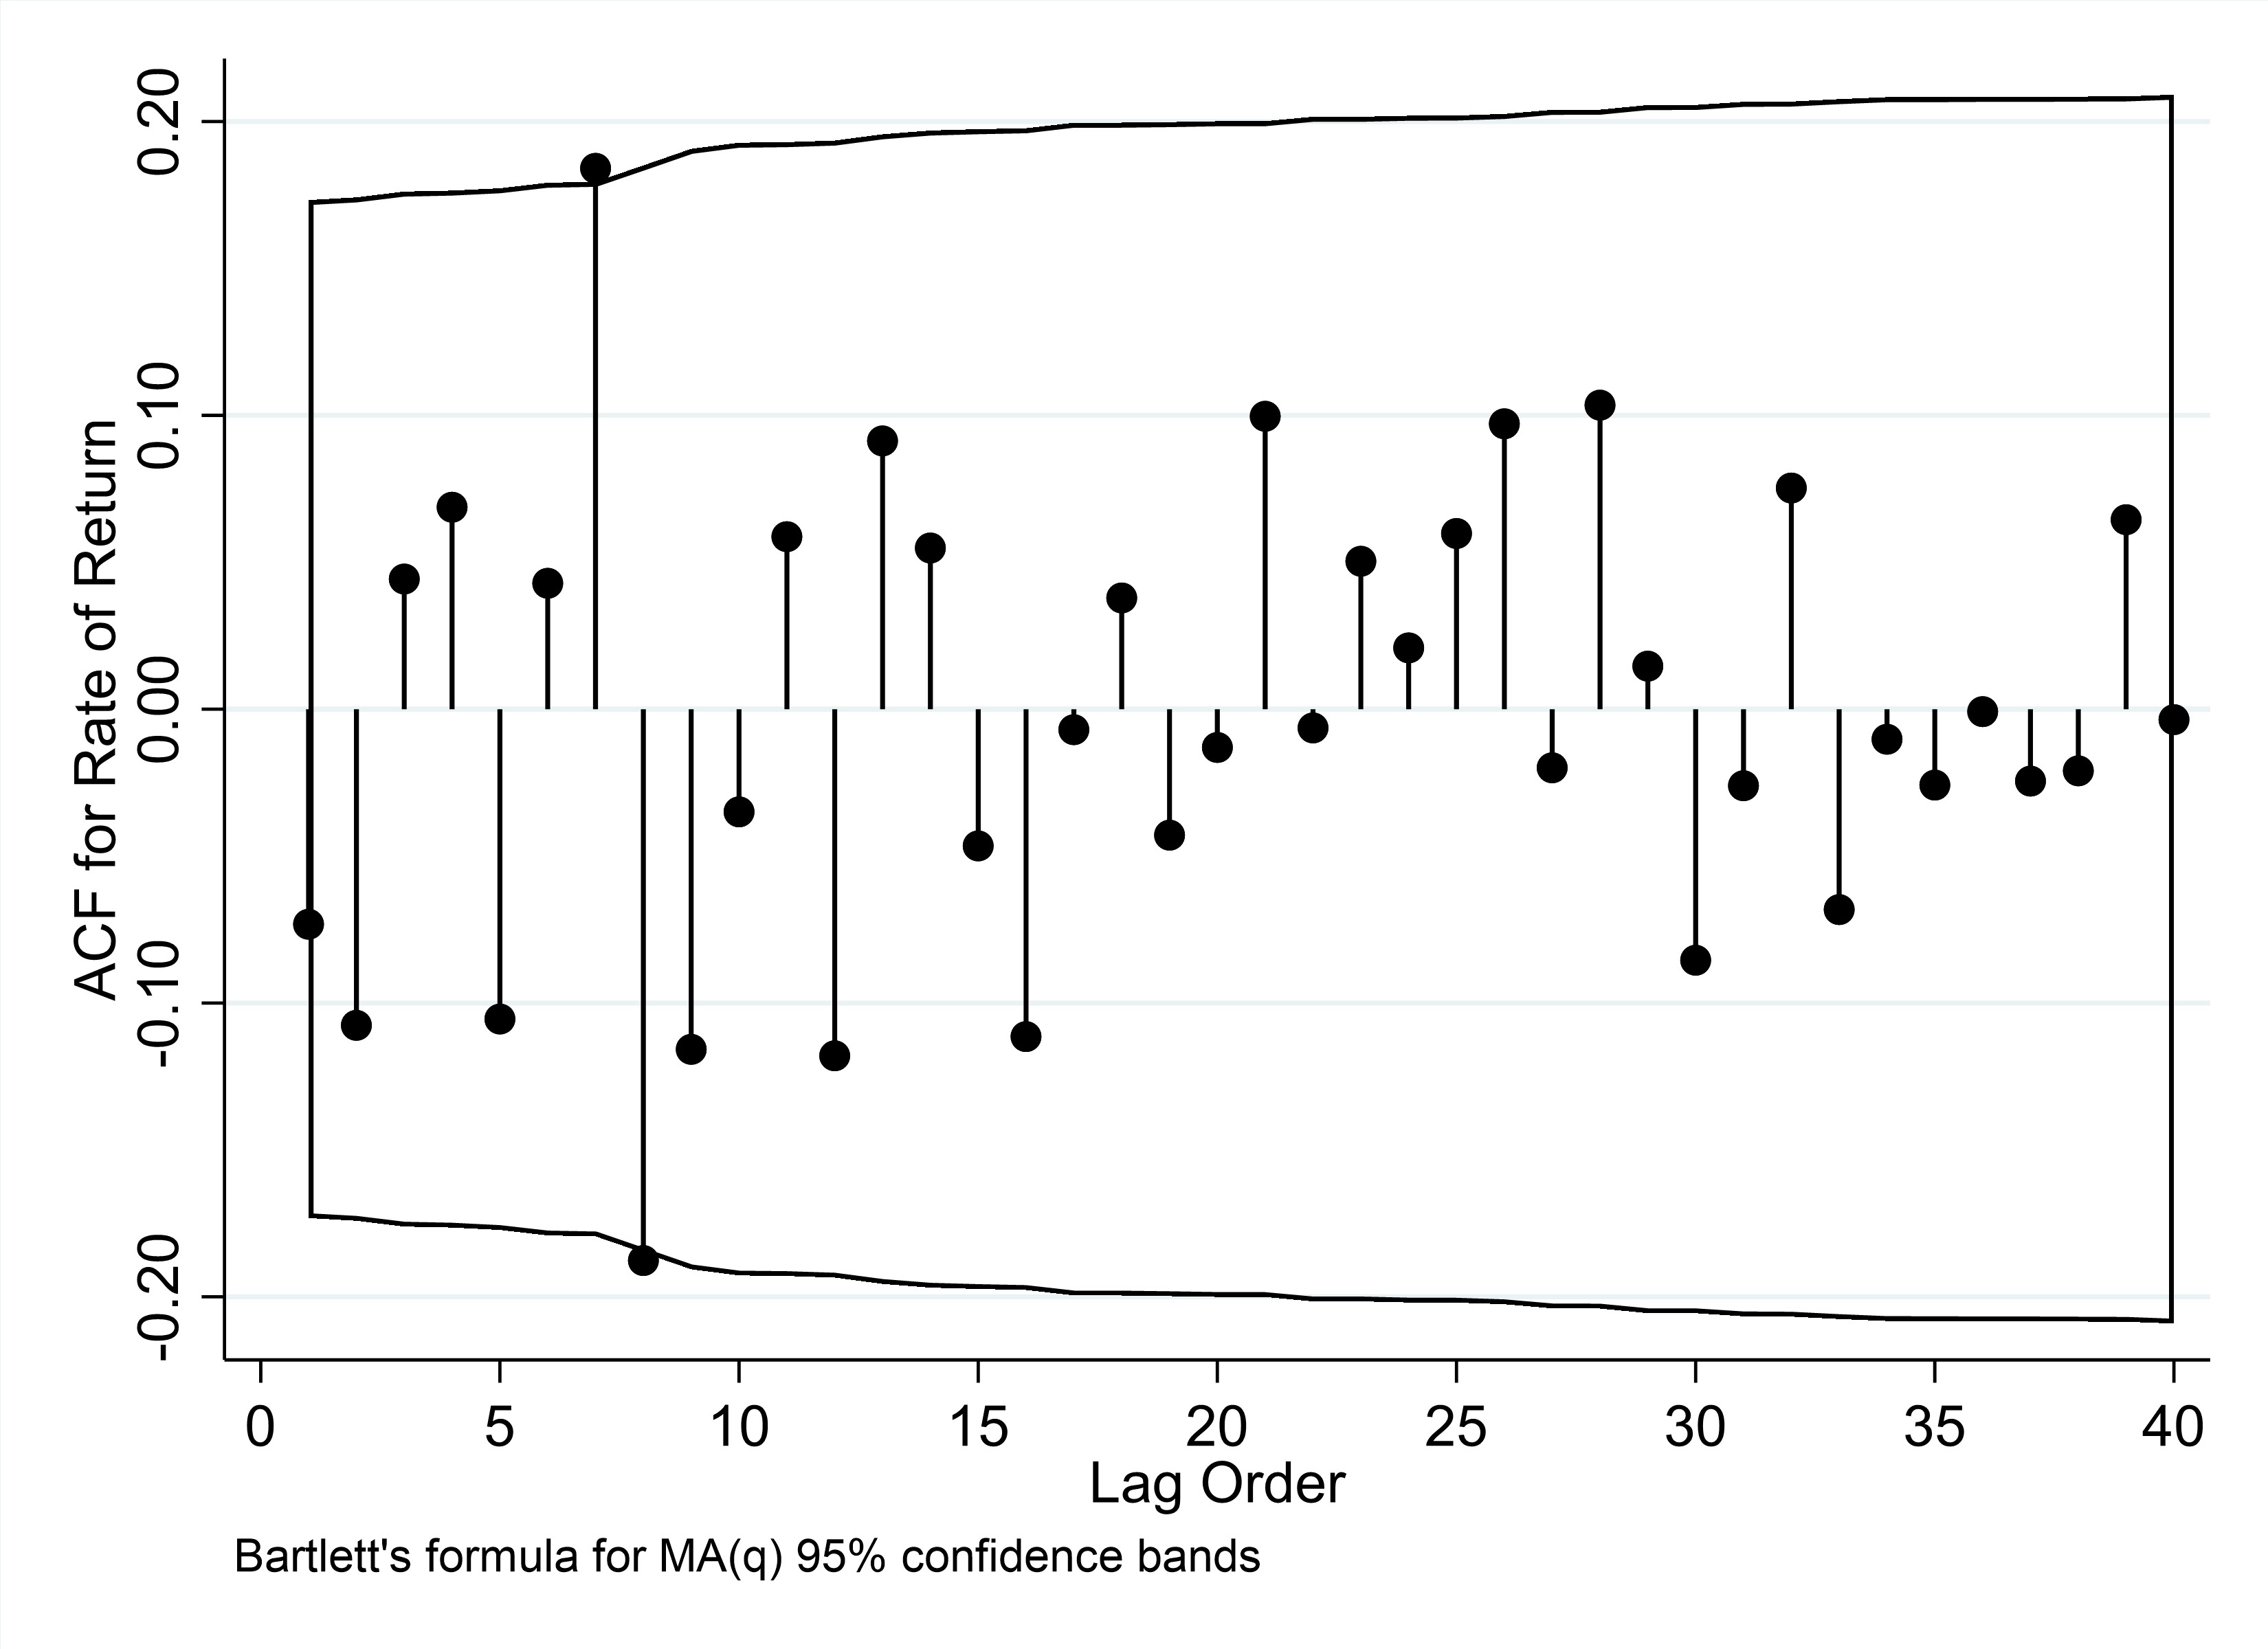
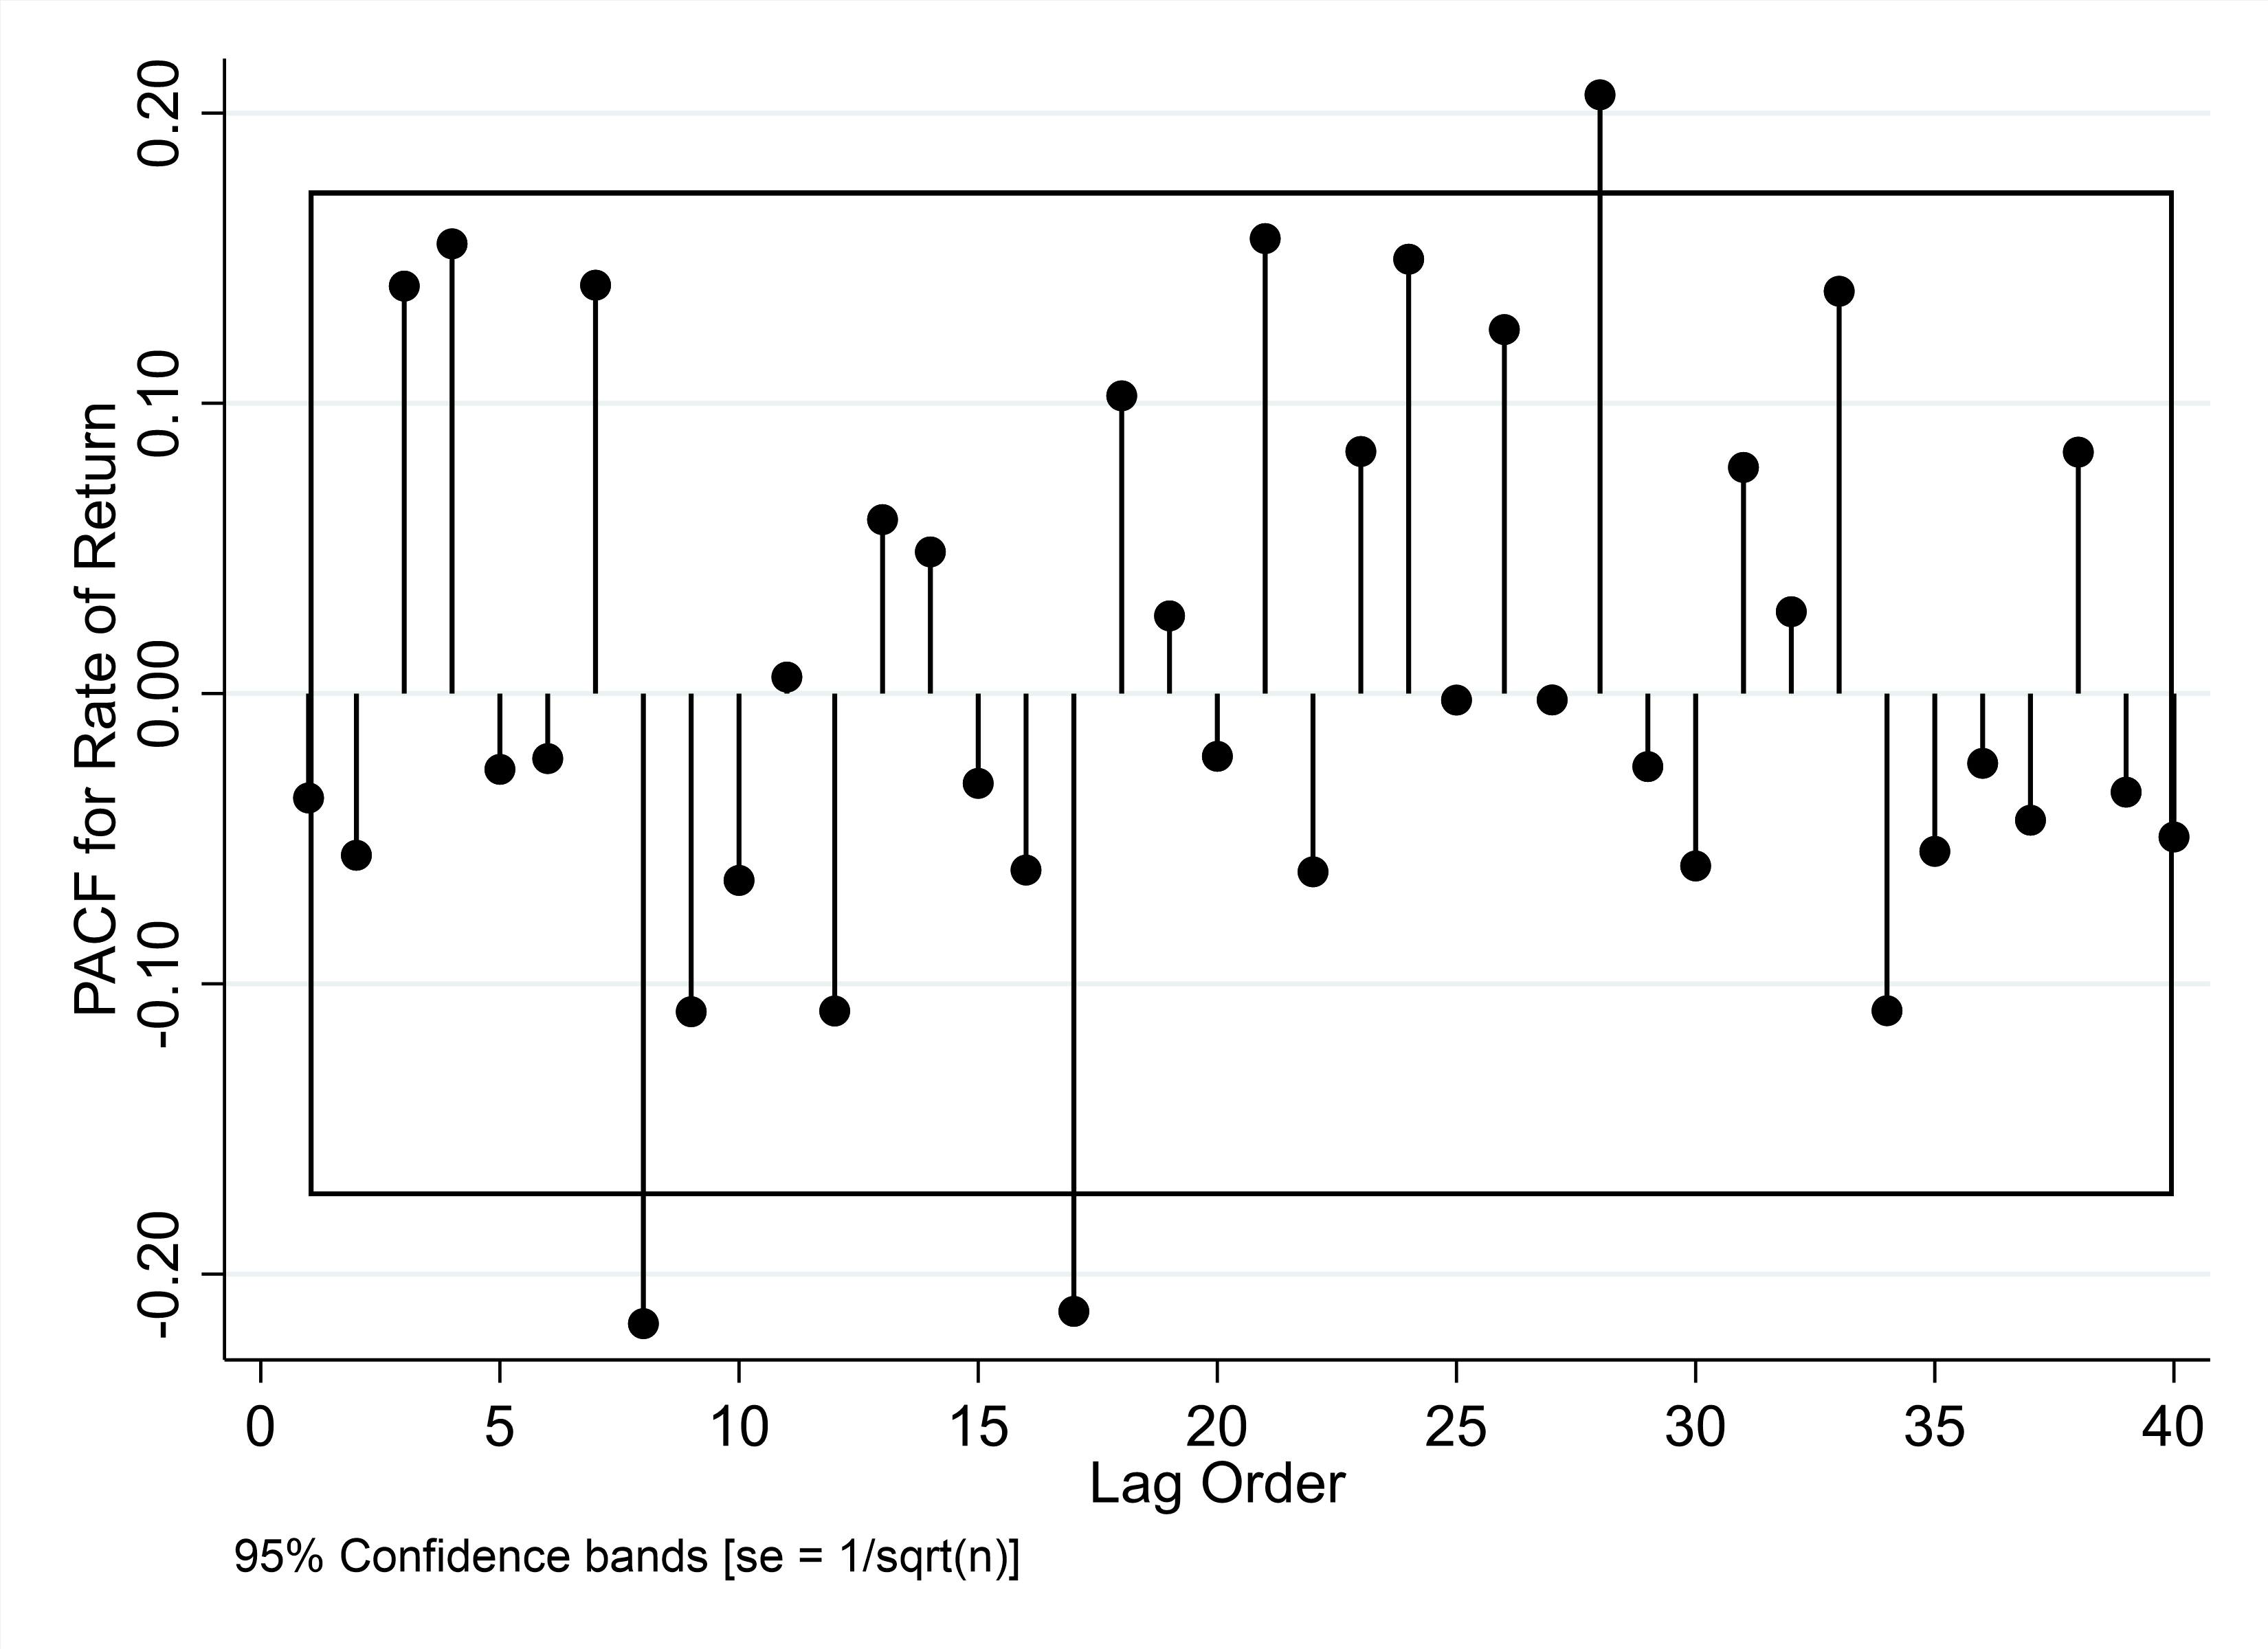
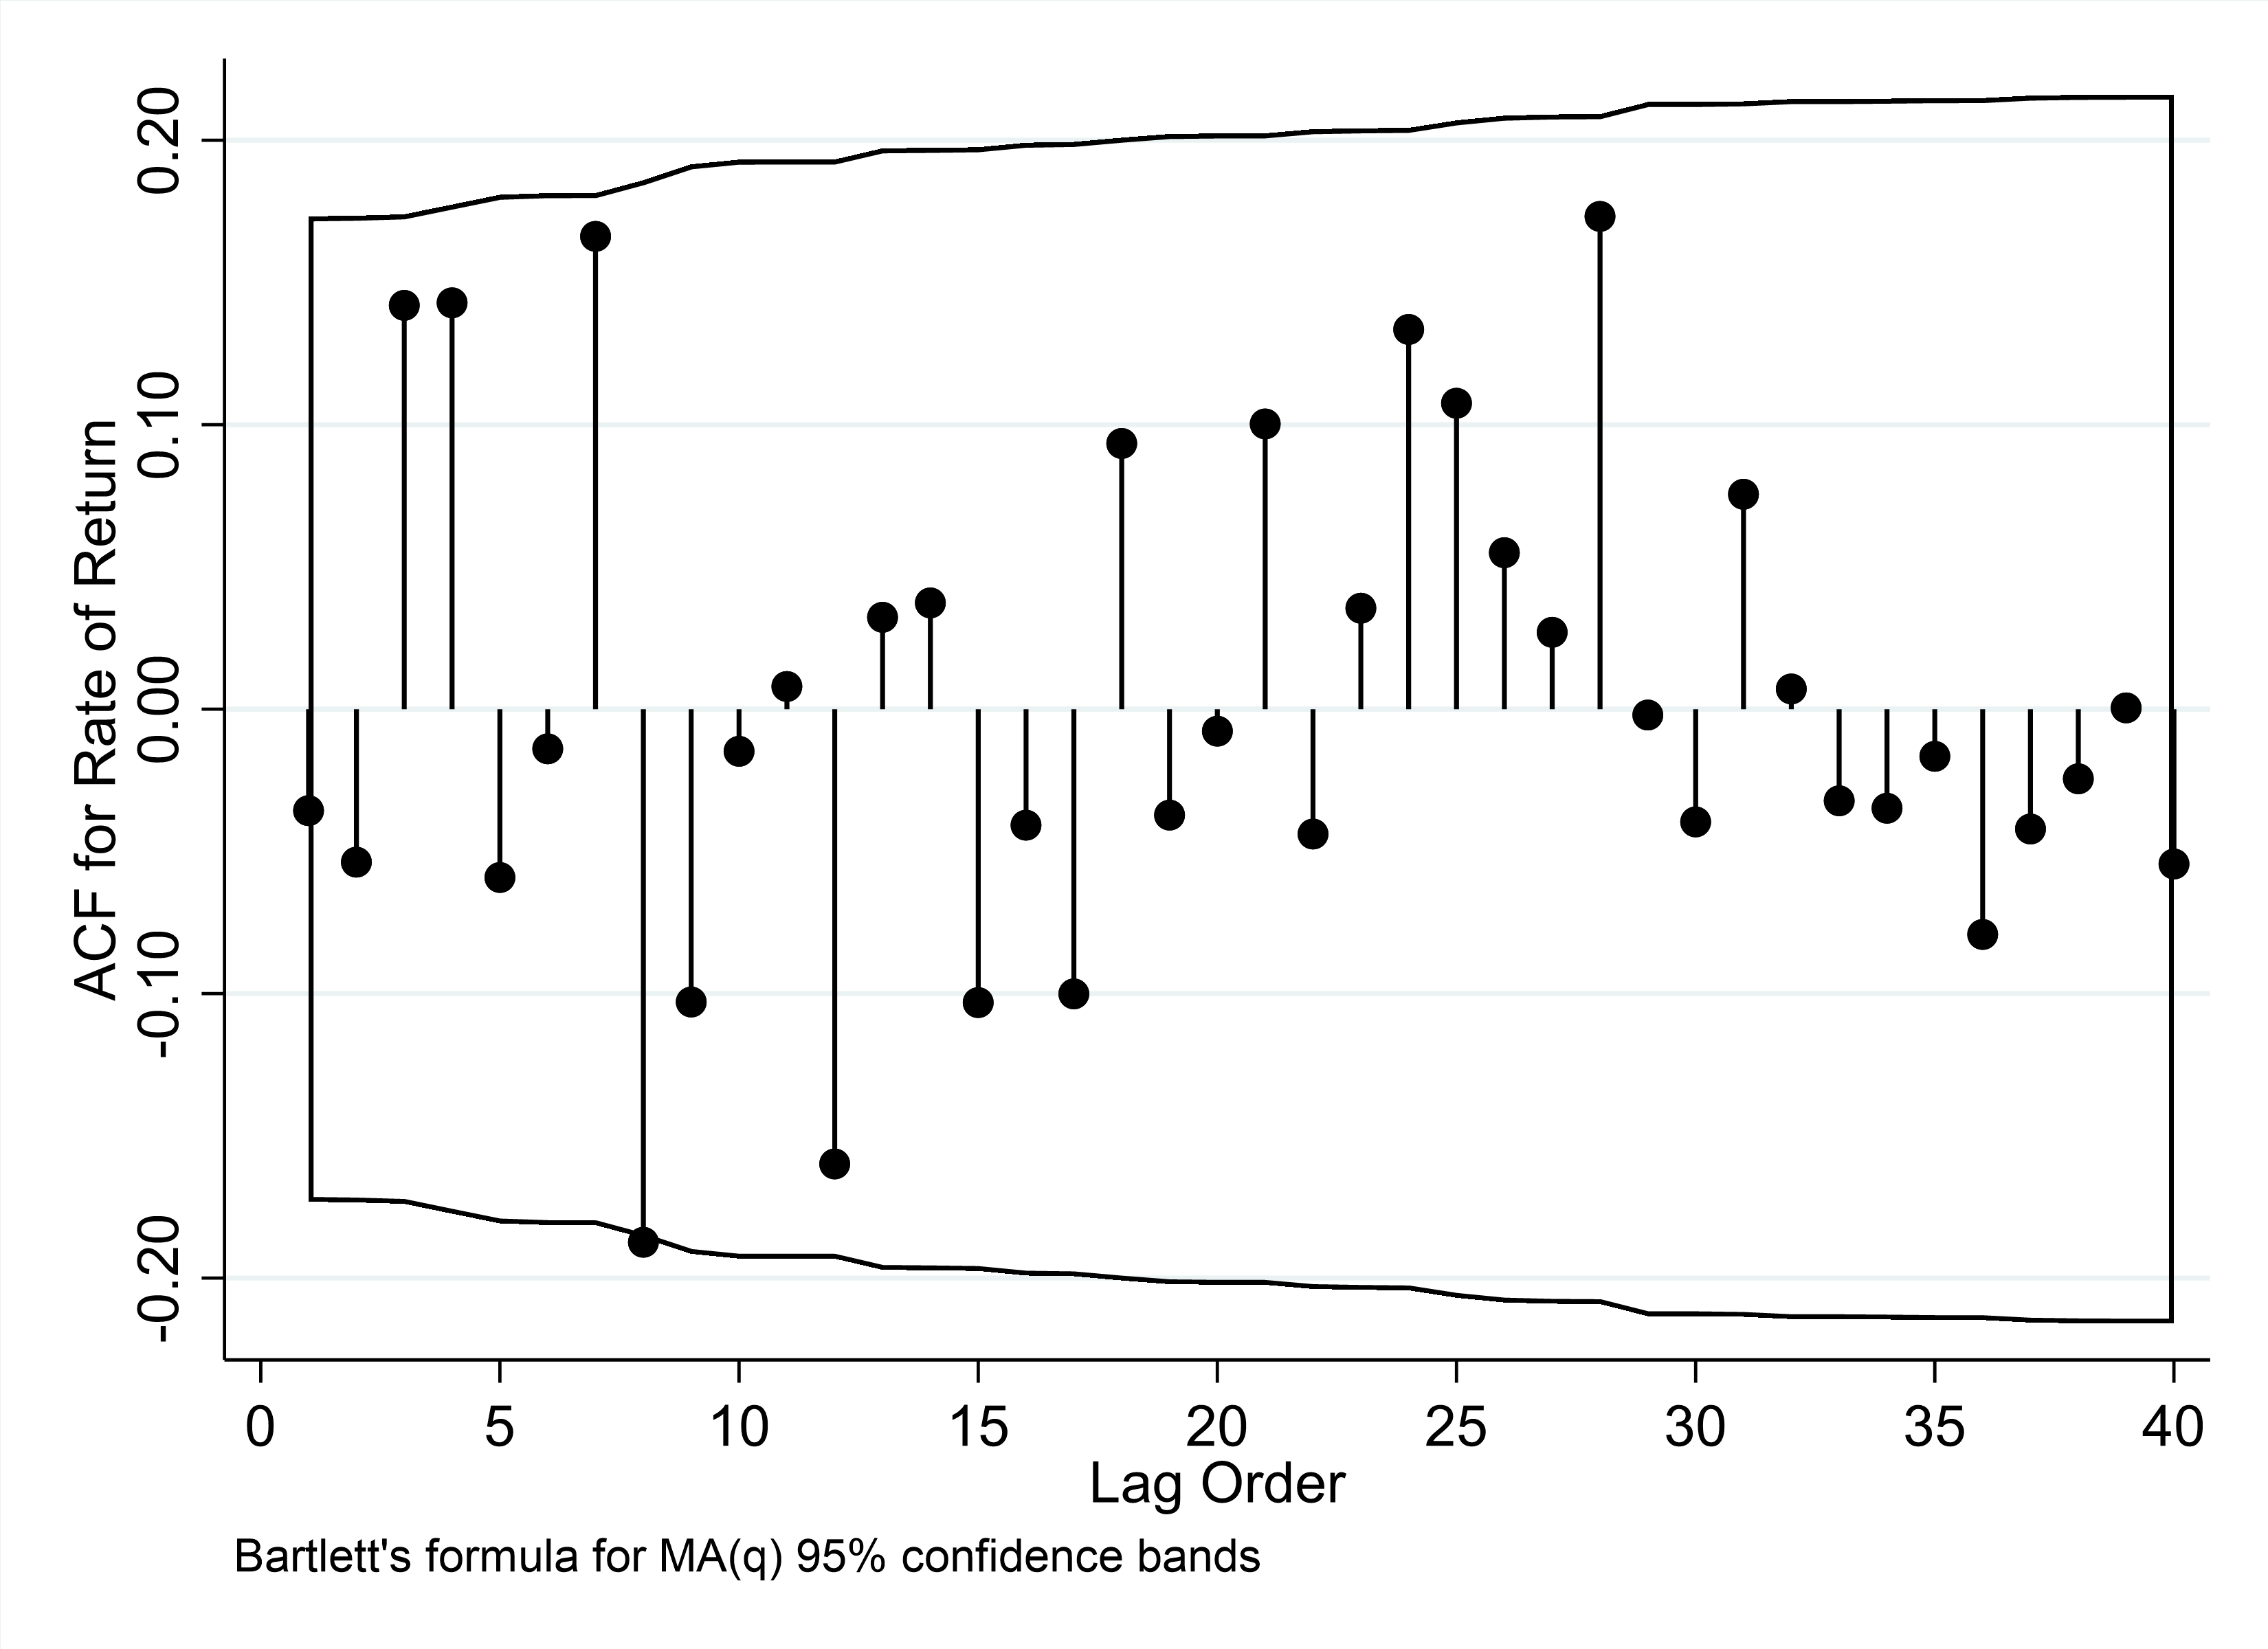
According to figure1, it can be found that q of SSEC can be set to 7 or 8, p of SSEC can be set to 8, q of SZSE can be set to 8 or 17, and p of SZSE can be set to 8. At last, ARIMA (8,1,8) is built based on SSEC logarithmic price and ARIMA (8,1,8) is built based on the SZSE logarithmic price.
3.2. Forecast Results Evaluation
After the residual test, both SSEC and SZSE's models’ residuals turn out to be white noise, demonstrating the built models are reasonable.
Table 2: Residual test.
Model | Portmanteau (Q) statistic | Prob > chi2 |
SSEC | 18.2325 | 0.9988 |
SZSE | 30.2094 | 0.8693 |
3.3. Comparison and Analysis
It could be found that in figure 2 the actual value of SSEC was higher than the predicted value about one week after the policy release, December 8, 2022-December 15, 2022, indicating that the policy boosted the stock market, but then there was an opposite situation for the next 20 days, where it’s believed there was an overreaction, and then the actual value remains higher than the predicted value till now, indicating that the stock market did achieve some degree of growth after the deregulation.
Figure 2: SSEC.
Photo credit: Original.
Figure 3: SZSE.
Photo credit: Original.
It could be found that in figure 3 SZSE almost shared the same trend as SSEC.
The first stage (December 8, 2022-December 15, 2022):
After the pandemic, people could not wait to consume and enjoy other outdoor activities that quickly raised the economic index, so there was a clear positive trend in the stock market.
The second stage (December 16, 2022-December 28, 2022):
One explanation is that people were infected with the coronavirus due to the immediate release of the policy, so consumption and production stopped for a period of time, but just a while for people to recover from the virus, probably about 10 days.
Another explanation is there was an overreaction, a small pullback in economic trends after a large adjustment due to a specific event [23]. Overreaction theory describes the phenomenon that markets can overreact. People can show enhanced investment desire in the investment process due to a range of emotional and cognitive factors, which can lead to excessive market response—overreaction [24].
The third stage (December 28, 2022 later):
China is back to the pre-pandemic era and economic indexes are no longer affected by the pandemic. Trade such as imports and exports are back to normal, and companies' business management is no longer restricted, so the actual values of SSEC and SSZE economic indices are significantly higher by several units compared to the predicted values.
4. Conclusion
In contrast to other studies, this paper focuses on analyzing possible factors affecting actual price fluctuations by comparing expected SSEC and SZSE prices based on the original economic situation with actual SSEC and SZSE prices for a period of time after the Chinese deregulation policy, while existing articles focused on current market trends and discussed the external influence of the pandemic in terms of commodities and people's lives. Although some articles have investigated stock market performance during the pandemic, they concentrated on more specific sectors such as communication services, technology, healthcare, energy, etc. However, this paper focuses more on the ARIMA model to specifically explore the prices of the corresponding index changes in order to achieve an accurate comparative assessment.
Through this article, investors can analyze the economic situation before and after the pandemic to have a better understanding of the future economic situation, and they will pay more attention to the potential amount of black swan events and prepare emergency strategies for similar situations to avoid major losses. At the same time, policy makers can analyze the changes in the economy before and after the deregulation policy and make rational use of monetary and fiscal policies to better achieve economic security especially in case of emergencies.
This paper is to review and analyze the implication on SSEC and SZSE indexes after the Chinese government announced the deregulation policy and explore why the corresponding impact occurred, using ARIMA model with the data during the pandemic as the training set and the values for two months after the focused event as the test set, and finally draw some conclusion.
Finally, this paper demonstrates that after the Chinese government announced the regulation policy, there was a clear upward trend in stock prices. Although there was a period of overreaction after a period, this policy clearly improved the performance of the stock market overall.
References
[1]. H Ding, C Fan, L Qiang (2014). Research of the construction of generalized price index and its implication for monetary policy in China. China Economic Issues:88-98.
[2]. Y Zhou (2014). Research of the construction of generalized price index and its implication for monetary policy in China. China Economic Issues:88-98.
[3]. Z Xu, W Jiang, S Yang (2015). The impact of interest rates on China's stock market--an empirical study based on the SSEC and SZSE. Credit, 33(02):79-83.
[4]. Y Liu, Y Song (2012). Research on the impact of financial crisis on stock market predictability--analysis of Shenzhen Cheng Index and Dow Jones Index as an example. China Securities and Futures (04):63-64.
[5]. S Zhu (2009). Predictability analysis of SSEC and SZSE. Mathematical Theory and Applications, 29(02):124-128.
[6]. Y Feng, D Wang (2021). The impact of the COVID-19 pandemic on the global economy and China's response. Low Carbon World,11(09):255-256.
[7]. J Sun, H Li, J Yang (2022). The impact of the COVID-19 pandemic on global macroeconomics and value chain structure. Research on Finance and Economics (01):52-62.
[8]. Z Xia (2022). Research on the impact of the COVID-19 pandemic on the inter-market spillover effect of the stock market. Yunnan Normal University.
[9]. L Wu, Z Jiang, F Wang (2022). An empirical study on the volatility trend of US and Chinese stock markets under the new "black swan"-based GARCH model. Journal of Hubei University of Economics (Humanities and Social Sciences Edition), 19(02):51-55.
[10]. J Chen, Y Chen (2022). China can prepare to end its zero-COVID policy. Nature Medicine, 28(6): 1104-1105.
[11]. Q Wang, L Liu (2022). Pandemic or panic? A firm-level study on the psychological and industrial impacts of COVID-19 on the Chinese stock market. Financial Innovation, 8(1): 36.
[12]. Burki T (2022). Dynamic zero COVID policy in the fight against COVID. The Lancet Respiratory Medicine, 10(6): e58-e59.
[13]. Dorlach T (2023). Social policy responses to Covid-19 in the global south: Evidence from 36 countries. Social Policy and Society, 22(1): 94-105.
[14]. Mistur E M, Givens J W, Matisoff D C (2023). Contagious COVID‐19 policies: Policy diffusion during times of crisis. Review of Policy Research, 40(1): 36-62.
[15]. Y Du (2018). Application and analysis of forecasting stock price index based on combination of ARIMA model and BP neural network[C]//2018 Chinese control and decision conference (CCDC). IEEE: 2854-2857.
[16]. Fortune Times (2023). The road to economic recovery after the pandemic (01):17.
[17]. Christopher Pissarides (2023). Analysis of the world and China in the post-pandemic era from a labor market perspective. International Finance:6-8.
[18]. H Cui, M Li, J Chu (2023). An asymmetric study of herding effect in Chinese stock market. Journal of Reading River,15(02):123-134+174.
[19]. Phillips P C B, Perron P (1998). Testing for a unit root in time series regression. Biometrika, 75(2): 335-346.
[20]. Mushtaq R (2011). Augmented dickey fuller test.
[21]. S Ho, M Xie (1998). The use of ARIMA models for reliability forecasting and analysis. Computers & industrial engineering, 35(1-2): 213-216.
[22]. Mondal P, Shit L, Goswami S (2014). Study of effectiveness of time series modeling (ARIMA) in forecasting stock prices. International Journal of Computer Science, Engineering and Applications, 4(2): 13.
[23]. Newbold P (1983). ARIMA model building and the time series analysis approach to forecasting. Journal of forecasting, 2(1): 23-35.
[24]. Hong H, Stein J C (1999). A unified theory of underreaction, momentum trading, and overreaction in asset markets. The Journal of finance, 54(6): 2143-2184.
Cite this article
Chen,H. (2023). The Impact of China's Pandemic Deregulation Policy on SSEC and SZSE Indexes. Advances in Economics, Management and Political Sciences,45,18-25.
Data availability
The datasets used and/or analyzed during the current study will be available from the authors upon reasonable request.
Disclaimer/Publisher's Note
The statements, opinions and data contained in all publications are solely those of the individual author(s) and contributor(s) and not of EWA Publishing and/or the editor(s). EWA Publishing and/or the editor(s) disclaim responsibility for any injury to people or property resulting from any ideas, methods, instructions or products referred to in the content.
About volume
Volume title: Proceedings of the 2nd International Conference on Financial Technology and Business Analysis
© 2024 by the author(s). Licensee EWA Publishing, Oxford, UK. This article is an open access article distributed under the terms and
conditions of the Creative Commons Attribution (CC BY) license. Authors who
publish this series agree to the following terms:
1. Authors retain copyright and grant the series right of first publication with the work simultaneously licensed under a Creative Commons
Attribution License that allows others to share the work with an acknowledgment of the work's authorship and initial publication in this
series.
2. Authors are able to enter into separate, additional contractual arrangements for the non-exclusive distribution of the series's published
version of the work (e.g., post it to an institutional repository or publish it in a book), with an acknowledgment of its initial
publication in this series.
3. Authors are permitted and encouraged to post their work online (e.g., in institutional repositories or on their website) prior to and
during the submission process, as it can lead to productive exchanges, as well as earlier and greater citation of published work (See
Open access policy for details).
References
[1]. H Ding, C Fan, L Qiang (2014). Research of the construction of generalized price index and its implication for monetary policy in China. China Economic Issues:88-98.
[2]. Y Zhou (2014). Research of the construction of generalized price index and its implication for monetary policy in China. China Economic Issues:88-98.
[3]. Z Xu, W Jiang, S Yang (2015). The impact of interest rates on China's stock market--an empirical study based on the SSEC and SZSE. Credit, 33(02):79-83.
[4]. Y Liu, Y Song (2012). Research on the impact of financial crisis on stock market predictability--analysis of Shenzhen Cheng Index and Dow Jones Index as an example. China Securities and Futures (04):63-64.
[5]. S Zhu (2009). Predictability analysis of SSEC and SZSE. Mathematical Theory and Applications, 29(02):124-128.
[6]. Y Feng, D Wang (2021). The impact of the COVID-19 pandemic on the global economy and China's response. Low Carbon World,11(09):255-256.
[7]. J Sun, H Li, J Yang (2022). The impact of the COVID-19 pandemic on global macroeconomics and value chain structure. Research on Finance and Economics (01):52-62.
[8]. Z Xia (2022). Research on the impact of the COVID-19 pandemic on the inter-market spillover effect of the stock market. Yunnan Normal University.
[9]. L Wu, Z Jiang, F Wang (2022). An empirical study on the volatility trend of US and Chinese stock markets under the new "black swan"-based GARCH model. Journal of Hubei University of Economics (Humanities and Social Sciences Edition), 19(02):51-55.
[10]. J Chen, Y Chen (2022). China can prepare to end its zero-COVID policy. Nature Medicine, 28(6): 1104-1105.
[11]. Q Wang, L Liu (2022). Pandemic or panic? A firm-level study on the psychological and industrial impacts of COVID-19 on the Chinese stock market. Financial Innovation, 8(1): 36.
[12]. Burki T (2022). Dynamic zero COVID policy in the fight against COVID. The Lancet Respiratory Medicine, 10(6): e58-e59.
[13]. Dorlach T (2023). Social policy responses to Covid-19 in the global south: Evidence from 36 countries. Social Policy and Society, 22(1): 94-105.
[14]. Mistur E M, Givens J W, Matisoff D C (2023). Contagious COVID‐19 policies: Policy diffusion during times of crisis. Review of Policy Research, 40(1): 36-62.
[15]. Y Du (2018). Application and analysis of forecasting stock price index based on combination of ARIMA model and BP neural network[C]//2018 Chinese control and decision conference (CCDC). IEEE: 2854-2857.
[16]. Fortune Times (2023). The road to economic recovery after the pandemic (01):17.
[17]. Christopher Pissarides (2023). Analysis of the world and China in the post-pandemic era from a labor market perspective. International Finance:6-8.
[18]. H Cui, M Li, J Chu (2023). An asymmetric study of herding effect in Chinese stock market. Journal of Reading River,15(02):123-134+174.
[19]. Phillips P C B, Perron P (1998). Testing for a unit root in time series regression. Biometrika, 75(2): 335-346.
[20]. Mushtaq R (2011). Augmented dickey fuller test.
[21]. S Ho, M Xie (1998). The use of ARIMA models for reliability forecasting and analysis. Computers & industrial engineering, 35(1-2): 213-216.
[22]. Mondal P, Shit L, Goswami S (2014). Study of effectiveness of time series modeling (ARIMA) in forecasting stock prices. International Journal of Computer Science, Engineering and Applications, 4(2): 13.
[23]. Newbold P (1983). ARIMA model building and the time series analysis approach to forecasting. Journal of forecasting, 2(1): 23-35.
[24]. Hong H, Stein J C (1999). A unified theory of underreaction, momentum trading, and overreaction in asset markets. The Journal of finance, 54(6): 2143-2184.