


1. Introduction
In recent years, more and more people are speculating in stocks and the stock market is getting hotter and hotter. It is the expectation of many people to make money from stock speculation. However, the movement of stock prices is full of complexity and uncertainty, and the accuracy of stock price prediction greatly determines whether one can make a profit in the stock market. Among the many methods of stock price prediction, machine learning has achieved excellent results in stock price prediction. The question of which model of machine learning to use for stock price prediction and which model is better at predicting stock prices is currently being widely explored [1]. From the current research, most of the stock prices are predicted by using combinatorial models, such as the XGB-LSTM combinatorial model for stock prices [2]. However, there has been less exploration of basic models for stock price forecasting, and combinatorial models have been combined from basic models, with decision tree regression models and linear regression models both play an important role in stock price prediction. The paper will explore the superiority of the above two models based on the prediction of Apple's stock price.
The data sample of this paper is selected from the S&P 500 stock data, from which Apple stock price data is extracted as the experimental investigation sample, and the opening price, closing price, high price, low price are extracted as the features. The paper use a decision tree regression model and a linear regression model to predict the stock price trend of the above features, evaluating the prediction effect of the two models in terms of model fit, mean square error (MSE), root mean square error (RMSE) and mean absolute error (MAE). Finally, it was concluded that the decision tree regression model was a better predictor than the linear regression model. This paper provides a useful reference for future use of machine learning in predicting stock prices when choosing a simple model or a combination of models to do so.
The following arrangement of this article: Section 2 explains our Methodology of this research. Section 3 describes our data. Section 4 presents the visualisation results, an evaluation of the model, and an analysis of the results. Section 5 drawing the final conclusions of the study.
2. Methodology
2.1. Linear Regression
Regression is an important algorithm that originates from statistical analysis and combines machine learning and statistics. Regression is a widely used predictive modelling technique that is centred on predicting outcomes as continuous variables. When the value of the input variable changes, so does the value of the output variable, and the regression model represents the functional relationship that maps from the input variable to the output variable. Linear regression uses a least square function to model the relationship between the independent and dependent variables. The linear regression model used in this paper is based on the least squares method of fitting data to find the pattern between data and data to obtain a mathematical expression that matches the basic pattern within the predicted thing, which is a basic algorithm in machine learning and is widely used in stock price prediction [3].
Basic principles of linear regression:
For the case of only one variable, a linear regression can be written with the equation(1):
\( y=ax+b \) (1)
And for a sample i with n characteristics, the regression results can be written uniformly in the equation(2):
\( {y_{i}}={w_{0}}+{w_{1}}{x_{i1}}+{w_{2}}{x_{i2}}+…+{w_{n}}{x_{in}} \) (2)
\( w \) is referred to as a parameter of the model,while \( {w_{0}} \) is the intercept, \( {w_{1}}~{w_{n}} \) are called regression coefficients,(2) expressions with the same properties as expression (1),where \( {x_{i1}}~{x_{in}} \) in are the different features on sample \( i \) ,The linear regression model adjusts the residuals and slope of the regression line by constantly,which is the expression (3):
\( RSS=\sum _{i=1}^{n}{({y_{i}}-y_{i}^{\text{^}})^{2}} \) (3)
The sum of squared residuals is the square of the y-axis value at the actual point location minus the y-axis value on the fitted line at the same coordinate x. The sum of squared residuals for all points is added to give the sum of squared residuals (RSS). The mean squared error (MSE) can be derived from the data relating to the sum of squared residuals. The MSE is an important parameter in the evaluation of linear regression models and is described in more detail below in the context of model evaluation, where the goal of model fitting is to minimise the MSE [4].
2.2. Decision Tree Regression
Decision tree regression is a basic regression algorithm with a binary tree data structure, where the internal nodes all take on a yes or no feature value. The main component of the decision tree algorithm structure is the nodes, the first node is the parent node, after which each node is split according to the corresponding characteristics, and after the splitting process, new left and right nodes are created. At the end of this recursive process, the decision tree is constructed. Decision tree regression makes certain divisions of the data, and each division is for a predicted value. As each node is passed, a yes or no judgement is made and this is the decision making process.Each time a division is made, the output corresponding to the division unit is determined and an additional corresponding node is created. The final output of each cell is determined when the division is judged to be terminated according to the cut-off condition, which also determines the leaf node [5].
A decision tree starts its decision process at the root node and for each node, based on its features, determines how to perform a decision decomposition, taking new information at each decision until no further decisions are needed. Information gain is an important method of decision tree feature selection. The information gain of a particular feature is a measure of the degree of change in information entropy; the higher the information entropy, the more information there is, and the lower the information entropy, the less information there is [6]. The mathematical expression for information entropy is (4).
\( \sum _{i=1}^{n}-pi{log_{2}}{pi} \) (4)
2.3. Prediction Accuracy
In order to finally and accurately assess the effectiveness of comparing decision tree regression and linear regression models on stock prices, this paper adopts three criteria for prediction accuracy, mean squared error (MSE), root mean squared error (RMSE), and mean absolute error (MAE).
Mean squared error (MSE): the expression for the mean squared error is (5) :
\( \frac{1}{m}\sum _{i=1}^{m}{({y_{i}}-y_{i}^{\text{^}})^{2}} \) (5)
In expression (5), \( {y_{i}}-y_{i}^{\text{^}} \) is the true value on the test set minus the predicted value. The MSE is a measure of the difference between the estimated and estimated quantities, and is the squared expectation of the difference between the estimated and true values of a parameter. The MSE can be used to determine whether a set of findings is sufficiently accurate, and when the MSE is small, the results are usually of good accuracy [7].
Root Mean Square Error (RMSE): The expression for the root mean square error is (6).
\( \sqrt[]{\frac{\sum _{i=1}^{m}{({y_{i}}-y_{i}^{\text{^}})^{2}}}{m}} \) (6)
The RMSE is the arithmetic square root of the mean square error. RMSE can also be described as the square root of the ratio of the square of the observed value to the true value to the number of observations. As the RMSE is an obvious response to a very large or very small error in a set of measurements in the data, the RMSE can be a good indicator of the precision of the measurement data. This is the reason why the RMSE is widely used in data prediction and can therefore be used to measure the deviation between the observed and true values. The smaller the value of the RMSE, the better the accuracy of the model's description of the experimental data [8].
Mean Absolute Error (MAE): The expression for Mean Absolute Error is (7).
\( \frac{1}{m}\sum _{i=1}^{m}|({y_{i}}-y_{i}^{\text{^}})| \) (7)
The MAE is the average of the absolute values of the errors of the observations and is used to measure the error between the predicted value and the true value; a smaller MAE means a better model, and a smaller MAE means that the experimental model has better accuracy in describing the experimental data [9].
3. Data
3.1. Time and Source of Data Sample
The data sample for this article is selected from the S&P 500 stock data, which includes stock data for multiple companies over a five-year period from February 8, 2013 to February 7, 2018, where the data information includes date, opening price, closing price, high price, low price, trading volume, and company name. As the sample size contained in the S&P 500 stock data is too large, with a total of 619040 data, the pattern derived from the experiment is not obvious, so this paper extracts the stock-related data of Apple from the S&P 500 stock data as an experimental research object, which has a total of 1259 data (1259-2517).
3.2. Data Pre-Processing and Feature Engineering
Firstly, the data was pre-processed, and a search function was used to find missing values in the opening, high and low price columns of the S&P 500 stock data, and then the missing values were processed. Firstly, the data was pre-processed, and a search function was used to find missing values in the opening, high and low price columns of the S&P 500 stock data, and then the missing values were processed. The next step of the feature engineering is to extract the Apple stock data from the S&P 500 stock data, and then extract the opening price, closing price, high price, low price of the Apple stock data as the four features of the research object, and then use the decision tree regression model and linear regression model to predict the above four features respectively, and through the evaluation of the prediction results, the study will conclude which model has better prediction effect.
3.3. Division and Construction of Training and Test Sets
Apple's stock price data has a total of 1259 days of data, noted by its position in the S&P 500 data set from 1259-2517. In this paper, the first 1159 days of data were extracted to construct dataset X, and the second 1159 days of data were selected to construct dataset Y. Subsequently, the training set and test set were divided and constructed in the ratio of eight to two. The first 927 days of dataset X were used to obtain x_train and the last 232 days to obtain x_test, and the same for dataset Y to obtain y_train and y_test.
3.4. Prediction of the Training of the Model
First, the research constructs a decision tree regression model and a linear regression model, and train the two models using the training set the experiment have just divided. After that, the study extracts the stock price data for the 100 days from 2318-2417 as the forecast sample and the data for the last 100 days from 2418-2517 as the forecast object, and use the decision tree regression and linear regression models to forecast respectively, fit the forecast curves and compare them with the real situation. The results will then be visualised and evaluated for both models.
4. Results
4.1. Visualisation of Results
The following visualization of the results of the model predictions is carried out. As the prediction process of the five features, the results are presented in a similar form, only the visualization of the opening price prediction of Apple's stock by two models is shown here. The accuracy of the prediction results for each of the four features will be evaluated in further model evaluations in this paper. The following visualisations of the opening price predictions from the two models are presented.
The Figure 1 below shows the prediction results of the decision tree regression model. The blue curve is the stock price trend for the first 1159 days, the orange curve is the real stock price trend for the next 100 days, and the green curve is the predicted stock price trend for the next 100 days obtained from the data predicted by the decision tree regression model and then curve-fitted. As can be seen from the graph, the green forecast curve almost overlaps with the orange true curve in the comparison of the predicted stock price trend and the true trend in the latter 100 days, and it can be initially judged that the decision tree model predicts good results.
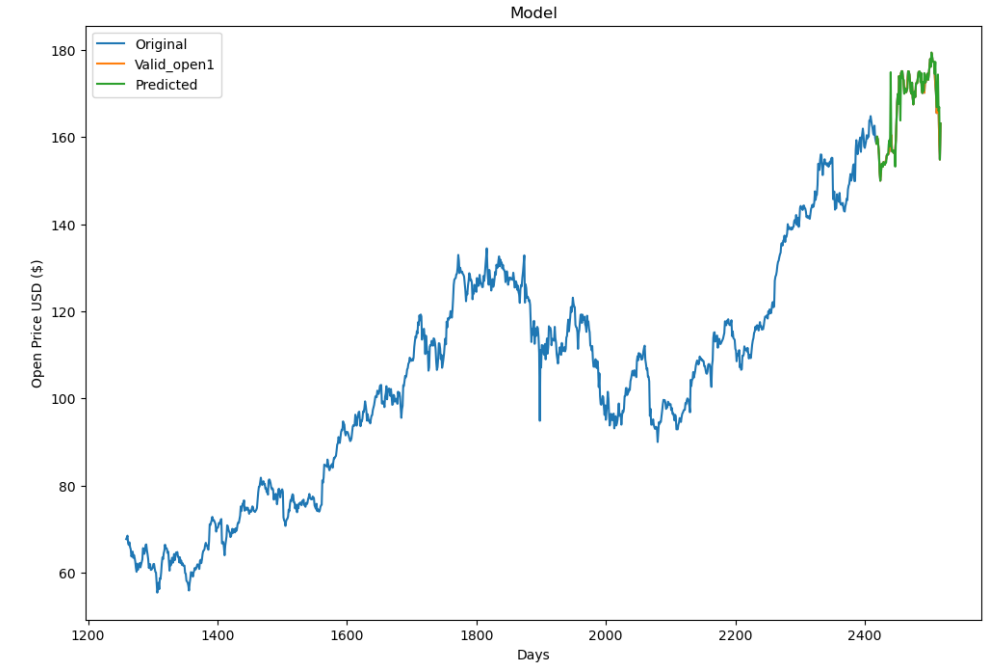
Figure 1: Prediction images for decision tree regression models.
The Figure 2 below presents the forecast curve derived from linear regression, and the real share price movement, the covariates are consistent with the graph above. In the comparison between the predicted stock price trend and the real trend in the latter 100 days, the green prediction curve differs significantly from the orange real curve trend, with a large difference in the peak position, relative to the prediction results of the decision tree regression model, the prediction results of the decision tree regression model are far better than the prediction results of the linear regression.
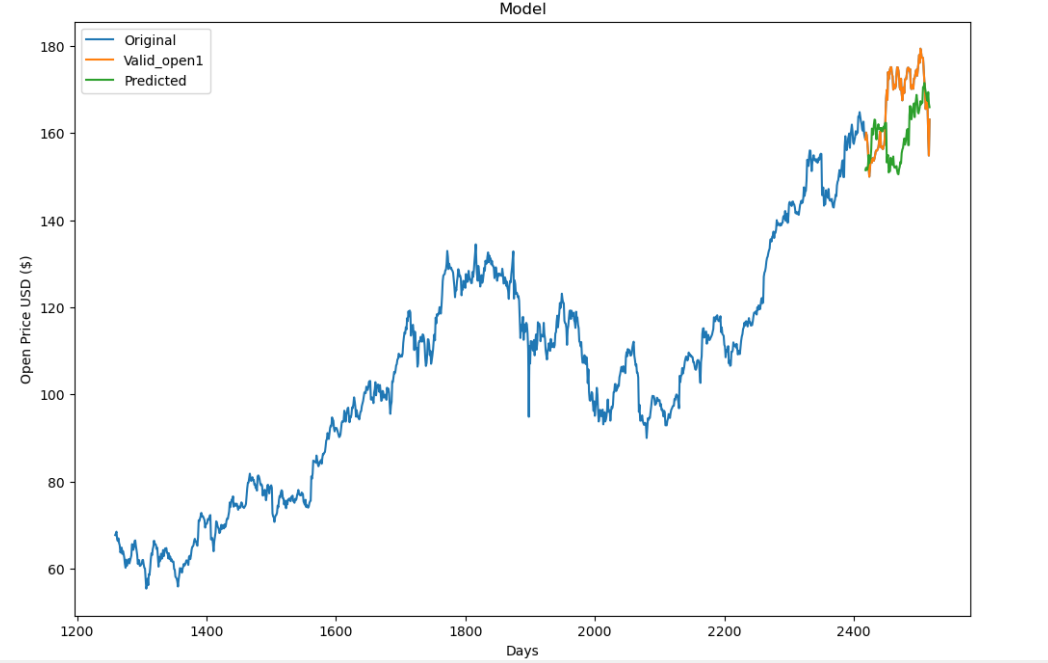
Figure 2: Prediction images for linear regression models.
From the above two figures this paper has come to the preliminary conclusion that the decision tree model outperforms the linear regression model, but this is only a preliminary judgement based on the curve fitting effect, in order to further confirm the conclusion, this paper will carry out the next step of model evaluation.
4.2. Model Evaluation
In this paper, the three regression assessment indicators mentioned above are used to evaluate the results of the decision tree regression model and linear regression model, and the following tables are obtained.
Table 1: Evaluation indicators.
MSE | Decision tree | Linear |
open | 5.33 | 144.5 |
close | 13.4 | 152.6 |
high | 86.3 | 148.1 |
low | 89.8 | 165.5 |
RMSE | Decision tree | Linear |
open | 2.31 | 12.0 |
close | 3.66 | 12.6 |
high | 9.29 | 12.2 |
low | 9.47 | 12.9 |
MAE | Decision tree | Linear |
open | 0.682 | 9.96 |
close | 1.29 | 10.1 |
high | 6.55 | 9.98 |
low | 6.69 | 10.4 |
The table above shows the predicted results from the four features of Apple's stock price,The MSE, RMSE and MAE of the decision tree regression model are all smaller than those of the linear regression model. As the smaller the MSE, RMSE and MAE are, the more accurate the model prediction results are. The evaluation of the model here further supports the preliminary conclusion from the curve fitting effect that the decision tree regression model outperforms the linear regression model.
4.3. Analysis of Results
From the above experimental process, it can be seen that the decision tree regression model has an advantage in prediction compared to linear regression. The decision tree regression model has prediction advantages over other models. The biggest advantage of the decision tree is that it can self-learn, which is closer to the human decision pattern, and this experiment has fewer variables and low complexity of the decision tree, which also reduces the difficulty of pruning the decision tree and makes the decision tree regression model have absolute advantages in this experiment [10].
5. Conclusion
This study was conducted by having two models, decision tree regression and linear regression, predict Apple's stock price separately and comparing the prediction results to conclude which model predicts better. The two models are used to predict four features of Apple's stock data, namely the opening price, closing price, high price, low price, and finally the prediction effectiveness of the two models is evaluated by the indicators of model fit, MSE, RMSE and MAE. The final conclusion is that the decision tree regression model is more advantageous in prediction compared to the linear regression model. Shortcomings of this study: Firstly, this study only used Apple's stock price as the experimental research object and the sample has limitations. Secondly, this study only selected the four basic features for prediction, while stock prices have more complex features, and these four features have some connection with each other, so feature engineering should be strengthened to extract more representative features for research, which can also better play the advantages of the model itself and make the research results more accurate. In addition, the lack of predictive accuracy of the base model compared to the complex model is a matter of the structure of the algorithm itself, so a more complex hybrid model should be introduced if more accurate results are desired.
References
[1]. Qian Q, Zhang D, Wang Y, Liu R, Cai F.: Application of Machine Learning to Stock Price Prediction. China Market 21(7),7-10(2022).
[2]. Xu Y, Lu W.: A Study of Liquor Stock Price Forecasting Based on XGB-LSTM Combination Model. Electronic Components and Information Technology 6(6),64-68(2022).
[3]. Tang Y, Zhou B, Xie W.: Equivalence Analysis of Three Significant Tests of Univariate Linear Regression Equation. Studies in College Mathematics 25(6),76-78(2022).
[4]. Yang G.: A Comparative Analysis of Five Linear Regression Methods for Stock Forecasting Based on Stock Correlation. Modern Business 29(29),42-45(2022).
[5]. Yang Y, Bao C, Ding Y, Li S.: Distribution of Gentian Macrophylla Based on Regression Algorithm and Decision Tree. Asia-Pacific Traditional Medicine 19(2),41-45(2023).
[6]. Wang J.: A Study of the Principles and Practical Applications of Decision Tree Algorithms. Computer Programming Skills & Maintenance 8(8),54-56+72(2022).
[7]. Cai Ch, Pan Zh, Cai X, Zhang X, Zhang D.: Research on a Linear Regression-based Coke Quality Prediction Model. Modern Chemical Research 1(1),1-4(2023).
[8]. Wang Zh, He L, Ding G.: Shortterm Power Generation Combination Prediction Based on EMD⁃LSTM⁃ARMA Model. Modern Electronics Technique 46 (3),151-155(2023).
[9]. Chen L, Zhang H, Wang B, Wen B, Qiu L, Duan Q.: Design of Temperature Prediction Based on XGBoost and Improved LSTNet. Radio Engineering 53(3),591-600(2023).
[10]. Guo T, Liu W.:Analysis of Hospitalization Costs and Case Mix in Patients with Acute Pancreatitis Based on Decision Tree Model. Chinese Medical Record 23(11),37-41(2022).
Cite this article
Li,Z. (2023). Comparison of Decision Tree Regression with Linear Regression Based on Prediction of Apple Stock Price. Advances in Economics, Management and Political Sciences,45,62-69.
Data availability
The datasets used and/or analyzed during the current study will be available from the authors upon reasonable request.
Disclaimer/Publisher's Note
The statements, opinions and data contained in all publications are solely those of the individual author(s) and contributor(s) and not of EWA Publishing and/or the editor(s). EWA Publishing and/or the editor(s) disclaim responsibility for any injury to people or property resulting from any ideas, methods, instructions or products referred to in the content.
About volume
Volume title: Proceedings of the 2nd International Conference on Financial Technology and Business Analysis
© 2024 by the author(s). Licensee EWA Publishing, Oxford, UK. This article is an open access article distributed under the terms and
conditions of the Creative Commons Attribution (CC BY) license. Authors who
publish this series agree to the following terms:
1. Authors retain copyright and grant the series right of first publication with the work simultaneously licensed under a Creative Commons
Attribution License that allows others to share the work with an acknowledgment of the work's authorship and initial publication in this
series.
2. Authors are able to enter into separate, additional contractual arrangements for the non-exclusive distribution of the series's published
version of the work (e.g., post it to an institutional repository or publish it in a book), with an acknowledgment of its initial
publication in this series.
3. Authors are permitted and encouraged to post their work online (e.g., in institutional repositories or on their website) prior to and
during the submission process, as it can lead to productive exchanges, as well as earlier and greater citation of published work (See
Open access policy for details).
References
[1]. Qian Q, Zhang D, Wang Y, Liu R, Cai F.: Application of Machine Learning to Stock Price Prediction. China Market 21(7),7-10(2022).
[2]. Xu Y, Lu W.: A Study of Liquor Stock Price Forecasting Based on XGB-LSTM Combination Model. Electronic Components and Information Technology 6(6),64-68(2022).
[3]. Tang Y, Zhou B, Xie W.: Equivalence Analysis of Three Significant Tests of Univariate Linear Regression Equation. Studies in College Mathematics 25(6),76-78(2022).
[4]. Yang G.: A Comparative Analysis of Five Linear Regression Methods for Stock Forecasting Based on Stock Correlation. Modern Business 29(29),42-45(2022).
[5]. Yang Y, Bao C, Ding Y, Li S.: Distribution of Gentian Macrophylla Based on Regression Algorithm and Decision Tree. Asia-Pacific Traditional Medicine 19(2),41-45(2023).
[6]. Wang J.: A Study of the Principles and Practical Applications of Decision Tree Algorithms. Computer Programming Skills & Maintenance 8(8),54-56+72(2022).
[7]. Cai Ch, Pan Zh, Cai X, Zhang X, Zhang D.: Research on a Linear Regression-based Coke Quality Prediction Model. Modern Chemical Research 1(1),1-4(2023).
[8]. Wang Zh, He L, Ding G.: Shortterm Power Generation Combination Prediction Based on EMD⁃LSTM⁃ARMA Model. Modern Electronics Technique 46 (3),151-155(2023).
[9]. Chen L, Zhang H, Wang B, Wen B, Qiu L, Duan Q.: Design of Temperature Prediction Based on XGBoost and Improved LSTNet. Radio Engineering 53(3),591-600(2023).
[10]. Guo T, Liu W.:Analysis of Hospitalization Costs and Case Mix in Patients with Acute Pancreatitis Based on Decision Tree Model. Chinese Medical Record 23(11),37-41(2022).