


1. Introduction
Tesla is an American business that primarily creates electric vehicles and solutions for, renewable energy. In 2003, the battery, computer software, and patentable motor were among the foundational technologies used by it [1-2]. In an initial public offering, it did so for the first time by an American carmaker, and in 2010, it won multiple awards in the industry. In nine years, it had already achieved global expansion and opened Shanghai, China as the site of its first "Gigafactory" outside of the United States. The apparent worldwide move towards renewable energy is the reason why Tesla’s stock is parabolic [3–4]. So, it can be said that the electric vehicle manufacturer is in a position to experience tremendous expansion in the years to come [5]. Tesla is currently the most successful manufacturer of new energy vehicles. Elon Musk, the tesla company owner, has developed into a prosperous businessman who can guide Tesla toward a better future. Artificial intelligence, batteries, and alternative energy are some of their industries. The research demonstrates that these industries have a very positive tendency for the future [6]. Tesla’s profitability and share price have increased since going public, in part because of more advanced technology and business practices. The company has also attracted many investment institutions to purchase shares because electric vehicles are following the future development trend and its technology and patents are leading in the market. Its share price began at slightly more than $1 and reached a high of more than $400. Therefore, more and more experts have made predictions about Tesla's stock in light of the swift growth of its price across the entire financial market. Such fundamental analysis method: Use financial models and valuation models to forecast Tesla's future development trends and stock prices using the company's financial data, market conditions, industry development trends, and other factors. News analysis technique: Predict Tesla's future performance and stock price movements based on an analysis of news reports and market research studies on the company's rivals. But in terms of these two basic methods, the company cannot make an accurate prediction for the trend of tesla stock. While it exists some limits. The aim of the study utilizing machine learning techniques is to more precisely forecast the growth trend of Tesla stock to make some people get a return on investment.
So, this paper will primarily employ machine learning methods to forecast Tesla stock in the next 30 days. The principle of machine learning techniques is historical market data and corporate financial data, using machine learning algorithms and artificial intelligence technology to establish a forecasting model to predict Tesla's stock price. And linear regression algorithm and random forest algorithm will be mainly used in the research. The last five years' worth of data was chosen by the data provider, kaggle.com. The paper begins by scanning the data to see if any values are missing. The data set's 20% leftover data is used as a test set to verify the model, and then the paper randomly selects 80% of it to generate a training set. It takes careful computational planning to create predictions using previous data. Machine Learning can validate the accuracy of our predictions utilizing the training sample and test sample. And the paper’s primary attention is on the closing price. The closing price is employed as the research object in the machine learning method for prediction. The most appropriate parameters are chosen by performing 30 days spectrum analysis with the daily closing price as the reference volume. The purpose of the study using machine learning ways is to more precisely predict the growth trend of Tesla stock by comparing two models’ accuracy: linear regression and random forest. Using RAE, RMSE, MSER, and R2 indicators to judge which model is better. Based on the analysis and comparison of these two models, the study found that the linear regression model performs better in predicting the growth trend of Tesla stock. The results suggest that machine learning algorithms can effectively predict the stock market and provide valuable insights for investors.
The remainder of this essay is organized as follows. Section 2 of this article will display the data information, its sources, and how it was transformed into the measures used for analysis. Section 3 of the study presents and describes the findings, emphasizing their significance in the context of war and economic interdependence. Finally, the paper summarizes the research findings and contributions.
2. Data and Methodology
2.1. Dataset Collection and Processing
Data set collection and processing is a very basic module that manages the selection of appropriate datasets for the most part. The dataset that will be used to determine market expectations needs to be sorted in light of different factors. Information preprocessing, a component of information mining, is transforming unstructured data into something more intelligent. Preprocessing the data entails checking for missing characteristics, looking for all possible values, dividing the dataset into manageable portions, and testing the data in preparation for further processing. This project uses the Tesla dataset from Kaggle, which has 1258 instances and 7 characteristics. In the following Table 1 shows some details data.
Table 1: Seven characteristics.
Date | Open | High | Low | Close | Adj Close | Volume | |
1 | 2016/8/16 | 45.098 | 45.438 | 44.6819 | 44.722 | 44.722 | 11335500 |
2 | 2016/8/17 | 44.8660 | 44.966 | 44.5600 | 44.6479 | 44.6479 | 8935500 |
3 | 2016/8/18 | 44.764 | 45.132 | 44.458 | 44.702 | 44.702 | 8572500 |
4 | 2016/8/19 | 44.708 | 45.034 | 44.5060 | 45 | 45 | 8297500 |
5 | 2016/8/22 | 44.834 | 45.0219 | 44.5359 | 44.5859 | 44.5859 | 10327500 |
6 | 2016/8/23 | 44.8639 | 45.6980 | 44.5600 | 44.9679 | 44.9679 | 23922000 |
7 | 2016/8/24 | 45.41 | 45.43 | 44.444 | 44.5239 | 44.5239 | 12853500 |
The models are adjusted and fitted using the preparation sets. It is divided into an 80:20 ratio, with 80% going toward the preparation phase and the remaining 20% going toward the testing phase. Besides, this paper uses used statistical methods to describe the mean, variance, maximum, minimum, and median of the data set in Table 2.
Table 2: Descriptive statistical analysis.
Open | High | Low | Close | Adj Close | Volume | |
mean | 183.2740 | 187.2652 | 178.9412 | 183.3511 | 183.3511 | 4.441050e+07 |
min | 36.2200 | 36.9459 | 35.3979 | 35.7939 | 35.7939 | 8.297500e+06 |
50% | 66.6020 | 67.9500 | 65.4459 | 66.7560 | 66.7560 | 3.498150e+07 |
max | 891.3800 | 900.4000 | 871.5999 | 883.0900 | 883.0900 | 3.046940e+08 |
Then this paper respectively uses a linear regression model and random forest model to forecast the 30-day trend of tesla stock.
2.2. Linear Regression
The relationship between independent a Then this paper respectively uses a linear regression model and random forest model to forecast the 30-day trend of tesla stock.
And dependent variables are established by employing linear regression, which is a fundamental machine learning algorithm. By minimizing the gap between the anticipated and actual values to generate the most effective linear model to predict the future stock value, it focuses its methodology on the linear relationship among a collection of input factors (throughout factors) and target variables (dependent variables). It is often used in the field of forecasting and modeling, such as stock price forecasting, house price forecasting, sales forecasting, traffic forecasting, etc. In addition, linear regression is also commonly used in feature selection, anomaly detection, data exploration, and other fields. In addition, business, science, and pretty much every other sector where expectations and anticipating are important use linear regression. The formula for the linear regression model is as follows:
Y = b0 + b1X1 + b2X2 +…+bnXn (1)
The predicted y - value, being variable to be predicted, and the independent variables make up the linear regression model. X1, X2...Xn, representing factors that influence the dependent variable. The intercept, denoted by b0, and the coefficients of the independent variables, represented by b1, b2...bn, complete the model. Following figure 1 will show the comparison between actual stock and predicted stock using a linear regression model. Figure 1 illustrates the number of days, and Y demonstrates the closing price of the Tesla stock.
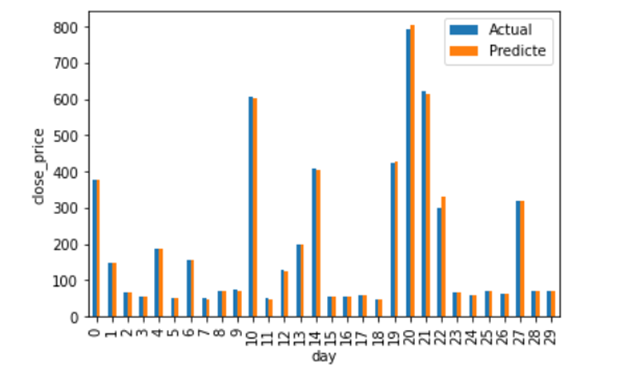
Figure 1: Comparison between actual stock and predict stock in next 30 days.
2.3. Random Forest
In classification problems, a machine learning method known as a random forest is utilized, which involves constructing multiple decision trees during the training phase. The modeling process of the random forests is the trees' crucial factor that determines. whereas for regression tasks, the median or standard deviation forecast of each tree is returned. The propensity of decision trees to extrapolate their training set can be corrected by random decision forests. [7]. Even though the decision tree algorithm generally supersedes random forests in accuracy, horizontal stripe trees are more accurate. However, data characteristics can impact how well they perform. [8-9]. Random forests outperform bagged trees because of a minor modification that decorrelates the trees. Using boot-strapped training samples, the paper constructs some decision trees. A random sample of m forecasters is selected as split possibilities when thinking about just a breakup in a tree from the whole set of p predictors. Every instance separation is considered, the process is repeated. A new sample of m predictors is chosen for each split in which only one of the m predictors can be used. It is typically chosen that m p is used, implying that the calculation of the overall prediction number is roughly corresponding to the number of predictors taken into account at each split [10]. Random forests are commonly used for classification and regression problems and perform well in many practical applications such as financial forecasting, medical diagnosis, image recognition, etc. The formula for the random forest model is as follows:
\( \hat{y}=\frac{1}{M}Σ_{ⅈ=1}^{M}{f_{i}}(x) \) (2)
Where \( \hat{y} \) is the outcome of the hypothesis of the input sample x, \( {f_{i}}(x) \) shows the prediction result of the i-th decision tree, and M is the random forest's number of decision trees. The random forest model will be used in Figure 2 to forecast the trend of Tesla stock over the next 30 days.
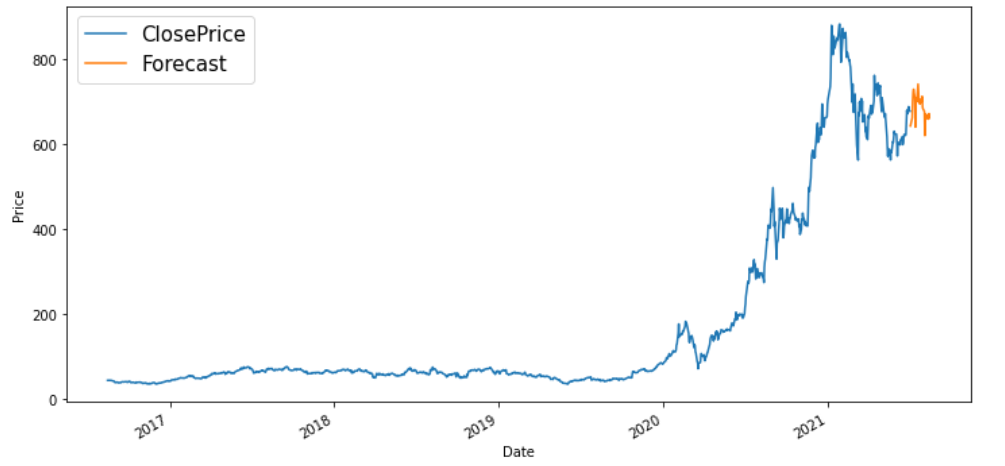
Figure 2: Predict the 30-day trend of Tesla stock using a random forest model.
3. Results
To forecast the trend of tesla's stock over the subsequent 30 days based on the current data set, two separate models, linear regression and random forest, were used. Although the parameters for the two models' training and test sets are identical, there is a slight variation in the prediction accuracy of the two models. While the random forest model's accuracy is only 97.25 percent, that of the linear regression model is up to 99.99% when compared to the R2. This means that linear regression-based machine learning techniques are preferable to random forest techniques for data set prediction. In addition, there are certain differences in the accuracy of MAE, MSE, and MRSE between the two, and table 3 below displays the precise differences.
Table 3: Prediction accuracy of linear regression model and random forest model.
R2 | MAE | MSE | MRSE | |
Linear regression | 99.96 | 1.763 | 17.986 | 4.241 |
Random Forest | 97.25 | 18.972 | 1301.363 | 36.074 |
The findings in the following table demonstrate that both models are excellent fits for the given data set, but the linear regression model is still superior. First of all, the prediction accuracy of R2 of the line regression model is close to 1. Secondly, through the above Figure1 and Figure2, it can be seen intuitively that the regression model using the line between the predicted value and the real value is more reductive It can be claimed that these two machine learning approaches are used to predict Tesla stock is desirable given the current research landscape since prediction accuracy reveals that Tesla's movement in the next 30 days will likely be similar to the outcomes indicated by the two models. Apart from the R2 value indicating the high predictive accuracy of the first model, it also has the advantage of interpretability. This indicates that the relationship between the input variables and the anticipated result in the linear regression approach is simpler to comprehend. This can be useful in situations where it is important to understand how different factors are affecting the outcome, such as in financial analysis. Furthermore, the linear regression model has been widely used in various fields, such as economics, social sciences, and engineering. Therefore, it has a strong theoretical and practical foundation, and it is easier to compare the results of the linear regression model with previous studies or established models. However, it is worth noting that the choice of the machine learning approach depends on the specific problem and data set being analyzed. When assessing findings, other methodologies for machine learning much like the random forest or support vector machines might become preferable. Therefore, it is important to carefully evaluate and compare different machine learning models before selecting the most suitable one for a given task.
4. Conclusion
According to this study, using machine learning techniques is theoretically feasible to predict the prices of Tesla stock. The following reasons may help to explain this. Both the random forest and linear regression models used in this study preprocessed the data before splitting it into two sets. The final result was mathematically calculated to determine the corresponding R2, MAE, MSE, and MRSE and use the matplotlib standard library to visualize the data. This research does, however, have some restrictions. Just linear regression and random forest are used in the machine learning approach. In addition, it's essential to bear in mind that there are still some restrictions on using algorithms to guess stock prices. One limitation is the availability and quality of data. Inaccurate or incomplete data can lead to inaccurate predictions, and some factors that may affect stock prices may not be captured in the available data. Another drawback is the potential for overfitting, which arises when a model is excessively intricate and closely fits the training data. The accuracy rate upon that training instances may arise from this, but performance on fresh, unused data may suffer. To avoid overfitting, carefully select and preprocess the data, select an appropriate model, and evaluate the model's performance using techniques such as cross-validation. Consequently, it is only possible to conclude that in the context of this study, machine learning is very effective at predicting the trend of the stock. Even so, there is a good chance that machine learning techniques will be used to forecast stock market trends. These techniques can be applied to the related variable operations mentioned above in the future for further optimization, or they can be used to compare various models to make it easier to conduct in-depth research on this subject. To conclude, the potential of machine learning techniques in forecasting stock prices is evident, however, their efficacy relies on the nature of the problem and dataset under investigation. Further research is needed to explore the potential of these techniques and to develop more accurate and reliable models for predicting stock prices.
References
[1]. Yahoo!: Tesla, Inc. (TSLA) Stock Price, News, Quote & History. Retrieved April 3, 2023, from https://finance.yahoo.com/quote/TSLA/.
[2]. Srivastava P., Mishra P, K.: Stock Market Prediction Using RNN LSTM.In 2021 2nd Global Conference for Advancement in Technology (GCAT), pp. 1-5. IEEE, Bangalore, India (2021).
[3]. Marchai F. L., Martin W., Suhartono D.: Stock Prices Prediction Using Machine Learning. In: 8th International Conference on Information Technology, Computer and Electrical Engineering (ICITACEE), pp. 79-84. IEEE, Semarang, Indonesia (2021).
[4]. Mottaghi N., Farhangdoost S.: Stock Price Forecasting in Presence of Covid-19 Pandemic and Evaluating Performances of Machine Learning Models for Time-Series Forecasting, Papers 2105.02785, arXiv.org. (2021).
[5]. Chatterjee A., Bhowmik H., Sen J.: Stock Price Prediction Using Time Series, Econometric, Machine Learning, and Deep Learning Models. In: 2021 IEEE Mysore Sub Section International Conference (MysuruCon), pp. 289-296.IEEE (2021).
[6]. Bhuriya D., Kaushal G., Sharma A., Singh U.: Stock Market Prediction Using A Linear Regression. In: International conference of Electronics, Communication and Aerospace Technology (ICECA), pp. 510-513.IEEE (2017).
[7]. Hastie, T., Tibshirani, R., Friedman, Jerome, F.: The Elements of Statis-tical Learning Data Mining, Inference, and Prediction. 2nd edn. Springer, Heidelberg (2009).
[8]. Piryonesi S, M., El-Diraby T, E.: Role of Data Analytics in Infrastructure Asset Management: Overcoming Data Size and Quality Problems. Journal of Transportation Engineering, Part B: Pavements. 146 (2), (2020).
[9]. Piryonesi S., M., El-Diraby T, E.: Using Machine Learning to Examine Impact of Type of Performance Indicator on Flexible Pavement Deterioration Modeling. Journal of Infrastructure Systems. 27 (2), (2021).
[10]. Gareth J., Daniela W., Trevor H., et al.: An Introduction to Statistical Learning with applications in R. P343-345, Springer New York, NY (2021).
Cite this article
Dai,S. (2023). Using Machine Learning Methods to Predict Tesla Stock. Advances in Economics, Management and Political Sciences,45,95-101.
Data availability
The datasets used and/or analyzed during the current study will be available from the authors upon reasonable request.
Disclaimer/Publisher's Note
The statements, opinions and data contained in all publications are solely those of the individual author(s) and contributor(s) and not of EWA Publishing and/or the editor(s). EWA Publishing and/or the editor(s) disclaim responsibility for any injury to people or property resulting from any ideas, methods, instructions or products referred to in the content.
About volume
Volume title: Proceedings of the 2nd International Conference on Financial Technology and Business Analysis
© 2024 by the author(s). Licensee EWA Publishing, Oxford, UK. This article is an open access article distributed under the terms and
conditions of the Creative Commons Attribution (CC BY) license. Authors who
publish this series agree to the following terms:
1. Authors retain copyright and grant the series right of first publication with the work simultaneously licensed under a Creative Commons
Attribution License that allows others to share the work with an acknowledgment of the work's authorship and initial publication in this
series.
2. Authors are able to enter into separate, additional contractual arrangements for the non-exclusive distribution of the series's published
version of the work (e.g., post it to an institutional repository or publish it in a book), with an acknowledgment of its initial
publication in this series.
3. Authors are permitted and encouraged to post their work online (e.g., in institutional repositories or on their website) prior to and
during the submission process, as it can lead to productive exchanges, as well as earlier and greater citation of published work (See
Open access policy for details).
References
[1]. Yahoo!: Tesla, Inc. (TSLA) Stock Price, News, Quote & History. Retrieved April 3, 2023, from https://finance.yahoo.com/quote/TSLA/.
[2]. Srivastava P., Mishra P, K.: Stock Market Prediction Using RNN LSTM.In 2021 2nd Global Conference for Advancement in Technology (GCAT), pp. 1-5. IEEE, Bangalore, India (2021).
[3]. Marchai F. L., Martin W., Suhartono D.: Stock Prices Prediction Using Machine Learning. In: 8th International Conference on Information Technology, Computer and Electrical Engineering (ICITACEE), pp. 79-84. IEEE, Semarang, Indonesia (2021).
[4]. Mottaghi N., Farhangdoost S.: Stock Price Forecasting in Presence of Covid-19 Pandemic and Evaluating Performances of Machine Learning Models for Time-Series Forecasting, Papers 2105.02785, arXiv.org. (2021).
[5]. Chatterjee A., Bhowmik H., Sen J.: Stock Price Prediction Using Time Series, Econometric, Machine Learning, and Deep Learning Models. In: 2021 IEEE Mysore Sub Section International Conference (MysuruCon), pp. 289-296.IEEE (2021).
[6]. Bhuriya D., Kaushal G., Sharma A., Singh U.: Stock Market Prediction Using A Linear Regression. In: International conference of Electronics, Communication and Aerospace Technology (ICECA), pp. 510-513.IEEE (2017).
[7]. Hastie, T., Tibshirani, R., Friedman, Jerome, F.: The Elements of Statis-tical Learning Data Mining, Inference, and Prediction. 2nd edn. Springer, Heidelberg (2009).
[8]. Piryonesi S, M., El-Diraby T, E.: Role of Data Analytics in Infrastructure Asset Management: Overcoming Data Size and Quality Problems. Journal of Transportation Engineering, Part B: Pavements. 146 (2), (2020).
[9]. Piryonesi S., M., El-Diraby T, E.: Using Machine Learning to Examine Impact of Type of Performance Indicator on Flexible Pavement Deterioration Modeling. Journal of Infrastructure Systems. 27 (2), (2021).
[10]. Gareth J., Daniela W., Trevor H., et al.: An Introduction to Statistical Learning with applications in R. P343-345, Springer New York, NY (2021).