


1. Introduction
In this section, the aim of this paper will be introduced more specifically. This study uses stock data of Tencent Holdings Ltd. (It will be abbreviated to Tencent in the later paper). According to the website of Tencent, Tencent is an internet corporation that enriches the lives of internet users through technology and helps enterprises digitally upgrade. Now Tencent has over 3.68 trillion HKD market share. For more deep information about Tencent, the article written by Melnik [1] gives an idea, In the late 1990s, Ma Huateng worked for China Motion Telecom Development as a software developer. He went to see ICQ, the first computer-based online instant messaging service, presented by Israeli startup Mirabilis. This gave Ma Huateng inspiration, and he created Tencent with his former classmates Zhang Zhidong, Xu Chenye, Chen Yidan, and Zeng Liqing in 1998. In February 1999, they released their first significant product, QICQ, a Chinese equivalent of ICQ. They soon changed the name of their product to "QQ" because to the copyright dispute from America. QQ has expanded beyond its roots in instant messaging to include shopping, games, music, blogging, and other services [1]. As of 2016, the network has 899 million active users. QQ was just one of this company's early online offerings, but its enormous success encouraged Ma Huateng to develop further goods. Until July of 2019, it is recorded according also to this article that Tencent has 35 products and services and each of them is a huge one. While in its gaming division, also according to the article, Honour of Kings, a 2015 mobile multiplayer online battle arena (MOBA) game developed by the firm, surpassed all previous records for revenue in 2017 [1]. To increase its profits, Tencent also made investments in a number of well-known gaming firms and bought a number of well-known titles. After QQ, Tencent quickly created another chat platform. From the same article, it can be found that in 2011, WeChat (Weixin), the company's most popular platform, was introduced by Tencent. Wechat is a multipurpose site similar to Facebook, but only available to Chinese people. And in China, WeChat had more than a billion active users by 2018. WeChat can be used for a variety of things, including texting, audio and video chatting, image and video sharing, and "moments," a tool for publishing similar to Facebook [1]. Wechat not only has the function for information sharing, it also has gone into the daily life of every Chinese citizen such as paying, eating, or going out for a trip.
The paper uses the data from Tencent to analyze and predict the stock price by python, a coding language, using different methods of linear regression on basic data, Muti-Layer Perceptron (Later will be called MLP) regression on basic data, linear regression on data after processed by log difference and MLP regression on data after processed by log difference. These methods in detail will be written in the next session and the result will be in section 3 with both graph and a brief analyze. On section 4, each method will be compared with each other on respects about accuracy, graph shape and additionally other papers about machine learning.
2. Literature Review
Machine learning has become a such popular topic recently. It can be used in various industries even to fields that seems to have nothing to do with it. In a previous study of Jordan and Mitchell [2], The field of machine learning is concerned with two related issues: How can one create computer systems that automatically get better with use? likewise, "What are the basic statistical, computational, information theoretic laws that underlie all learning systems, including those in computers, people, and organisations ?" The study of machine learning is crucial for assisting in the resolution of these fundamental scientific and engineering problems as well as for the incredibly useful computer software that has been developed and used in several applications. The importance of machine learning was well stated in the previous study. As a useful thing to solve problems by training and training, applying it on problems about diagnosing diseases, predicting the trend of something and recognizing things in daily life can have great feedback.
In this paper, machine learning is going to be applied on stock prediction and analysis. While machine learning can be divided into three categories which are supervised learning, unsupervised learning and reinforcement learning. The meaning of each method is easy to understand based on its name and supervised learning has a better use in predicting and analyzing stock price. A study by Jordan and Mitchell [2] gives a general meaning and examples of supervised learning. In most cases, predictions made by supervised learning systems are based on a learnt mapping, f(x), which generates an output, y, for every input, x (or a probability distribution over y given x). Decision trees, decision forests, logistic regression, support vector machines, neural networks, kernel machines, and Bayesian classifiers are only a few examples of the various mapping f types. These many kinds of translations can be estimated using a variety of learning strategies. To be more accurate, generic procedures also exists, such as boosting and mutiple kernel learning. This procedure and combine the results of multiple algorithms mentioned before to make a more general result. Innovations in the practise of learning f from data were frequently driven by concepts from numerical analysis or optimisation theory, with the particular structure of machine-learning issues (e.g., that the objective function or function to be integrated is frequently the sum over a large number of terms) as the driving force. The variety of these many methods for locating f can suit a variety of objectives [2]. One reason for supervised learning can apply in predicting stock is that the specific price should be given after training by historical price of the stock. The historical data supervises the whole algorithm and gives an predict answer. Therefore, this paper will focus mainly about some supervised learning algorithms which are stated in the third section of this paper on predicting and analyzing stock price.
The superficial reason for why predicting stock is useful is evident. If stock is predicted with high accuracy, investing stocks that are predicted to rise a lot will be highly profitable. However, it is hard to predict stock price just by looking at it just with an eye. In the previous work of Patel, Shah, Thakkar et al. [3], Predicting stock and stock price index is difficult due to the uncertainties such as the company being bankrupted involved. Investors can use two sorts of analysis to determine whether their investment will be profitable before placing a bet on a stock. The fundamental analysis comes first. Investors use this to determine whether or not to invest by looking at the intrinsic worth of stocks, the performance of the sector and economy, the political environment, etc. Technical analysis, on the other hand, examines the statistics generated by market action, such as previous prices and volumes. In order to forecast the trend and the price of the stock in the future, investors who use this sort of research simply concentrate on the chart and data from the past stock information and ignore the intrinsic value of the stock. Therefore, data that has been correctly and effectively pre-processed using good algorithms can provide an accurate trend and price index of the stock [3]. This paper uses python to pre-process the raw data and applies different methods as introduced above to predict the trend and the stock price of Tencent.
Predicting stock price using machine learning methods has been tried by many researchers. One of the papers by Shen and Jiang suggests in their conclusion that various machine learning based models are proposed for predicting daily trend of US stocks and numerical results suggests high accuracy [4]. With the previous research on this topic, the feasibility on machine learning on predicting Tencent stock is high.
3. Data and Methodology
This session will discuss further on introducing the steps for sessions below and the four methods that will be used on session 4. The methods that will be used are linear regression on basic data, MLP regression on basic data, linear regression on data after processed by log difference and MLP regression on data after processed by log difference. The text below will introduce the steps and the categories of these methods, linear regression, MLP regression, and method of log difference in processing data.
3.1. Data
First, the dataset will be imported. Then, different methods will be applied to process data. The two methods this research will do is basic and log difference data. The next stage is the normalization of dataset. After that is training and predicting the data using linear regression and MLP for each processing method. Accuracies would be found for each data and compared with each other. As the result is derived, it would be analyzed to see which method is better and some further improvement for this research needs can be found.
For data importation, the data is from Kaggle.com Daily Game Companies Historical Stock Price 9.2022 (https://www.kaggle.com/datasets/psycon/game-companies-historical-stock-price-2022-04). Here is the graph of the basic stock data for Tencent and it is shown that the stock price is eventually going up (Figure 1).
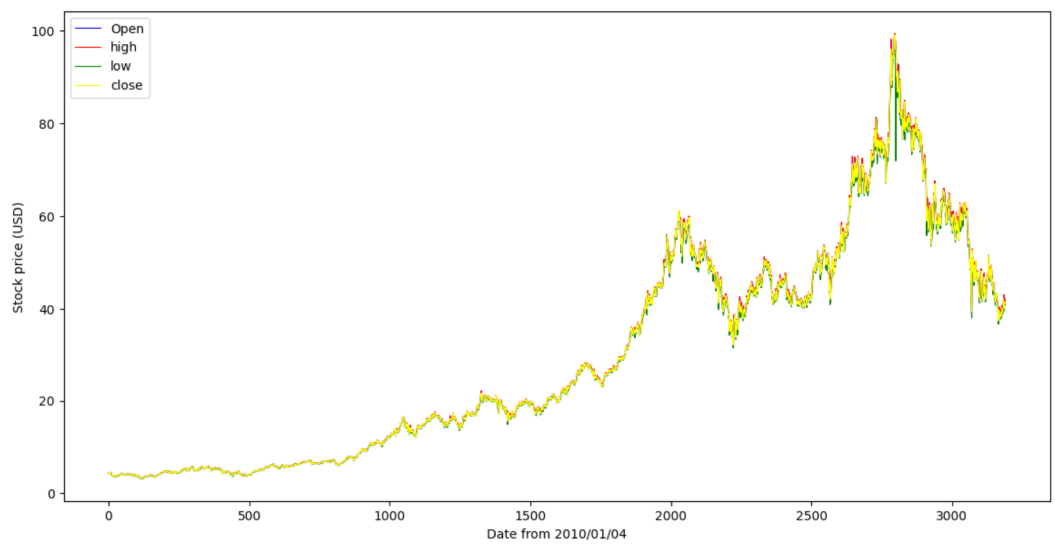
Figure 1: This is a basic stock data for Tencent from 2010/1/04 to 2022/09/02, each line represents each stock data for Tencent at that day.
For data normalization, the data is normalized to a smaller scale about -1 to 1 so that the MSE and can be compared more directly between methods.
For data training, this research divides the training and test set to a ratio of 8:2.
For finding accuracy, MSE which shows the mean squared error of the predicted data, and the value difference and accuracy for price moving direction (rise or fall) will be applied.
3.2. Methods for Predicting the Data
3.2.1. Simple Linear Regression
Linear regression is basically a method to estimate the coefficient of the line regressed by given data. To be deeper, according to the prior work of Maulud and Abdulazeez [5], A case model with only one independent variable is known as simple linear regression. Simple linear regression identifies a variable's dependence. The formula is shown below as (1):
\( y=β0+β1x+ε \) (1)
The influence of independent variables is distinguished from the interaction of dependent variables by simple regression [5]. In an easier word, this method processes the data into the nearest linear model that makes prediction possible. This is a relatively easy method to use. However, even this simple linear regression can estimate with high accuracy based on researches before.
3.2.2. Muti-Layer Perceptron (MLP) Regression
Muti-Layer Perceptron (MLP) is a supervised learning algorithm using neuron network which can be applied on learning to predict stock price.
In a previous working by Nassif, Ho, and Capretz [6] about machine learning of software, a simple description of one example of MLP regression model which is shown below as Figure 2 is given. The eight environmental elements, which are the eight input nodes, have an impact on team productivity through the software size major inputs. The network will stop training the inputs and be prepared to output when there are 250 epochs, zero Mean Squared Error (MSE), or mu values greater than 1e + 10. There is no control over when the network should stop training because the training time is set to "Infinity". That was a succinct explanation of some of the parameters and the fundamentals of the model depicted in Figure 2 [6].
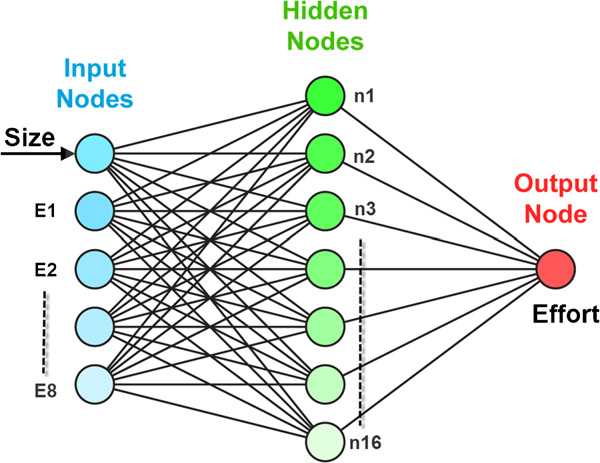
Figure 2: MLP model.
For the parameters in this paper, the number of inputs is set to 7 since each period of 7 days is used to predict the next day’s stock price, the limit of number of epochs is set to 1500 as the loss is not low enough to predict accurately when numbers epochs is set low, the middle hidden layer has 100 nodes as a randomly chosen high number, and the output node is set to 1 to get the predicted day’s stock price. Additionally, loss of each training will be recorded and will be summarized later when practically using MLP.
3.2.3. Method of Log Difference in Processing Data
When processing data, the logarithm of one quantity is subtracted from the logarithm of another quantity, creating a log difference. The rise and the fall in price is shown directly from the data. According to Joseph Strell in a website for working people to discuss [7], When quantifying change, log differences, which are the difference between the logarithms of two numbers, can be used instead of % change. Since the additive inverse of one direction's log difference simply equals the other, this method's calculations are symmetrical in both directions (a number added to its additive inverse equals zero). Additionally, the log difference between the last observation and the first observation as well as the sum of the log differences of the entire series of numbers' two amounts are identical [7]. The equation for log difference is given below.
\( Log difference=ln{xt}-ln{xt-1} \) (2)
3.3. Two Methods for Calculating Accuracy
The Mean Squared Error technique assesses the degree of data separation. By displaying the separation or squared difference to the genuine data in this study, the MSE provides the error of the projected data to the true data. According to a statistics-focused website [8], the formula of MSE is shown below.
\( MSE=\frac{\sum {({y_{i}}-{\hat{y}_{i}})^{2}}}{n} \) (3)
Where: \( {y_{i}} \) is the ith observed value. \( {\hat{y}_{i}} \) is the corresponding predicted value. n = the number of observations.
It added that calculations for the mean-squared-error is similar to the calulations for variance which is just subtracting the observed value and the predicted value, square the result, take sum of all these differences, and divide it by the number of observations. The website stated,” Notice that the numerator is the sum of the squared errors (SSE), which linear regression minimizes. MSE simply divides the SSE by the sample size [8].”
Accuracy for up and down or the trend of the stock, this accuracy measures the percentage of the correctly predicted trend where the predicted direction and the true direction of the stock are the same. This shows a more practical accuracy which are much easier to understand. The formula of calculating this type of accuracy is given as follows.
\( Accuracy=\frac{Number of correct prediction of up or down}{Number of prediction} \) (4)
4. Results
The result of each method will be shown below. They are linear regression on basic data, MLP regression on basic data, linear regression on data after processed by log difference and MLP regression on data after processed by log difference.
4.1. Linear Regression on Basic Data
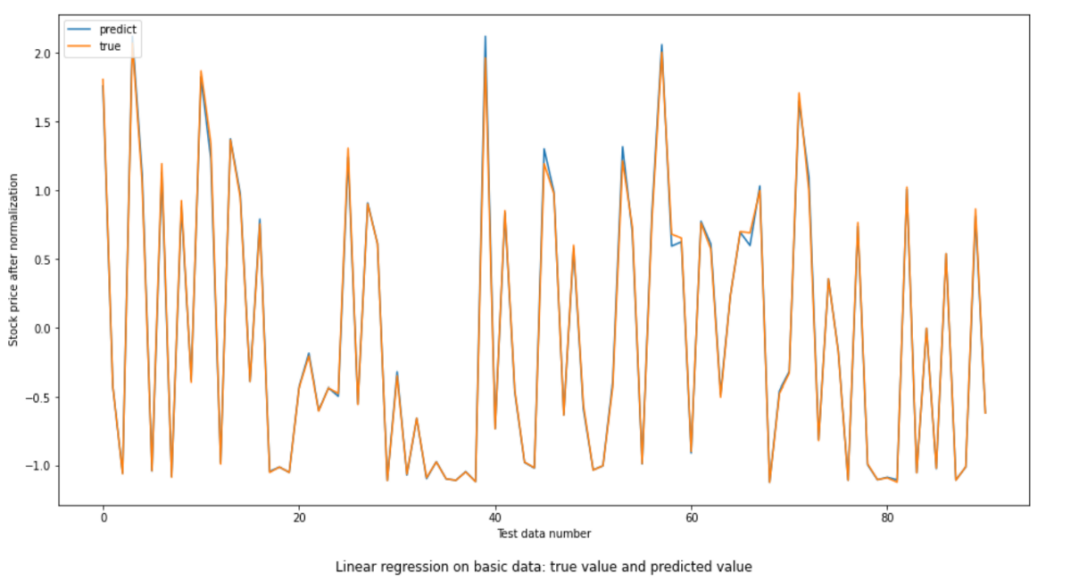
Figure 3: Linear regression on basic data: true value and predicted value.
The MSE calculated is 0.001471 and the accuracy about rise and fall is 98.9% which are of a high accuracy. By looking at the graph, the red or predicted line only deviates the true or blue line a little which can also prove its accuracy (Figure 3).
4.2. MLP Regression on Basic Data
The parameters for this algorithm are set by epochs to 1500 (trained 1500 times) and activation method: tanh. The graph below gives the true stock price and predicted test stock price from training stock.
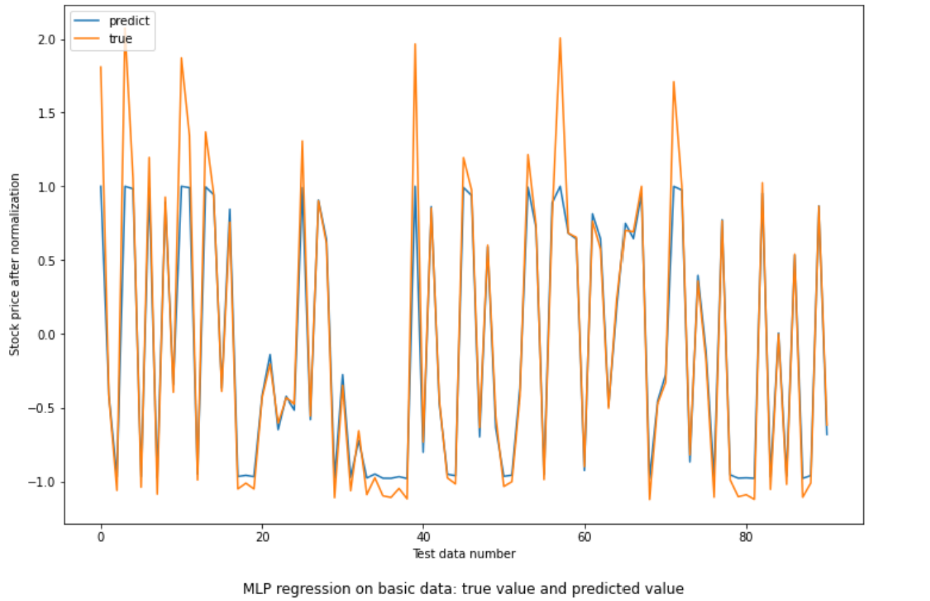
Figure 4: MLP regression on basic data: true value and predicted value.
The loss goes from 0.4152 to 0.1206 which constricts from a low value to a very low value which shows the method is doing good. The MSE collected is 0.06464. This MSE value shows a low but not the lowest dispersion of stock price predicted to the true stock price. The accuracy of up and down 100% which is perfect for predicting stock price (Figure 4).
4.3. Linear Regression on Data After Processed by Log Difference
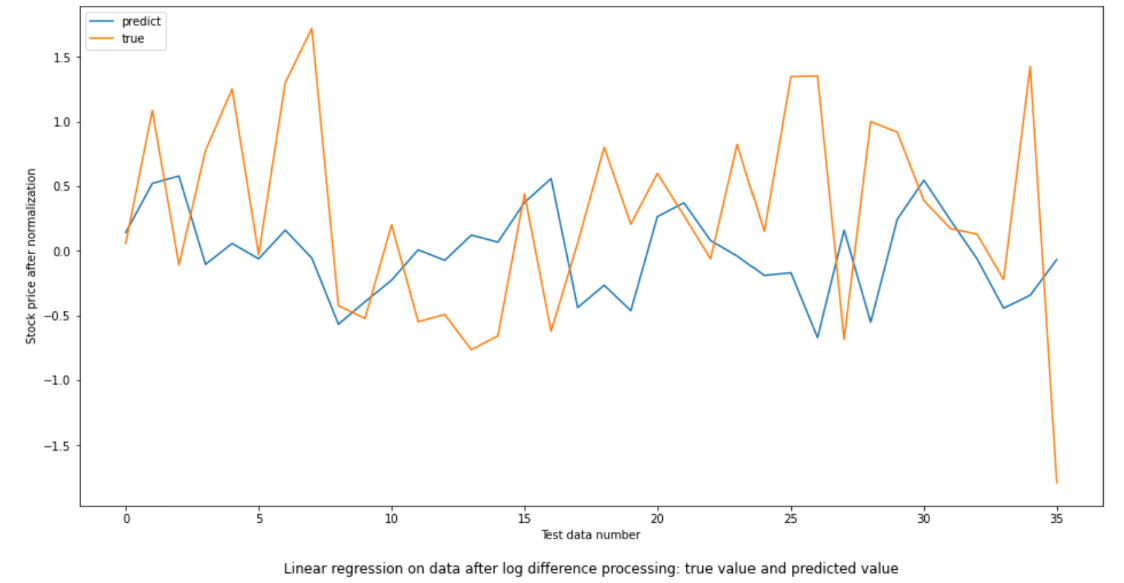
Figure 5: Linear regression on data after log difference processing: true value and predicted value.
The MSE for this method is 0.83249 which is a high value for data that has been normalized. The accuracy for up and down is 44.4%. This is lower even to the probability of randomly tossing a fair coin. As in the Figure 5, the two lines goes far apart also indicates the low accuracy of this method. The graph below gives the true stock price and predicted test stock price from training stock.
4.4. MLP Regression on Data After Processed by Log Difference
The parameters for this algorithm are set by epochs to 1500 (trained 1500 times) and activation method: tanh. The graph below gives the true stock price and predicted test stock price from training stock.
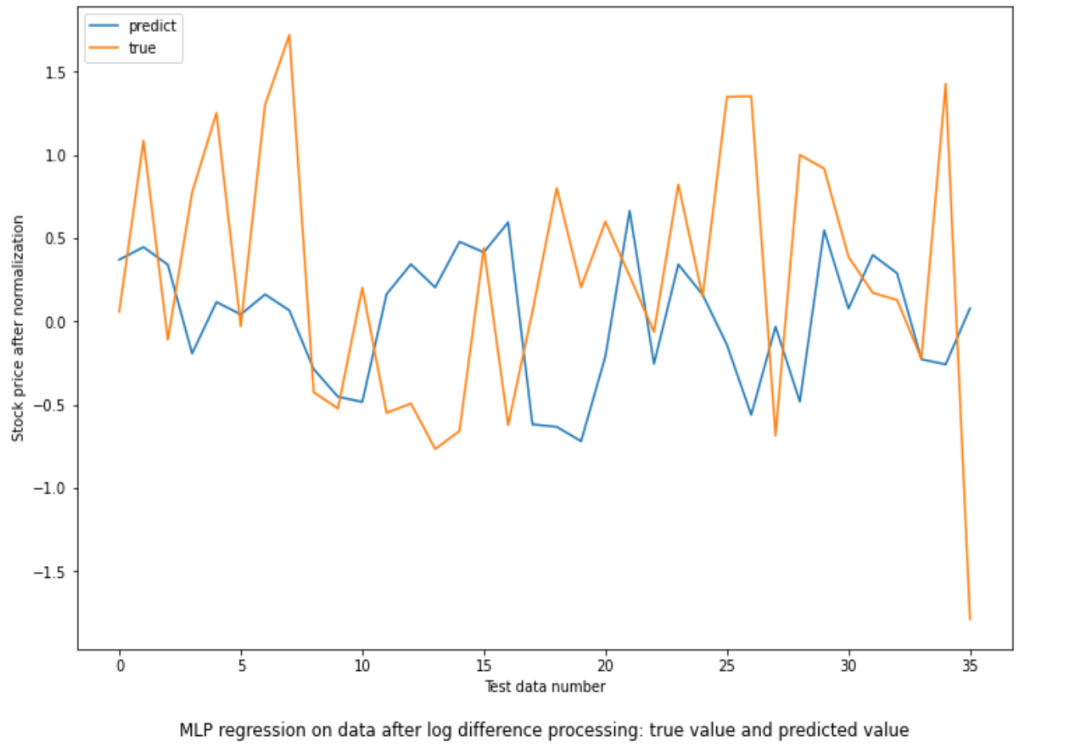
Figure 6: MLP regression on data after log difference processing: true value and predicted value.
From Figure 6, the loss for the training part lowers from 1.1203 to 0.6510 which is also a high descent but stays at a relatively high value at last. The MSE calculated is 0.87541. This MSE value is the highest amongst all methods. As to normalized data, this value is high that the predicted value is far apart to the true data. The accuracy for up and down is 52.8%. This is higher than randomly tossing a fair coin, so this method is valid but still not enough to predict stock price and tendency.
5. Comparison Between These Methods
Among these methods, the method on processing the basic data has a better performance. They are very close to 100%. Method that predicts after log difference has accuracy only close to the probability for throwing a fair coin. Among the best two methods, linear regression method on basic data has smaller MSE so it can be used to find value about price. MLP method on basic data has a better accuracy, so using it on finding price moving trend can be good.
According to the previous work by Rouf N, Malik MB, Arif T, et al. [9], for NASDAQ price prediction, the study compared the performance of three ANN models: MLP, dynamic artificial neural network (DAN2), and autoregressive conditional heteroscedasticity (GARCH). The Mean Absolute Deviate (MAD) and Mean Square Error (MSE) were used to compare the performance of the three models. As a result, MLP performed better than DAN2 and GARCH-MLP. The study used a different study that predicted the Istanbul Stock Exchange (ISE) market index using Generalised Feed Forwards (GFF) and MLP models. The data were obtained from the Turkish Central Bank. Various hidden layer counts revealed a total of eight sets of predictions based on these techniques. On MA, two sets of forecasts were made. The coefficient of determination was used to determine the prediction's accuracy. One hidden layer was demonstrated to provide the best accuracy for both techniques [9]. The study above supports the high accuracy of MLP regression using only one hidden layer as it is used in this paper.
However, according to the previous work of Ahmed, Atiya, Gayar, et al. [10], they have presented a thorough analysis of the monthly M3 time series competition data (about a thousand time series) and the main machine learning models for time series forecasting. They believed that the comparison study will close the research gap in this area. Generalised regression neural networks, also known as kernel regression, multilayer perceptrons, Bayesian neural networks, radial basis functions, K-nearest neighbour regression, CART regression trees, support vector regression, and Gaussian processes are among the models taken into consideration [10]. The study reveals significant differences between the different methods. The best two methods turned out to be the multilayer perceptron and the Gaussian process regression.” This claim seems to contradict with this paper’s conclusion that MLP is the best. Some factors like some characteristics of this data may influence the result but the contradiction is still a researchable question.
6. Conclusion
The aim of this paper is to predict Tencent stock using various machine learning methods. The data has been imported and normalized first. Then the ‘close’ part of the data has been picked out to analyze. Four methods are implemented afterwards on the data selected. They are linear regression on basic data, MLP regression on basic data, linear regression on data after processed by log difference and MLP regression on data after processed by log difference. Then, the results are given by running python code with a graph. Accuracies of MSE and accuracy for up or down have been calculated. Further discussions about these methods have been done with linear regression method as the better one to apply.
The main conclusion after analyzing is that prediction on basic data has higher accuracy than predicting on data after processed by log difference, linear regression seems to have higher accuracy on MSE which shows the value error and MLP regression seems to have higher accuracy on predicting the trend of the stock. The research can potentially be used in later prediction on Tencent corporation and even on other corporations. Trying more methods and compare them to find the best one or test the accuracy with different prediction time interval can be a good start. Further work can also focus on the whole stock market based on prediction on more corporations.
Some deficiencies for this research are limited methods to use and limited testing data to find the accuracy. Methods like logistic regression, polynomial regression, quantile regression could be tried in later research. Additionally, more datasets can be used either about other gaming corporations’ stocks or on other technological firms’ stocks. Hopefully the readers can get inspiration from this research.
References
[1]. Melnik, Jeffrey.: China’s “National Champions” Alibaba, Tencent, and Huawei. Education About Asia 24.2 (2019): 28-33.
[2]. Jordan, M. I., Mitchell, T. M.: Machine learning: Trends, perspectives, and prospects. Science, 349(6245), 255-260, (2015).
[3]. Shen, S., Jiang H., Zhang T.: Stock market forecasting using machine learning algorithms. Department of Electrical Engineering, Stanford University, Stanford, CA (2012): 1-5.
[4]. Patel, J., Shah S., Thakkar P., Kotecha K.: Predicting stock and stock price index movement using Trend Deterministic Data Preparation and machine learning techniques, Expert Systems with Applications, Volume 42, Issue 1, Pages 259-268, ISSN 0957-4174, (2015).
[5]. Maulud, D., Abdulazeez, A. M.: A review on linear regression comprehensive in machine learning. Journal of Applied Science and Technology Trends, 1(4), 140-147, (2020).
[6]. Nassif, Ali Bou, Danny Ho, and Luiz Fernando Capretz. "Towards an early software estimation using log-linear regression and a multilayer perceptron model." Journal of Systems and Software 86.1 (2013): 144-160.
[7]. https://www.linkedin.com/pulse/measuring-change-log-differences-joseph-strell?trk=public_profile_article_view. Last assessed 9/4/2023.
[8]. Frost, J.: Mean Squared Error (MSE), https://statisticsbyjim.com/regression/mean-squared-error-mse/. Last assessed 9/4/2023.
[9]. Rouf N, Malik MB, Arif T, Sharma S, Singh S, Aich S, Kim H-Cv. “Stock Market Prediction Using Machine Learning Techniques: A Decade Survey on Methodologies, Recent Developments, and Future Directions. Electronics. 10(21),(2021).
[10]. Ahmed, N. K., Atiya, A. F., Gayar, N. E., El-Shishiny, H.: An empirical comparison of machine learning models for time series forecasting. Econometric reviews, 29(5-6), 594-621(2010).
Cite this article
Zhang,Y. (2023). Prediction on Tencent Stock Using the Machine Learning Methods. Advances in Economics, Management and Political Sciences,45,173-182.
Data availability
The datasets used and/or analyzed during the current study will be available from the authors upon reasonable request.
Disclaimer/Publisher's Note
The statements, opinions and data contained in all publications are solely those of the individual author(s) and contributor(s) and not of EWA Publishing and/or the editor(s). EWA Publishing and/or the editor(s) disclaim responsibility for any injury to people or property resulting from any ideas, methods, instructions or products referred to in the content.
About volume
Volume title: Proceedings of the 2nd International Conference on Financial Technology and Business Analysis
© 2024 by the author(s). Licensee EWA Publishing, Oxford, UK. This article is an open access article distributed under the terms and
conditions of the Creative Commons Attribution (CC BY) license. Authors who
publish this series agree to the following terms:
1. Authors retain copyright and grant the series right of first publication with the work simultaneously licensed under a Creative Commons
Attribution License that allows others to share the work with an acknowledgment of the work's authorship and initial publication in this
series.
2. Authors are able to enter into separate, additional contractual arrangements for the non-exclusive distribution of the series's published
version of the work (e.g., post it to an institutional repository or publish it in a book), with an acknowledgment of its initial
publication in this series.
3. Authors are permitted and encouraged to post their work online (e.g., in institutional repositories or on their website) prior to and
during the submission process, as it can lead to productive exchanges, as well as earlier and greater citation of published work (See
Open access policy for details).
References
[1]. Melnik, Jeffrey.: China’s “National Champions” Alibaba, Tencent, and Huawei. Education About Asia 24.2 (2019): 28-33.
[2]. Jordan, M. I., Mitchell, T. M.: Machine learning: Trends, perspectives, and prospects. Science, 349(6245), 255-260, (2015).
[3]. Shen, S., Jiang H., Zhang T.: Stock market forecasting using machine learning algorithms. Department of Electrical Engineering, Stanford University, Stanford, CA (2012): 1-5.
[4]. Patel, J., Shah S., Thakkar P., Kotecha K.: Predicting stock and stock price index movement using Trend Deterministic Data Preparation and machine learning techniques, Expert Systems with Applications, Volume 42, Issue 1, Pages 259-268, ISSN 0957-4174, (2015).
[5]. Maulud, D., Abdulazeez, A. M.: A review on linear regression comprehensive in machine learning. Journal of Applied Science and Technology Trends, 1(4), 140-147, (2020).
[6]. Nassif, Ali Bou, Danny Ho, and Luiz Fernando Capretz. "Towards an early software estimation using log-linear regression and a multilayer perceptron model." Journal of Systems and Software 86.1 (2013): 144-160.
[7]. https://www.linkedin.com/pulse/measuring-change-log-differences-joseph-strell?trk=public_profile_article_view. Last assessed 9/4/2023.
[8]. Frost, J.: Mean Squared Error (MSE), https://statisticsbyjim.com/regression/mean-squared-error-mse/. Last assessed 9/4/2023.
[9]. Rouf N, Malik MB, Arif T, Sharma S, Singh S, Aich S, Kim H-Cv. “Stock Market Prediction Using Machine Learning Techniques: A Decade Survey on Methodologies, Recent Developments, and Future Directions. Electronics. 10(21),(2021).
[10]. Ahmed, N. K., Atiya, A. F., Gayar, N. E., El-Shishiny, H.: An empirical comparison of machine learning models for time series forecasting. Econometric reviews, 29(5-6), 594-621(2010).