


1. Introduction
1.1. Background Information
Since 2020, the global spread of COVID-19 has impacted most industries to different degrees. The various prevention and control measures, such as national martial law, traffic control, closure of scenic spots and personnel isolation, have severely weakened peoples’ spending power. However, there are few papers which analyses the impact on the blind box market such as Pop Mart [1]. Therefore, this passage will analysis the influence of pop mart to fill the blank of this field.
Blind box economics can be defined as a kind of pleasing oneself consumption. This kind of consumption can be divided into two stages to produce a feeling of pleasing oneself. The first step is generating in the process of opening the box. From the unknown before opening to the surprise or loss after opening the blind box. The blind box consumption is a kind of emotional consumption. In addition, the blind box has aesthetic value and cultural beauty, which fully caters to the current young consumption and the psychology of groups seeking pleasure under social pressure. The second stage of pleasing oneself is caused by feeling brought by the social attributes that come with the blind box. With the popularity of short videos, all kinds of blind box videos are presented on the internet. Consumers will share their experience on the internet which will resonate emotionally with other consumer audiences. At this time, the feeling of self-pleasure is once again aroused [2].
1.2. Research Topic
This research will talk about the pandemic impact on the company, including their financial indicators and their stock price, and find out some hidden affection.
1.3. Research Method
First, the researcher browses their annual and semi-annual reports, and find some strange changes of their indicators such as the cost and so on. After that, the researcher collects these indicators and makes some graphs to see their changing trends. Later, the research finds specific reasons about these strange indicators and changing trends. The first way is to find some explanations in their reports and see how the official data explain about these questions. Later, some hidden information about these indicators is analysed. For instance, the transformation of their product structure, their performance in the market are presented. After that, the author makes a basic conclusion about this research.
1.4. Research Significance
This research can fill in the gaps in related fields and can show the impact on the blind-box market. After that, some relevant companies can get familiar with risks and avoid them before making some decisions.
2. The Case Study Analysis of Pop Mart
2.1. Performance of Capital Markets
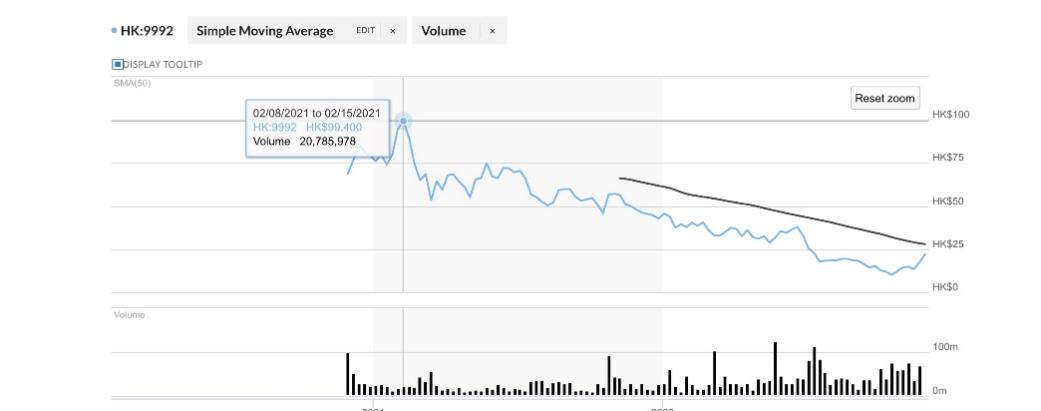
Figure 1:Performance of capital markets [3].
As shown in figure 1, at the end of 2020, pop mart’s shares are listed. We can see the candlestick chart in this picture. It is obvious that the stock price goes down in recently 2 years[3]. The stock price represents the market expectation of this company. The fact that stock prices decreased means the capital market did not have a high expectation about this company and as time goes by, they gradually reduce their expectation about pop mart. As a result, The stock price fell to one-tenth of its peak.
2.2. Some Strange Financial Indicators
2.2.1. The Change of Revenue and The Profit for the Period
Table 1: The change of revenue and the profit for the period.
For the six months ended 30 June | |||
2021 | 2022 | ||
RMB'000 | RMB'000 | change | |
Revenue | 1,772,577 | 2,358,818 | 33.10% |
Profit for the period | 358,798 | 332,945 | -7.20% |
Revenue is income derived from engaging in the main business or other business. It refers to the monetary income obtained by commercial enterprises from the sale of goods or the provision of services for a certain period of time. It is divided into main business income and other business income. The profit for the period refers to the amount of the total profit of the enterprise in the current period minus income tax, that is, the after-tax profit of the enterprise. Income tax refers to the total amount of profits realized by an enterprise to the state in accordance with the standards stipulated in the Income Tax Law. It is a deduction item for the total profit of the enterprise.
The first strange point is the relationship between the revenue and the profit for the period. In Table 1, compared with 2021 interim report[4], 2022 interim ‘s revenue grow is 33.1%, but the profit for the period decreases 7.2%[5]. When a company have a great increase in their revenue, it is normal for them to have a increase in their profit for the period. However, in pop mart’s disclosed data, this phenomenon did not happen. This is the first strange point in their reports.
2.2.2. The change of Inventory Turnover Days
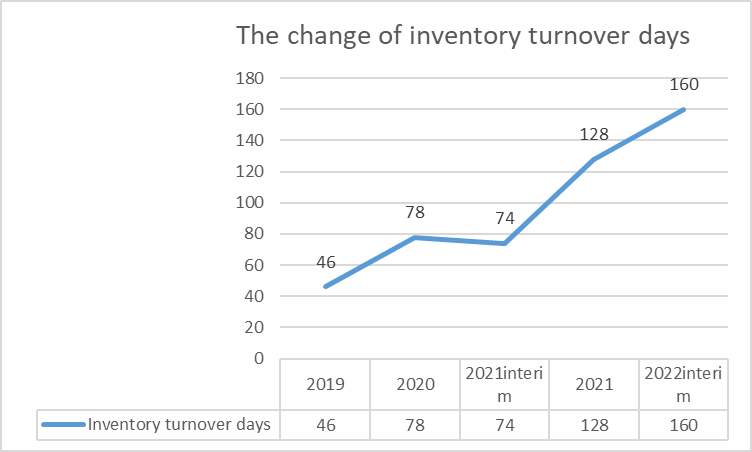
Figure 2: The change of inventory days.
The inventory turnover days refers to the number of days experienced by an enterprise from the time of acquiring inventory to consumption and sales. It is calculated by the proportional relationship between the cost of sales and the average inventory in a certain period of time (usually one year) of the enterprise. The fewer days turnover, the faster inventory can be realized. The shorter the time that inventory takes up capital, the more efficient inventory management is.
According to figure 2, since 2019, the inventory turnover days gradually increased. At 2019, the company can sell a batch of goods, but at 2022, it has spent nearly half of year to sell a batch of goods. It may be caused by two reasons. The first one is it is hard for them to sell their products. The market did not like their products like they used to. Second one is they enlarged their inventory level to embrace consumers’ need. Or the reason maybe combine two of them. Also, these strange indicators may also have some relationship with the revenue and profit.
2.3. Specific Reasons
2.3.1. The Impact of Pandemic
In their report, the company explains why their inventory turnover days increased in recent years[6]. They explain that the increase was primarily due to the increase in product inventories to meet the increase product demands and the increase balance of the inventories as a result of their sales falling short of their expectations due to the impact of the pandemic in the first half of 2022[7]. It is easy to comprehend them. because of the pandemic, many companies decided to cut off some employees in order to reduce the cost, which will help them have enough cash flow to meet the uncertain future. As a result, many people lost their job so they even do not have enough money to stay alive. It is hard for them to buy blind boxes again. Therefore, the company’ sales falling short of their expectations.
2.3.2. The Adjustment of Product Structure
In the first half of 2021, the company released a new production line called MEGA Collection Series[6]. This series represent high-quality and is characterized by both fashion and a deep sense of morality. Also, this series always joint with other brands such as coco-cola, moncler and so on. And some of them only sell with a limited number, which has increased the sales of this new series. Later, due to the limited quantity, many people pursued them at the price of the secondary market, even reaching several times the price of the primary market. In addition, because of joint series, many stars and trendy people showed their mega series in their social media like ins and so on. Gradually, this series became a fashion style and spread rapidly on the internet, which again stimulated sales. In their annual report, the company claims that they create a new high-end production line called ‘the MEGA Collection Serie’ that is characterized by both fashion and a deep sense of moral. In the first half of 2022, they joined with Moncler and Coca-Cola to launch heavyweight co-brand models. As can be seen from Table 2, in the first half of 2022, the revenue of the ‘MEGA Collection Series’ amounted to RMB193.4 million, which exceeded the revenue generated throughout last year.
Table 2:The report.
for the six months ended 30 June 2022 | for the six months ended 30 June 2021 | |||
revenue | proportion of revenue | revenue | propotion of revenue | |
RMB'000 | % | RMB'000 | % | |
Proprietary products | 2,155,652 | 91.4 | 1,582,391 | 89.3 |
proprietary ips | 1,528,226 | 64.8 | 900,409 | 50.9 |
SKULLPANDA | 461,766 | 19.6 | 183,042 | 10.3 |
Molly | 404,347 | 17.1 | 203,900 | 11.5 |
Dimoo | 298,442 | 12.7 | 204,993 | 11.6 |
Sweet Bean | 81,247 | 3.4 | 63,719 | 3.6 |
Bunny | 43,498 | 1.8 | 101,913 | 5.8 |
HIRONO | 37,538 | 1.6 | - | - |
other proprietary ips | 201,388 | 8.6 | 142,842 | 8.1 |
Exclusive licensed Ips | 326,798 | 13.9 | 394,316 | 22.2 |
The monsters | 134,887 | 5.7 | 145,789 | 8.2 |
PUCKY | 63,665 | 2.7 | 107,097 | 6.1 |
Other exclusive licensed Ips | 128,246 | 5.5 | 141,430 | 7.9 |
non-exclusive licensed Ips | 300,628 | 12.7 | 287,666 | 16.2 |
External procurement and consignment | 203,166 | 8.6 | 190,186 | 10.7 |
Total | 2,358,818 | 100 | 1,772,577 | 100 |
In the report, the company claims that they launched mega collection products for just DIMOO and SKULLPANDA. In the first half of 2022, the revenue of MEGA Collection Series amounted to RMB193.4 million. Also, in the report, their proprietary ips total revenue is 152226 million. So it is easy to find that the revenue brought by the MEGA Collection Series dominate 12.6% of the total revenue of the proprietary ips, which even supersede some small ips such as Sweet Bean, Bunny and so on. The reasons why this product change can affect the revenue, profit and inventory turnover days are as follows.
The MEGA Collection Series are bigger than the normal blind-box series[8]. Sometimes, the MEGA series are 4 times larger than the normal blind-box series, which means the manufacturing process is more complex. In addition, because they cooperate with other brands, this means that they must pay more attention to details to make the product more exquisite. By the way, because each MEGA Collection Series has a limited number. Therefore, each product will share more costs than normal series. So as a result, in their report. The revenue increases 33.1%, but the profit for the period decreased 7.2%. probably because they have more cost.
In the primary market, each blinded-box series will only cost nearly RMB70. But the MEGA Collection Series will cost at least RMB700. For instance 400% size will cost RMB999, the 1000% size will cost at least RMB5999. They are at least 12 times expensive than the blind-box series[9]. This means that customers cannot rebuy them in a short period because of the high price. According to what was mentioned above, in the past, many people bought the blind box series in a high frequency. Because they did not cost a lot and people can also get some emotional values during the process. But right now, it is hard for them to buy the MEGA Collection Series in a high frequency because of the high price. As a result, the inventory turnover days have increased because the time between purchases by consumers has been extended.
3. Conclusion
After a series of analysis, the fact that the POP MART’s stock price decreased can be attributed to two reasons. The first one is the impact of pandemic. And the second one is the change of product structure. Both of them affect their financial indicators in their annual report. As a result, the capital market gradually decreased the expectation for the company. Therefore, the stock price decreased in recent years.
Also, this essay has some limitations. First of all, it is difficult to predict the impact of adjusting the product structure on costs and the influence on the inventory turnover days. Second, the reasons about the stock price decline is a combination of many aspects. But in their report, they only explain some of them, not all of them. Third, as of the completion of the paper, the company has only disclosed the 2022 interim report. Therefore, we do not know the recent financial performance and operational changes of the company.
References
[1]. Audrey Guo.The Booming Art Toy Economy[J].China's Foreign Trade,2021(04):44-46.
[2]. Zhou, Changchen, (2019). Self-pleasing consumption: the extension of the individual's spirit in the material boundary [J]. The People's Forum, 2019(14), 74-65M
[3]. Home Page. MarketWatch. (n.d.). Retrieved March 30, 2023, from https://www.marketwatch.com/
[4]. Pop mart (no date) “Pop mart’s 2021 interim report.” Pop mart international group limited.
[5]. Pop mart (no date) “Pop mart’s 2022 interim report.” Pop mart international group limited.
[6]. Pop mart (no date) “Pop mart’s 2021 annual report.” Pop mart international group limited.
[7]. MA Yuyan. Marketing strategy of bubble mart tide play blind box[J]. Cooperative Economy and Technology,2022,(17):74-75.
[8]. ZHANG Wenjia. Research on image shaping of "Bubble Mart" blind box cultural and creative brand[D].Yangzhou University,2022).
[9]. TAO Hongyu,ZHANG Dalu. Analysis of the Path of the Rapid Rise of Teochew Play Brands under the Background of New Consumption: A Case Study of "POP MART Bubble Mart" Brand [J]. Hunan Packaging,2022,37(05):25-27+141.
Cite this article
Xiao,L. (2023). The Business Analysis of Pop Mart. Advances in Economics, Management and Political Sciences,45,208-213.
Data availability
The datasets used and/or analyzed during the current study will be available from the authors upon reasonable request.
Disclaimer/Publisher's Note
The statements, opinions and data contained in all publications are solely those of the individual author(s) and contributor(s) and not of EWA Publishing and/or the editor(s). EWA Publishing and/or the editor(s) disclaim responsibility for any injury to people or property resulting from any ideas, methods, instructions or products referred to in the content.
About volume
Volume title: Proceedings of the 2nd International Conference on Financial Technology and Business Analysis
© 2024 by the author(s). Licensee EWA Publishing, Oxford, UK. This article is an open access article distributed under the terms and
conditions of the Creative Commons Attribution (CC BY) license. Authors who
publish this series agree to the following terms:
1. Authors retain copyright and grant the series right of first publication with the work simultaneously licensed under a Creative Commons
Attribution License that allows others to share the work with an acknowledgment of the work's authorship and initial publication in this
series.
2. Authors are able to enter into separate, additional contractual arrangements for the non-exclusive distribution of the series's published
version of the work (e.g., post it to an institutional repository or publish it in a book), with an acknowledgment of its initial
publication in this series.
3. Authors are permitted and encouraged to post their work online (e.g., in institutional repositories or on their website) prior to and
during the submission process, as it can lead to productive exchanges, as well as earlier and greater citation of published work (See
Open access policy for details).
References
[1]. Audrey Guo.The Booming Art Toy Economy[J].China's Foreign Trade,2021(04):44-46.
[2]. Zhou, Changchen, (2019). Self-pleasing consumption: the extension of the individual's spirit in the material boundary [J]. The People's Forum, 2019(14), 74-65M
[3]. Home Page. MarketWatch. (n.d.). Retrieved March 30, 2023, from https://www.marketwatch.com/
[4]. Pop mart (no date) “Pop mart’s 2021 interim report.” Pop mart international group limited.
[5]. Pop mart (no date) “Pop mart’s 2022 interim report.” Pop mart international group limited.
[6]. Pop mart (no date) “Pop mart’s 2021 annual report.” Pop mart international group limited.
[7]. MA Yuyan. Marketing strategy of bubble mart tide play blind box[J]. Cooperative Economy and Technology,2022,(17):74-75.
[8]. ZHANG Wenjia. Research on image shaping of "Bubble Mart" blind box cultural and creative brand[D].Yangzhou University,2022).
[9]. TAO Hongyu,ZHANG Dalu. Analysis of the Path of the Rapid Rise of Teochew Play Brands under the Background of New Consumption: A Case Study of "POP MART Bubble Mart" Brand [J]. Hunan Packaging,2022,37(05):25-27+141.