


1. Introduction
The unexpected emergence of COVID-19, also referred to as novel coronavirus pneumonia, caught the world off guard from the end of 2019. This sudden and unforeseeable pandemic not only jeopardized global public health but also heightened the risks faced by financial markets, impacting economies worldwide [1]. The stock market, an integral component of the financial market, assumes a crucial role in global economic advancement and has experienced noteworthy fluctuations [2].
During the month of March, the U.S. stock market encountered four intermittent circuit breakers [3], while European markets witnessed a widespread sell-off [4]. Consequently, the stock market represents a substantial channel for transmitting risks within the U.S. financial market. This emphasizes the utmost significance of managing such risk transmission effectively and upholding stability within the stock market. Notably, the performance of the stock market serves as a mirror, reflecting the sentiments and expectations of investors regarding the future prospects of companies and the overarching state of the economy. In the context of COVID-19, these sentiments were marked by uncertainty and apprehension, leading to a volatile market landscape. Under normal circumstances, accurately predicting changes in stock prices is of significant economic and social value. However, amidst the COVID-19 crisis, this task became even more challenging due to the complex interplay of various factors, not least of all the pervasive impacts of the pandemic. The influence of the pandemic on consumer behavior, government policy, and global supply chains, among other elements, have added new layers of complexity to the prediction and understanding of stock market trends.
The initial investigations into stock analysis often underestimated the potential of trading data in making future predictions. Subsequent research endeavors sought to extract patterns from historical data but encountered difficulties in dealing with non-stationary data patterns. The limitations of traditional time series models in capturing the influence of investor psychology and emotions on the stock market became evident with the emergence of behavioral finance theory. Because of the complex interactions between these components, it is still difficult to predict the direction of the stock market with any degree of accuracy, which leads to inaccurate stock price forecasting.
Researchers have greatly benefited from the creation of prediction models thanks to machine learning techniques [5]. For instance, Hegazy et al. created a hybrid model that combines the Particle Swarm Optimization (PSO) method and the Least Squares Support Vector Machine (LS-SVM) model [6]. The technique makes use of the benefits of both systems in an effort to increase the accuracy of stock price prediction. Usmani et al. created a stock price forecasting model utilizing artificial neural networks (ANN) and the support vector machine (SVM) algorithm in a manner similar to this [7]. The research focuses on capturing the underlying patterns and linkages that drive stock price movements by training the model using historical data. Fatima et al. used ANN with the statistical method Autoregressive Integrated Moving Average (ARIMA) in a different study to predict stock prices [8]. Their study tries to find trends and patterns in stock market activity by analyzing data spanning over three years. When it comes to forecasting stock values during particular events or crises, there is still a sizable research gap despite the advancements achieved in the sector. World-shattering COVID-19 pandemic outbreak had a massive impact on financial markets, especially the stock market. The enormous global health crisis had a significant impact on economies around the world and presented unique challenges for accurate stock price forecasting. Due to the lack of focus given to using machine learning approaches for stock price prediction during the period of COVID-19 pandemic, this study aims to address a research gap and offer insight on the dynamics of stock market behavior during crisis situations. By adding essential features and statistics that highlight the specific impact of the pandemic on financial markets, the study aims to enhance the understanding of how the stock market responds to extraordinary occurrences and generate more precise estimates of stock prices.
This study will look into the employment of a variety of machine learning methods, such as decision trees, random forests, and Long Short-Term Memory (LSTM) models, to forecast stock market behavior in the context of the COVID-19 pandemic. Through a comprehensive assessment and comparison of these models, the primary focus of this study will be on employing LSTM as the leading model for accurate stock price predictions, aiming to enhance prediction accuracy during this unprecedented crisis period. This project aims to support the creation of efficient and reliable models for predicting stock prices during the COVID-19 pandemic by performing in-depth analyses and comparisons of various machine learning techniques. The insights derived from this study will not only deepen the understanding of stock market behavior during crises but also provide practical implications for investors, financial institutions, and policymakers, enabling them to make well-informed decisions in times of uncertainty and volatility.
2. Methodology
2.1. Dataset Preperation
In order to examine the influence of COVID-19 on the stock market, dataset of stock prices of Google Company is selected from March 11, 2020, to September 12, 2022, utilizing [9]. The data distribution related to the open and close, high and low, close and mean average price of the stock are shown in Figure 1.
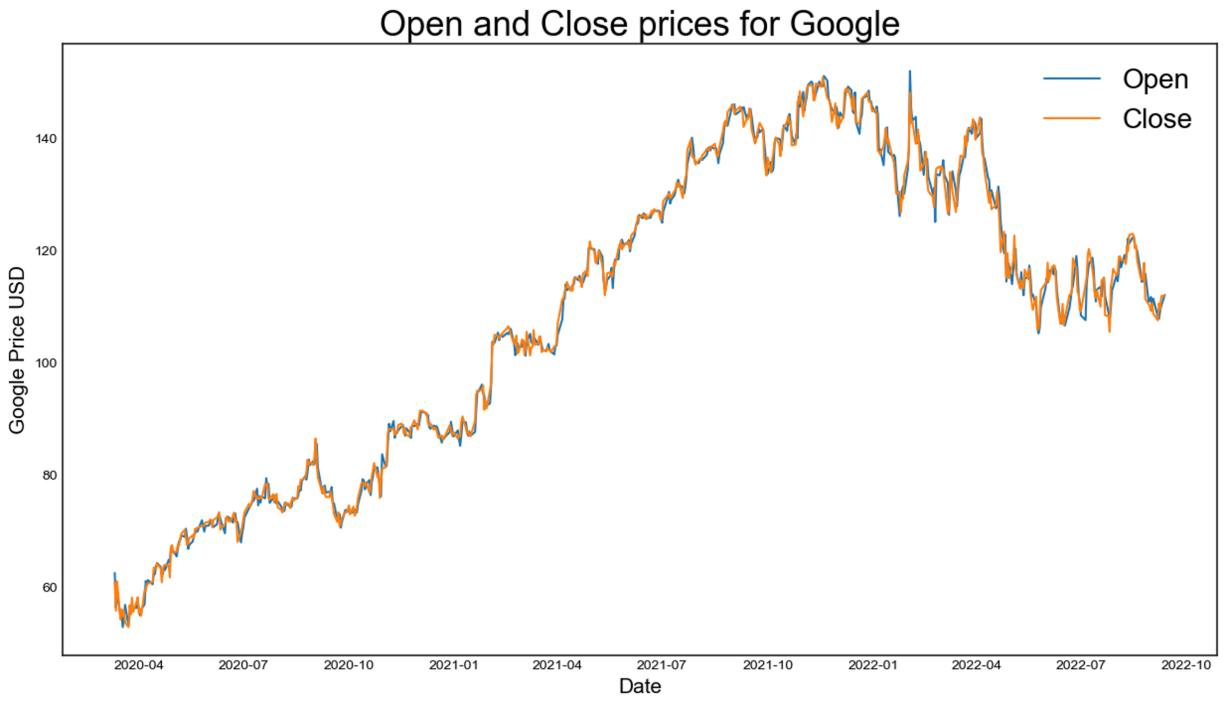
(a)
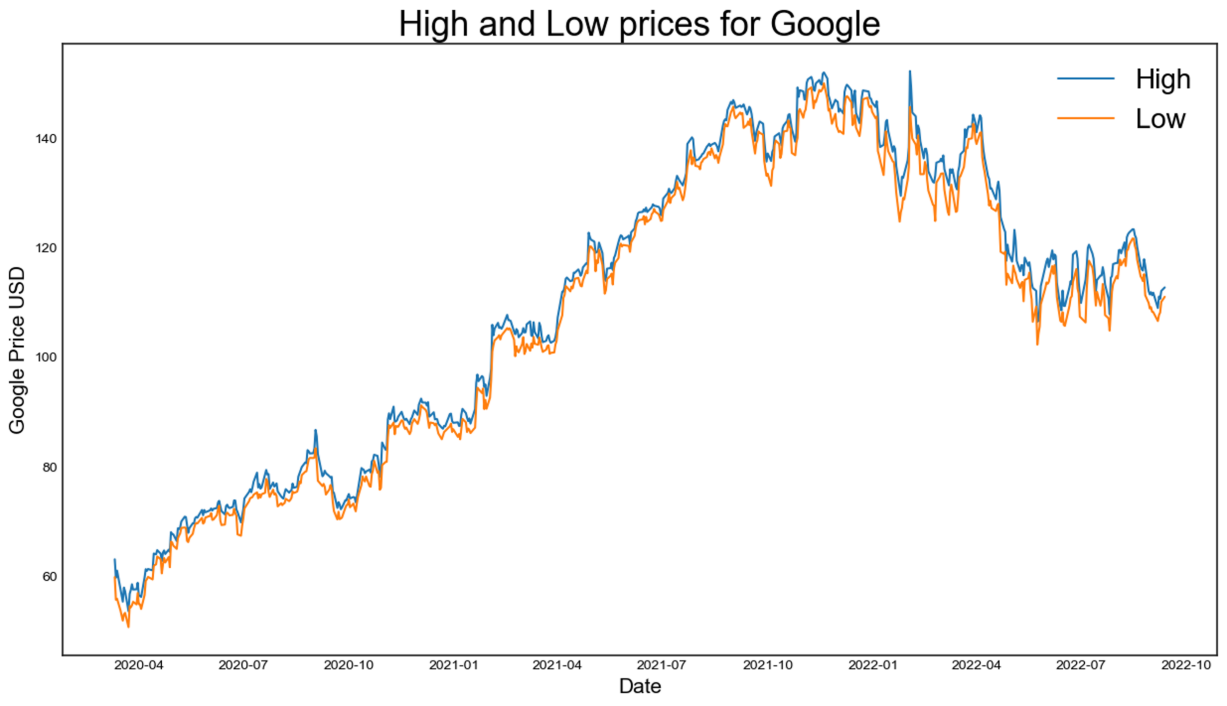
(b)
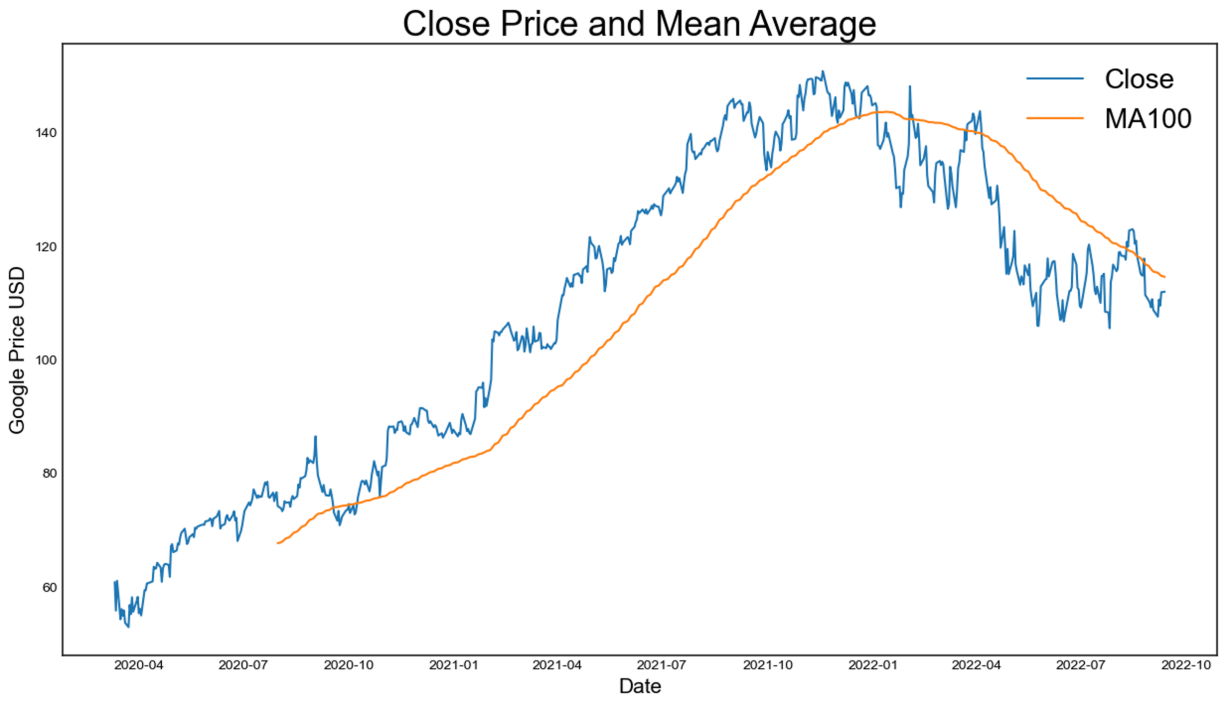
(c)
Figure 1: The data distribution of the stock price (photo/picture credit: original).
2.2. Machine Learning Models
2.2.1. Decision Tree
A well-liked supervised machine learning model for prediction is the decision tree. It builds a model that resembles a tree, with leaf nodes representing the outcomes or forecasts and inside nodes representing decisions depending on particular criteria.
During training, the decision tree algorithm learns from labeled data, where each data point has a known outcome or class. By recursively splitting the data based on various attributes, the algorithm seeks to optimize the homogeneity or purity of resulting subsets [10]. Until specific stopping requirements, such as a maximum tree depth or a minimum leaf size, are satisfied, this iterative process is continued. The decision tree can be used to predict outcomes for fresh, untested data once it has been trained. Based on the values of the input characteristics, the tree is investigated from the root to a leaf node. Based on the outcome associated with the leaf node reached, the forecast is made.
2.2.2. Random Forest
Random Forest is also a prevalent machine learning algorithm that combines several decision trees to produce precise predictions [11]. When working with complicated datasets from multiple disciplines, this technique performs especially well. A collection of decision trees is built in a Random Forest model, each trained on a randomly chosen sample of the training data. This strategy improves the model's performance and generalization abilities while reducing over-fitting [12].
Each decision tree individually gains the ability to forecast the target variable during the training process using various feature subsets, taking into account randomization in both the data and feature selection. Random Forest generates a final prediction by combining the findings from various trees. This ensemble approach not only increases precision but also sheds light on the relative weight that various features have during the prediction process [13].
2.2.3. LSTM
A memory cell unit is included into the Long Short-Term Memory (LSTM), an improved kind of recurrent neural network (RNN), to preserve long-term states [14]. It tackles the issues of vanishing and exploding gradients in standard RNNs by incorporating a forgetting gate, an input gate, and an output gate. These gates work together to control the retention and forgetting of information, effectively resolving the problems associated with gradient disappearance and explosion in RNNs [15, 16].
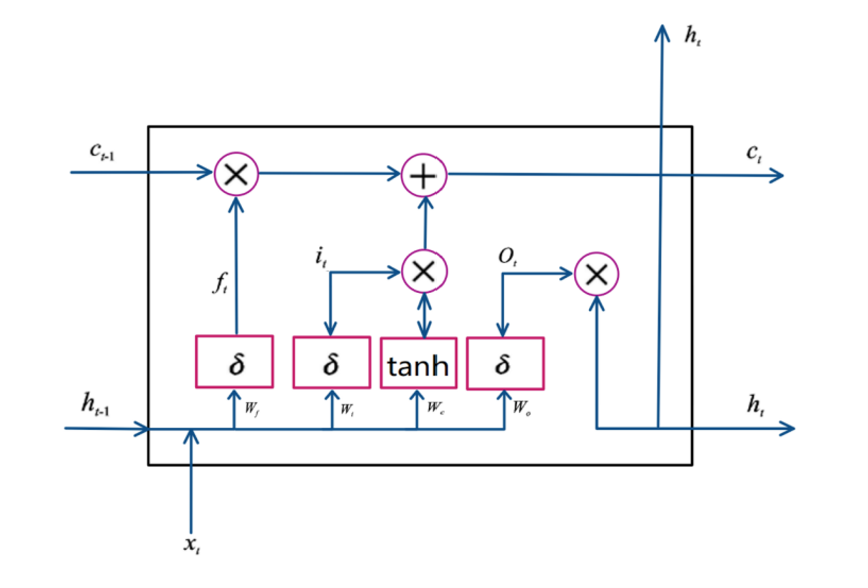
Figure 2: LSTM unit structure (photo/picture credit: original).
As is shown in Figure 2, the input and output at time t are, respectively, \( {x_{t}} \) , and \( { h_{t}} \) . The LSTM unit's output at time t is \( {H_{t-1}} \) . The output of the memory cell unit at time T is \( {c_{t-1}} \) .
The degree to which information is preserved or discarded in the memory cell \( {c_{t}} \) at a given moment is determined by the forgetting gate, which is represented in Formula (1).
\( {f_{t}}=σ({W_{fh}}{h_{t-1}}+{W_{fx}}{x_{t}}+{b_{f}}) \) (1)
The amount of information preserved in the memory cell \( {c_{t}} \) , at the current moment is determined by the input gate, as depicted in Formula (2).
\( {i_{t}}=σ({W_{it}}{h_{t-1}}+{W_{ix}}{x_{t}}+{b_{i}}) \) (2)
The equation that represents the constitutive expression of the candidate memory cell unit, \( c_{t}^{ \prime } \) , at the current moment is given by Formula (3).
\( c_{t}^{ \prime }=tanh({W_{ch}}{h_{t-1}}+{W_{cx}}{x_{t}}+{b_{c}}) \) (3)
The memory cell, represented by \( {c_{t}} \) , is updated at the current moment by combining the previous moment's value \( {c_{t-1}} \) with the addition of the candidate memory cell unit \( c_{t}^{ \prime } \) , weighted by the forget gate value \( {f_{t}} \) . This update structure is illustrated in Formula (4).
\( {c_{t}}={f_{t}}⊙{c_{t-1}}+{i_{t}}⊙c_{t}^{ \prime } \) (4)
The output gate determines the output value \( ht \) of the current memory cell \( {c_{t}} \) to the current hidden layer, as shown in Formula (5).
\( {o_{t}}=σ({W_{oh}}{h_{t-1}}+{W_{ox}}{x_{t}}+{b_{o}}) \) (5)
The final output is obtained by processing the memory cell \( {c_{t}} \) through a hyperbolic tangent ( \( tanh \) ) function and multiplying it by the output gate \( {o_{t}} \) , as demonstrated in Formula (6).
\( {h_{t}}={o_{t}}⊙tanh({c_{t}}) \) (6)
The forgetting gate, input gate, and output gate of the hidden layer \( {h_{t-1}} \) at the preceding time step are represented by the weight matrices \( {W_{fh}} \) , \( {W_{ih}} \) , and \( {W_{oh}} \) , respectively. Similar to this, the forgetting gate, input gate, and output gate connected to the input vector \( { x_{t}} \) are represented by the weight matrices \( {W_{fx}} \) , \( {W_{ix}} \) , and \( {W_{ox}} \) . Parameters \( {b_{f}} \) , \( {b_{i}} \) , \( {b_{c}} \) , and \( {b_{o}} \) are bias terms that apply the sigmoid function \( σ \) , while \( ⊙ \) denotes element-wise multiplication. The activation function \( tanh \) represents the hyperbolic tangent function.
During the training phase, the weights between neurons in all layers of the LSTM are adjusted through training on extensive data. This training process aims to minimize the error function and bring it within an acceptable range, allowing the neural network to effectively learn from the provided data.
2.3. Evaluation Criteria
By assessing the predictive abilities of different models, it is convenient to determine which model is more accurate, reliable, and suitable for the specific task [17]. This paper will introduce three important evaluation criteria for use in comparing the performance of different models and choosing the one that best fits the problem at hand.
2.3.1. RMSE
The root mean square error (RMSE) estimator can be obtained by taking the square root of the average of the squared discrepancies between the observed values and the projected or expected values. It provides a clue as to how frequently the anticipated values diverge from the actual values. The RMSE estimator is extensively employed as a performance measure to evaluate the accuracy and appropriateness of a model's fit. Formula (7) for calculating RMSE estimator is as follows:
\( RMSE=\sqrt[]{\frac{1}{n}\sum _{i=1}^{n}{({y_{i}}-\hat{{y_{i}}})^{2}}} \) (7)
Where \( n \) refers to number of observations, \( {y_{i}} \) denotes the observed value, \( \hat{{y_{i}}} \) denotes the predict value.
2.3.2. R2
A regression model's suitability for simulating the observed data can also be determined using the R-squared ( \( {R^{2}} \) ) test. It measures the percentage of the dependent variable's overall variance that the independent variables can account for [18]. By comparing the sum of squared residuals (the discrepancies between predicted and actual values to the total sum of squares of the dependent variable), it assesses the model's goodness-of-fit. The following is the formula (8) for calculating \( {R^{2}} \) :
\( {R^{2}}=1-\frac{S{S_{residual}}}{S{S_{total}}}=1-\frac{\sum _{i=1}^{n}{({y_{i}}-\hat{{y_{i}}})^{2}}}{\sum _{i=1}^{n}{({y_{i}}-\bar{{y_{i}}})^{2}}} \) (8)
Where \( \bar{{y_{i}}} \) denotes the mean of the observed values. A higher \( {R^{2}} \) value suggests that the model possesses a greater capacity to comprehend and forecast the dependent variable based on the independent variables.
2.3.3. Cross Validation
A useful approach for evaluating how well a model performs and generalizes to new data is cross-validation. The way it works is by dividing the available data set into different folds or subsets [19]. Each fold alternately acts as a training set and a validation set during numerous iterations. The validation set is used to evaluate the model's performance after it has been developed using the training set. All folds are subjected to this iterative procedure, and the outcomes are pooled to produce an overall performance metric [20]. A thorough assessment of the model's performance and generalizability can be obtained by utilizing cross-validation.
2.4. Implementation Details
2.4.1. Decision Tree and Random Forest
In both scenarios, training uses 80% of the data while testing uses 20% of the data. The random forest's 100 decision trees and 42 random seeds are both predetermined.
2.4.2. LSTM
In this specific scenario, the focus is on predicting Google's "High" stock prices. The structure of the LSTM model chosen for this task includes an LSTM layer of 50 units. This layer's output is subjected to a non-linear transformation through a Dense layer composed of 25 units. Subsequently, this transformed output is fed into a Dense layer with a single unit, which is responsible for generating the prediction for the "High" price. For sequence processing, the LSTM employs a step size of 2 and utilizes the Rectified Linear Unit (ReLU) as its activation function.
The training procedure for this model entails a total of 100 epochs. A complete cycle of data traveling both forward and backward through the neural network is referred to as an epoch in this context. The data is divided into batches of 100 samples within each epoch, following which the model's weights are revised.
The performance of the model is evaluated using the Mean Squared Error (MSE) loss function. This function is frequently used for regression jobs since it computes the average of squared differences between predicted and actual values. The model additionally modifies its weights during training using the Adam optimizer.
3. Results and Discussion
The performance of diverse models evaluated by various estimation criteria was shown in Table 1 below.
Table 1: Performance of each model.
Model
| Decision Tree | Random Forest | LSTM | |
RMSE | 0.937 | 0.752 | 0.584 | |
\( {R^{2}} \) | 0.998 | 0.999 | 0.832 | |
\Cross-validation mean RMSE | 2.993 | 2.918 | 2.209 | |
Cross-validation standard deviation RMSE | 1.835 | 2.006 | 0.553 |
When the results from the three models—decision tree, random forest, and LSTM—are analyzed, interesting trends about their performance become apparent. Competitive RMSE values of 0.937 and 0.752 for the decision tree and random forest models, respectively, reveal negligibly different predicted and actual values. However, the extraordinarily high \( {R^{2}} \) values (0.998 and 0.999) suggest that these models may have relatively promising prediction.
This overfitting issue is further corroborated by the high values of cross-validation RMSE mean (2.993 and 2.918) and standard deviation (1.835 and 2.006) for decision tree and random forest models respectively.
Conversely, the LSTM model emerges as the standout performer. With a lower RMSE of 0.584, the LSTM model suggests a smaller prediction error. Its lower \( {R^{2}} \) score of 0.832, although seemingly less impressive than its counterparts, actually indicates a healthier model fit to the data. The model is not overfitting to the extent observed in the decision tree and random forest models, which is a promising sign of its generalization ability. Moreover, the LSTM model's cross-validation RMSE mean (2.209) and standard deviation (0.553) are both considerably lower, further attesting to its superior predictive performance on unseen data.
In this situation of stock price prediction, the LSTM model's inherent capacity to capture temporal dependencies in time-series data is especially helpful. As seen in Figure 3, it is capable of handling the stock market's volatile character. The LSTM model's forecasts closely match the price trajectory's actual course, illuminating the erratic pattern and general downward trend during the difficult pandemic time.
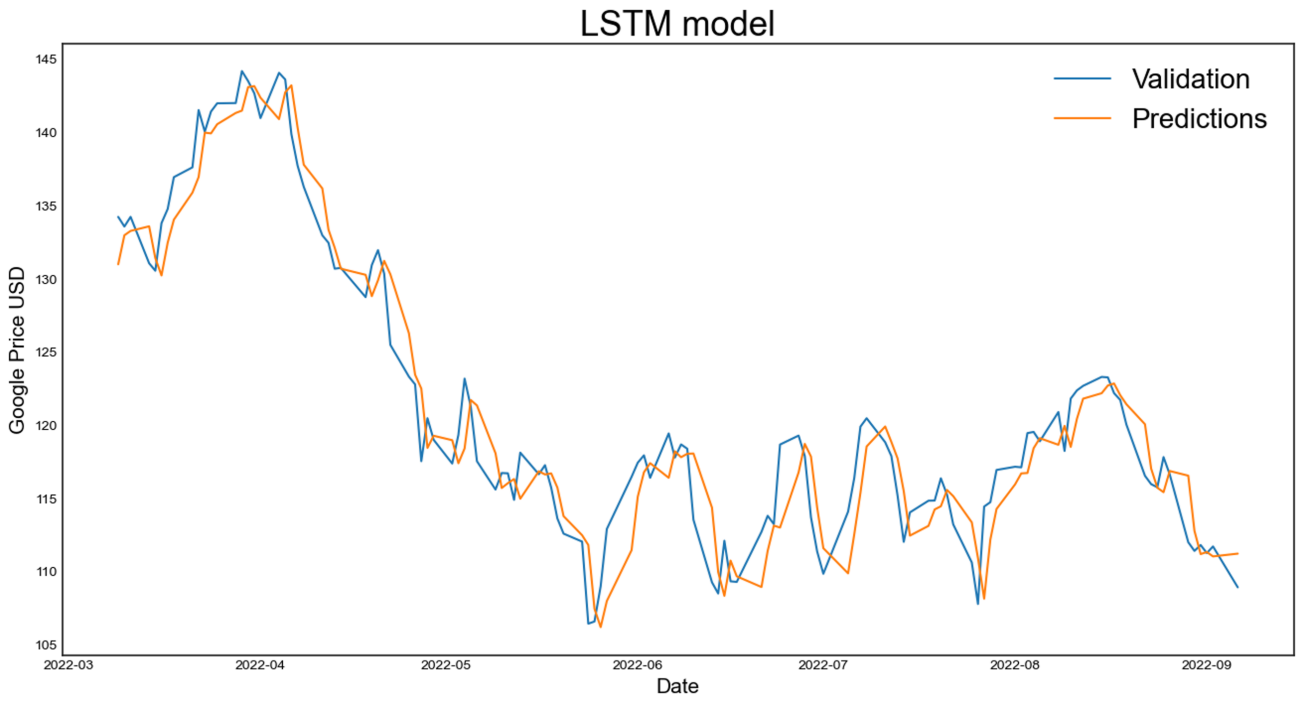
Figure 3: The predicted result based on LSTM model (photo/picture credit: original).
4. Conclusion
Under the specific condition of the COVID-19 pandemic, three prevalent machine learning techniques - decision tree, random forest, and LSTM - were examined for predicting stock prices, yielding favorable outcomes. Each model showcased unique qualities in their prediction performances.
Considering the volatile nature of markets during the pandemic, the decision tree and random forest models initially appeared promising. However, further analysis revealed potential overfitting issues, suggesting limited generalization to unseen data. In contrast, the LSTM model demonstrated better generalization and a healthier model fit, making it the most suitable choice. Due to the unprecedented impact of COVID-19 on stock markets, the LSTM was determined to be the most accurate model for predicting stock values in this situation. Its precise forecasts closely tracked the price trajectory, demonstrating its remarkable accuracy even in these trying times.
The successful application of the LSTM model underscores the importance of model selection under unique circumstances like the COVID-19 pandemic. Future research could explore variations in step length and investigate models with stronger time sequence capabilities, such as GRU and Adaboost, to further enhance the accuracy of stock price trend predictions in the evolving field of financial forecasting.
References
[1]. Mazur, M., Dang, M., & Vega, M. (2021). Covid-19 and the March 2020 stock market crash: Evidence from S&P1500. Finance Research Letters, 38, 101690.
[2]. Ramelli, S., & Wagner, A. (2020). What the stock market tells us about the consequences of covid-19: Mitigating the COVID Economic Crisis: Act Fast and Do Whatever, 63.
[3]. Zhang, D., Hu, M., & Ji, Q. (2020). Financial markets under the global pandemic of covid-19. Finance Research Letters, 36, 101528.
[4]. Khattak, M. A., Ali, M., & Rizvi, S. A. R. (2021). Predicting the European stock market during covid-19: A machine learning approach. MethodsX, 8, 101198.
[5]. Mair, C., Kadoda, G., Lefley, M., Phalp, K., Schofield, C., Shepperd, M., & Webster, S. (2000). An investigation of machine learning based prediction systems. Journal of Systems and Software, 53(1), 23-29.
[6]. Ribeiro, G. T., Santos, A. A. P., Mariani, V. C., & Coelho, L. D. S. (2021). Novel hybrid model based on echo state neural network applied to the prediction of stock price return volatility. Expert Systems with Applications, ISSN 0957-4174.
[7]. Elgammal, M., Salama, K., & Mohieldin, A. (2019). A Comparison of Artificial Neural Network (ANN) and Support Vector Machine (SVM) Classifiers for Neural Seizure Detection, 646-649.
[8]. Lee, Y.-S., & Tong, L.-I. (2011). Forecasting time series using a methodology based on autoregressive integrated moving average and genetic programming. Knowledge-Based Systems, 24(1), ISSN 0950-7051.
[9]. https://www.kaggle.com/datasets/anubhavgoyal10/google-stock-prices-since-the-pandemic-started
[10]. Charbuty, B., & Abdulazeez, A. (2021). Classification based on decision tree algorithm for machine learning. Journal of Applied Science and Technology Trends, 2(01), 20-28.
[11]. Biau, G., & Scornet, E. (2016). A random forest guided tour. Test, 25, 197-227.
[12]. Segal, M. R. (2004). Machine learning benchmarks and random forest regression.
[13]. Reis, I., Baron, D., & Shahaf, S. (2018). Probabilistic random forest: A machine learning algorithm for noisy data sets. The Astronomical Journal, 157(1), 16.
[14]. Yu, Y., Si, X., Hu, C., & Zhang, J. (2019). A review of recurrent neural networks: LSTM cells and network architectures. Neural Computation, 31(7), 1235-1270.
[15]. Staudemeyer, R. C., & Morris, E. R. (2019). Understanding LSTM – a tutorial into long short-term memory recurrent neural networks. arXiv preprint arXiv:1909.09586.
[16]. Sherstinsky, A. (2020). Fundamentals of recurrent neural network (RNN) and long short-term memory (LSTM) network. Physica D: Nonlinear Phenomena, 404, 132306.
[17]. Noorian, A. M., Moradi, I., & Kamali, G. A. (2008). Evaluation of 12 models to estimate hourly diffuse irradiation on inclined surfaces. Renewable Energy, 33(6), 1406-1412.
[18]. Yi, Q., Wang, F., Bao, A., & Jiapaer, G. (2014). Leaf and canopy water content estimation in cotton using hyperspectral indices and radiative transfer models. International Journal of Applied Earth Observation and Geoinformation, 33, 67-75.
[19]. Berrar, D. (2019). Cross-validation.
[20]. Picard, R. R., & Cook, R. D. (1984). Cross-validation of regression models. Journal of the American Statistical Association, 79(387), 575-583.
Cite this article
Wang,Z. (2023). Google’s Stock Price in Covid-19: An Exploration of Machine Learning Techniques for Prediction. Advances in Economics, Management and Political Sciences,46,233-241.
Data availability
The datasets used and/or analyzed during the current study will be available from the authors upon reasonable request.
Disclaimer/Publisher's Note
The statements, opinions and data contained in all publications are solely those of the individual author(s) and contributor(s) and not of EWA Publishing and/or the editor(s). EWA Publishing and/or the editor(s) disclaim responsibility for any injury to people or property resulting from any ideas, methods, instructions or products referred to in the content.
About volume
Volume title: Proceedings of the 2nd International Conference on Financial Technology and Business Analysis
© 2024 by the author(s). Licensee EWA Publishing, Oxford, UK. This article is an open access article distributed under the terms and
conditions of the Creative Commons Attribution (CC BY) license. Authors who
publish this series agree to the following terms:
1. Authors retain copyright and grant the series right of first publication with the work simultaneously licensed under a Creative Commons
Attribution License that allows others to share the work with an acknowledgment of the work's authorship and initial publication in this
series.
2. Authors are able to enter into separate, additional contractual arrangements for the non-exclusive distribution of the series's published
version of the work (e.g., post it to an institutional repository or publish it in a book), with an acknowledgment of its initial
publication in this series.
3. Authors are permitted and encouraged to post their work online (e.g., in institutional repositories or on their website) prior to and
during the submission process, as it can lead to productive exchanges, as well as earlier and greater citation of published work (See
Open access policy for details).
References
[1]. Mazur, M., Dang, M., & Vega, M. (2021). Covid-19 and the March 2020 stock market crash: Evidence from S&P1500. Finance Research Letters, 38, 101690.
[2]. Ramelli, S., & Wagner, A. (2020). What the stock market tells us about the consequences of covid-19: Mitigating the COVID Economic Crisis: Act Fast and Do Whatever, 63.
[3]. Zhang, D., Hu, M., & Ji, Q. (2020). Financial markets under the global pandemic of covid-19. Finance Research Letters, 36, 101528.
[4]. Khattak, M. A., Ali, M., & Rizvi, S. A. R. (2021). Predicting the European stock market during covid-19: A machine learning approach. MethodsX, 8, 101198.
[5]. Mair, C., Kadoda, G., Lefley, M., Phalp, K., Schofield, C., Shepperd, M., & Webster, S. (2000). An investigation of machine learning based prediction systems. Journal of Systems and Software, 53(1), 23-29.
[6]. Ribeiro, G. T., Santos, A. A. P., Mariani, V. C., & Coelho, L. D. S. (2021). Novel hybrid model based on echo state neural network applied to the prediction of stock price return volatility. Expert Systems with Applications, ISSN 0957-4174.
[7]. Elgammal, M., Salama, K., & Mohieldin, A. (2019). A Comparison of Artificial Neural Network (ANN) and Support Vector Machine (SVM) Classifiers for Neural Seizure Detection, 646-649.
[8]. Lee, Y.-S., & Tong, L.-I. (2011). Forecasting time series using a methodology based on autoregressive integrated moving average and genetic programming. Knowledge-Based Systems, 24(1), ISSN 0950-7051.
[9]. https://www.kaggle.com/datasets/anubhavgoyal10/google-stock-prices-since-the-pandemic-started
[10]. Charbuty, B., & Abdulazeez, A. (2021). Classification based on decision tree algorithm for machine learning. Journal of Applied Science and Technology Trends, 2(01), 20-28.
[11]. Biau, G., & Scornet, E. (2016). A random forest guided tour. Test, 25, 197-227.
[12]. Segal, M. R. (2004). Machine learning benchmarks and random forest regression.
[13]. Reis, I., Baron, D., & Shahaf, S. (2018). Probabilistic random forest: A machine learning algorithm for noisy data sets. The Astronomical Journal, 157(1), 16.
[14]. Yu, Y., Si, X., Hu, C., & Zhang, J. (2019). A review of recurrent neural networks: LSTM cells and network architectures. Neural Computation, 31(7), 1235-1270.
[15]. Staudemeyer, R. C., & Morris, E. R. (2019). Understanding LSTM – a tutorial into long short-term memory recurrent neural networks. arXiv preprint arXiv:1909.09586.
[16]. Sherstinsky, A. (2020). Fundamentals of recurrent neural network (RNN) and long short-term memory (LSTM) network. Physica D: Nonlinear Phenomena, 404, 132306.
[17]. Noorian, A. M., Moradi, I., & Kamali, G. A. (2008). Evaluation of 12 models to estimate hourly diffuse irradiation on inclined surfaces. Renewable Energy, 33(6), 1406-1412.
[18]. Yi, Q., Wang, F., Bao, A., & Jiapaer, G. (2014). Leaf and canopy water content estimation in cotton using hyperspectral indices and radiative transfer models. International Journal of Applied Earth Observation and Geoinformation, 33, 67-75.
[19]. Berrar, D. (2019). Cross-validation.
[20]. Picard, R. R., & Cook, R. D. (1984). Cross-validation of regression models. Journal of the American Statistical Association, 79(387), 575-583.