


1 Introduction
On 23 June 1894, Coubertin and 79 delegates from 12 countries decided to establish the International Olympic Games, and today, a hundred years later, the Games have become a universal festival and the Olympic Games have attracted the active participation of 202 countries and territories. Since its inception, the modern Olympic movement has been cautious about its commercial attributes. But because of its unique attributes, it cannot exist independently of the economy, and its overall operation and development cannot be achieved without economic support but is also influenced and constrained by it. Since the 1980s, the commercialization of the Olympic Games has become clearer and the economic value of the Games has become increasingly evident, with Beijing winning the right to host the XXIV Olympic Winter Games in 2022 on 31 July 2015. The successful bid to host the Beijing Winter Olympic Games brought a sense of national pride, while also inspiring us to consider the economic benefits it would bring to study.
The successful bid for the 2022 Beijing Winter Olympics has once again brought snow and ice sports, which are known as "noble sports" in developed countries, into the public eye. This paper also notes that the successful bid for the Beijing Winter Olympics has greatly accelerated the pace of economic and industrial modernization in the Beijing region and the country, as the “City of Two Olympics”. Previous research results on the economic benefits of the Olympic Games and the Winter Olympics have been abundant, but they are generally scattered, with few relevant links and generalities, and are mostly direct theoretical summaries, lacking a complete data modelling process, which to a certain extent has led to a lack of rigor and systematization in the research results. This paper explains how the five years following the success of the Beijing Winter Olympics bid had a significant impact on the CPI in three parts: a theoretical analysis of the underlying data, the economic impact of the successful bid, and a summary of the conclusions. Based on the experience and lessons learned from the previous Winter Olympic Games, and with reference to the relevant data and studies on the 2022 Winter Olympic Games, the thesis proposes a rational and objective view of the economic impact of the 2022 Beijing Winter Olympic Games in the context of the "siphon effect" and the "post-epidemic era". The paper suggests that it is important to take full advantage of the historical opportunities brought about by the Winter Olympics and to improve the overall economic performance of the country. In the work used two regression models, least squares regression and breakpoint regression, as well as literature review and mathematical statistics to collect data on the independent variables such as investment in infrastructure, cultural tourism and sports expenditure, international tourism income, the number of stadiums built and the number of time dummies for the 2022 Beijing Olympic Winter Games, and focused on GDP, CPI and per capita income. The conclusion is that the impact of a successful bid for the 2022 Beijing Olympic Winter Games on GDP and per capital income is not significant, but the impact on CPI is more significant through the three channels of cultural and sports expenditure, international tourism income and stadium construction.
Overall, this paper analyses the overall economic indices following the success of the Winter Olympics bid based on the available literature and provides research ideas for future studies to further explore the far-reaching impact of the Beijing Winter Olympics on the economy as well as social life.
2 Literature Review
2.1 The Development History of Olympic Games
Before analyzing the effect of Olympic Games on economy and social lives, the work firstly needs to trace the origin and review the development history of Olympic Games. Only when get familiar with the whole process of Olympic Games can this work have a better command of its meanings and influences, thus helping this paper analyzing its consequences. In fact, several researchers have already accomplished certain work. For example, Toohey made a brief introduction of Olympic Games from the perspective of social science. They traced back to ancient Olympics, introduced the relationship between politics and athletics, and described how this mega event with political signal initially turned into an entertainment competition with participation of the whole world, which is the form of modern Olympic Games [1]. Similar research was done by Chai. They discussed the characteristics and development of Olympic systems from the angle of self-organization and others-organization and made predictions that in the future Olympic Games will enter chaos-condition [2].
2.2 The Effect of Olympic Games on Economy
After looking back on the development history of Olympics, the paper can set about reviewing literatures about the impact of Olympic Games on economy and social lives. There have been several researchers concentrating on this topic with significant results. For instance, Madden tried to estimate the economic effects of Sydney Olympics in 2000, using a multiregional computable general equilibrium (CGE) model to simulate potential consequences. Their results show that the Sydney Olympics would have a significantly positive effect on the New South Wales and Australian economies, while the gains within the New South Wales would be extremely small [3]. Owen also did similar research with evidence of Beijing Olympics in 2008. They used budget data to make simulations instead of CGE model and drew conclusion that China would have more gains from tourism and investment in consideration of the intensive-labor advantage in China [4]. Besides, with recent holding of Beijing Winter Olympics, more and more researchers try to make predications of its influences. Gu claimed that annual GDP will rise 2.1% with the holding of Winter Olympics [5], and Hu pointed out that the successful bid for Beijing Winter Olympics would have a positive effect on improving the industrial transformation and upgrading of Beijing-Tianjin-Hebei region and improving the quality of atmosphere and environment [6].
In addition, there exists some research focusing on macro-analysis of the effects of Olympics. They aim to calculate the benefits and costs of Olympic Games in all kinds of dimensions in order to measure the influence of Olympics more comprehensively and precisely. For example, Kiki Kaplanidou and Kostas Karadakis proposed that the holding of Olympics is closely related to “significant public expenditure, the building of facilities and infrastructure, urban rejuvenation, and revival objectives, which have favorable or unfavorable lasting consequences for public stake- holders”. They tried to put more details in measuring the real legacies after holding the Olympics and found out that the legacies are highly correlated with investment, consumption, education and governance, more prevalent than expected [7]. Different from the research of Kiki Kaplanidou and Kostas Karadakis, Porter examined the impact of Olympics with combination of ex ante predictions and ex poste reality. Their conclusion indicated that the input-output model will incorrectly attribute economic effects to final demand changes if certain effects are solely dependent on prices with just one or a few sectors, thereby changing real economic influences when there is none [8].
In conclusion, previous literatures have made great contributions to examining the effects of Olympic Games on economy and social lives by empirical analysis or by description of history development. The work aims to explore the influences of Beijing Winter Olympic Games on economics and social lives based on experiences of available literatures.
3 Data
To analyze the impact of Beijing’s successful bid for the winter Olympic Games on the local economy and society, four independent variables and three dependent variables are chosen to accurately deduce the economic trend. All the variables are displayed in table 1.
Table 1. The classification of variables.
Variable | Indicator | Meaning |
Explained variable | GDP | Gross domestic product |
income | Residential income per capita | |
CPI | Consumer price index | |
Explanatory variable | infra | Total investment of infrastructure construction |
culexpen | Total expenditures of local culture and sports | |
interincome | Total income of international travel | |
sport | The number of sports facilities |
To measure the local economic level, we use GDP, residential income per capita and CPI to reflect the level of local economic growth, the level of disposal income and the level of ordinary consumption respectively. As for the factors connected to the bid for Beijing Winter Olympic Games, this paper tries to use infrastructure investment, cultural and athletic expenditures, international travel income and the number of sports venues as explanatory variables to greatly measure the changes caused by Winter Olympics. In specific, the work can use table 2 to observe data of these variables clearly:
Table 2. The descriptive statistic results of variables.
Variable | Obs | Mean | Std.Dev | Min | Max |
GDP | 11 | 25599.55 | 7340.73 | 14964.00 | 36102.60 |
income | 11 | 49300.82 | 13799.27 | 29228.00 | 69434.00 |
CPI | 11 | 102.53 | 1.20 | 101.40 | 105.60 |
infra | 11 | 2130.16 | 509.90 | 1400.20 | 2984.20 |
culexpend | 11 | 179.27 | 62.12 | 79.36 | 279.32 |
interincome | 11 | 46.37 | 14.09 | 4.80 | 55.20 |
sport | 11 | 22512.55 | 11824.26 | 6151 | 38600 |
All data are obtained from Beijing Statistics Bureau from 2010 to 2020. The paper chooses yearly data from certain period in order to observe the changes before and after 2015, when the Beijing Winter Olympic Games was successfully bid. After making great preparations for data selection, the paper can set about establishing our regression model.
4 Empirical Analysis
4.1 Regression Discontinuity Design
This paper uses regression discontinuity design (RDD) to set up our model and test the effects of holding Beijing Winter Olympics on economic and social life. The regression discontinuity design means that there exists a continuous variable determining the probability of policy intervention for everyone on both sides of a critical point. This variable is called assignment variable, and it could be used to divide all data into two groups and the differences between them could be observed. Compared to difference-in-difference (DID) method and instrumental variable (IV) method, RDD is more like quasi-experiment and exhibits more accurate outcomes. Initially we need to define a treatment variable with the following assignment rules:
\( {D_{i}}=\begin{cases} \begin{array}{c} 1, if{ X_{i}}≥c \\ 0, if{X_{i}} \lt c \end{array} \end{cases}( SEQ "equation" \n \* MERGEFORMAT 1) \)
\( {D_{i}} \) is called treatment variable, \( { X_{i}} \) is called assignment variable and \( c \) is a constant. The linear regression model with RDD is shown as follows:
\( {Y_{i}}={β_{0}}+{β_{1}}{X_{i}}+{ϵ_{i}}( SEQ "equation" \n \* MERGEFORMAT 2) \)
\( {Y_{i}}={β_{0}}+{β_{1}}({X_{i}}-c)+{β_{2}}{D_{i}}+{β_{3}}({X_{i}}-c){D_{i}}+{ε_{i}}( SEQ "equation" \n \* MERGEFORMAT 3) \)
\( {Y_{i}} \) is called outcome variable, \( ({X_{i}}-c) \) is the standardization form of \( {X_{i}} \) that makes the cutoff equal to 0, and the interactive term \( ({X_{i}}-c){D_{i}} \) is to set different slopes of both sides between the cutoff. Then the local average treatment effect (LATE) can be calculated to measure the effects of \( {X_{i}} \) on \( {Y_{i}} \) , which equals to \( {β_{2}} \) .
\( LATE=E({Y_{1i}}-{Y_{oi}}|{X_{i}}=c)={β_{2}}( SEQ "equation" \n \* MERGEFORMAT 4) \)
4.2 Model
After introducing the key point of RDD, the paper could use it to establish models. The paper will test the effects of all variables related to holding Beijing Winter Olympics on GDP, residential income per capita and CPI. According to the principle of RDD, initially the work needs to define the treatment variable, which is the time point of successful bid for 2022 Beijing Winter Olympics in the model. The bidding time is 2015, then 2015 can be used as cutoff to define time dummy with the following rules:
\( D=\begin{cases} \begin{array}{c} 1, if T≥2015 \\ 0, if T \lt 2015 \end{array} \end{cases}( SEQ "equation" \n \* MERGEFORMAT 5) \)
This paper tries to use this dummy variable to observe the differences in GDP, residential income per capita and CPI before and after the successful bid for Beijing Winter Olympics. The preliminary regression models are established as follows:
\( {GDP_{i}}={α_{0}}+{α_{1}}(T-2015)+{α_{2}}D+{α_{3}}{infra_{i}}+{{α_{4}}{cul_{i}}+α_{5}}{inter_{i}}+{α_{6}}{spor_{i}}+{ε_{i}}\ \ \ ( SEQ "equation" \n \* MERGEFORMAT 6) \)
\( {Inc_{i}}={β_{0}}+{β_{1}}(T-2015)+{β_{2}}D+{β_{3}}{infra_{i}}+{{β_{4}}{cul_{i}}+β_{5}}{inter_{i}}+{β_{6}}{spor_{i}}+{ϵ_{i}}\ \ \ ( SEQ "equation" \n \* MERGEFORMAT 7) \)
\( {CPI_{i}}={γ_{0}}+{γ_{1}}(T-2015)+{γ_{2}}D+{γ_{3}}{infra_{i}}+{{γ_{4}}{cul_{i}}+γ_{5}}{inter_{i}}+{γ_{6}}{spor_{i}}+{μ_{i}}\ \ \ ( SEQ "equation" \n \* MERGEFORMAT 8) \)
Here are 6 explanatory variables in total: \( T-2015 \) , the standardization of time with cutoff equal to 0; \( D \) , the time dummy variable that has been defined above; \( {infra_{i}} \) , the infrastructure investment; \( {cul_{i}} \) , the cultural and athletic expenditures; \( {inter_{i}} \) , the international travel income, and \( {spor_{i}} \) , the number of sports venues. The 3 dependent variables are \( {GDP_{i}} \) , \( {Inc_{i}} \) and \( {CPI_{i}} \) , measuring GDP, residential income per capita and CPI respectively. And \( {ε_{i}} \) , \( {ϵ_{i}} \) and \( {μ_{i}} \) measure the error terms in the three regressions. As for the real effects of successful bidding for Winter Olympics on GDP, income per capita and CPI, they can be estimated with \( {α_{2}} \) , \( {β_{2}} \) and \( {γ_{2}} \) .
5 Results
5.1 Results of Basic Regression
Before analyzing the outcomes with RDD method, this paper examines the effects using basic models with OLS estimators. The purpose of that is to compare the results with different methods and find real effects with more unbiased and efficient estimators.
Table 3. The results of OLS regression.
Explanatory Variables | Explained Variables | ||
GDP | Inc | CPI | |
Infra | 1.770 (2.145) | 3.334 (4.039) | -0.001 (0.001) |
Cul | 61.144* (21.661) | 115.148* (40.792) | -0.006* (0.002) |
Inter | -118.373* (46.003) | -222.924* (86.634) | 0.011* (0.004) |
Sport | 0.118 (0.135) | 0.222 (0.254) | -0.001 (0.001) |
time | 1587.441 (1640.747) | 2989.518 (3089.943) | -0.144 (0.149) |
Prob (F-statistics) | 0.001 | 0.000 | 0.000 |
R-squared | 0.969 | 0.985 | 0.985 |
Adjusted R-squared | 0.938 | 0.969 | 0.969 |
From table 3, the results find that the relationship between time dummy variable and GDP, residential income per capita and CPI are totally insignificant, meaning that there exists no causality between the time of bidding for Winter Olympics and local economy with OLS estimator, which is different from our expectation. However, the cultural and athletic expenditures and international travel income exhibit significant results. In specific, the effects of cultural and athletic expenditures on GDP and income per capita are positive, while the effects of them on CPI are negative. In contrast, the effects of international travel income on GDP and income per capita are negative, while the effects on CPI are greatly positive.
5.2 Results of RDD Regression
After analyzing the outcomes with OLS estimators, the outcomes could be observed with RDD method. The results are shown below:
Table 4. The results of regression discontinuity design.
Explanatory Variable | Explained Variable | ||
GDP | Inc | CPI | |
Time | -188.232 (228.598) | -4.226 (304.761) | 1.842* (0.148) |
Z-value | -0.82 | -0.01 | 12.43 |
Prob (Z-statistics) | 0.410 | 0.989 | 0.000 |
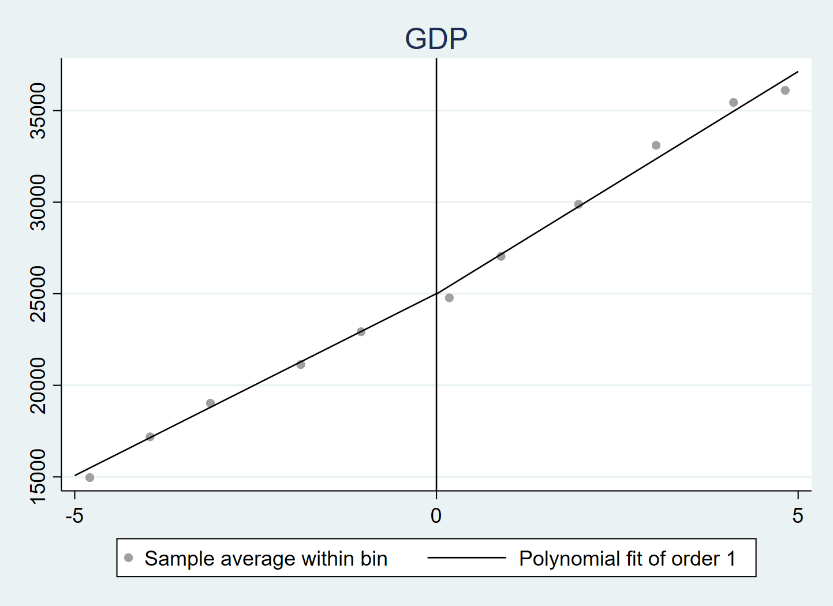 From table 4, the results find that the effects of time dummy on GDP and income per capita are insignificant, whereas the effects of time dummy on CPI are significantly positive. To precisely describe the relationship between them, the paper plots the following three graphs to show the changes in cutoff.
Fig. 1. The regression discontinuity of GDP.
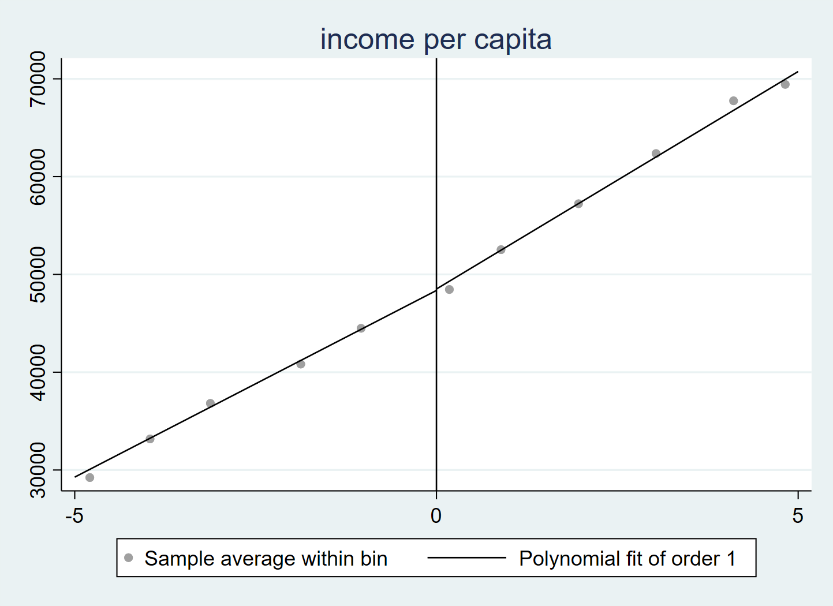
Fig. 2. The regression discontinuity of residential income per capita.
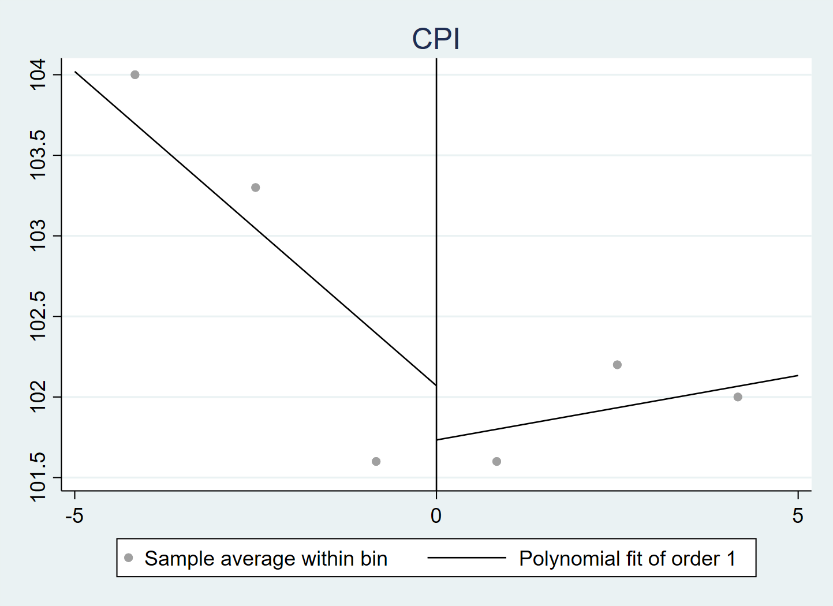
Fig. 3. The regression discontinuity of fCPI.
From figure 1, figure2 and figure 3, the results show that the differences in GDP and income per capita between the cutoff are insignificant, meaning that the successful bid for Winter Olympics has no crucial impact on the development of GDP and income per capita. However, the difference in CPI between the cutoff are greatly significant. Before 2015, the development trend of CPI is downward sloping, while the trend line becomes upward sloping after 2015. There exists an obvious discontinuity between the two lines, so it can be concluded that the effect of successful bid for Winter Olympics on CPI is significantly positive. Then this paper tries to clarify the influential path on CPI and understand under which path the successful bid for Winter Olympics would significantly affect CPI. To solve the problem, the paper tests the relationship between time dummy and four explanatory variables above and get the following results:
Table 5. The results of regression discontinuity for influential path.
Explanatory Variable | Explained Variable | |||
infra | cul | inter | sport | |
Time | 61.650 (82.816) | 12.940* (11.413) | 3.099* (0.986) | -746.548* (10.212) |
Z-value | 0.740 | 5.09 | 3.14 | -73.10 |
Prob (Z-statis) | 0.457 | 0.000 | 0.002 | 0.000 |
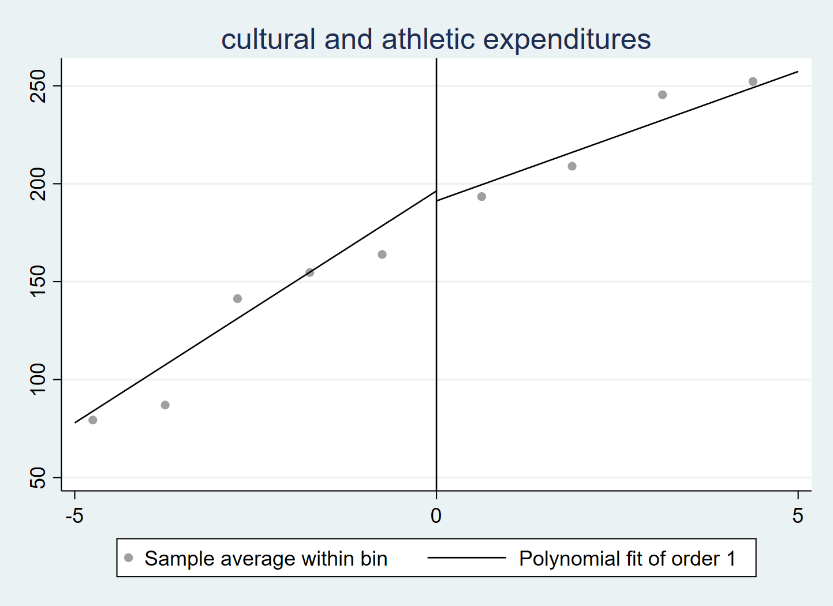 From table 5, the results show that the effect of time dummy variable on infrastructure investment is insignificant, while the effect of time dummy on cultural and athletic expenditures and international travel income are significantly positive, and the effect of time dummy on the number of sports venues is significantly negative. The relationship can be clearly reflected in the graphs below:
Fig. 4. The regression discontinuity of cultural and athletic expenditures
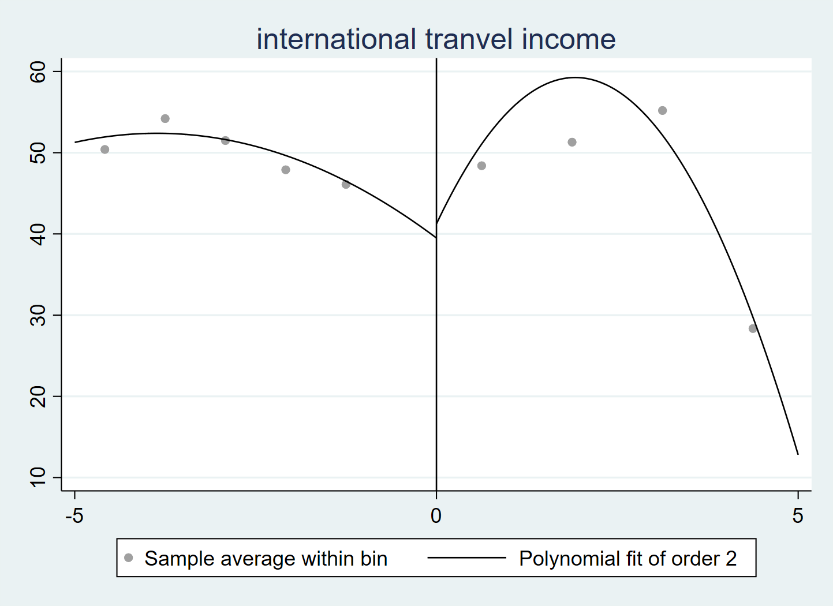
Fig. 5. The regression discontinuity of international travel income.
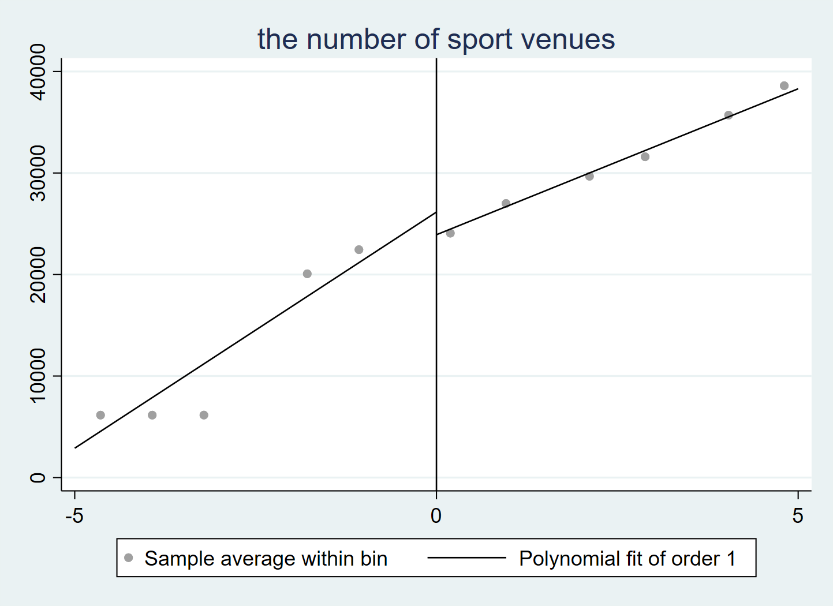
Fig. 6. The regression discontinuity of the number of sports venues.
From figure 4, figure 5 and figure 6, the results show that the differences in cultural and athletic expenditures, international travel income and the number of sport venues are significant between the cutoff. Therefore, the conclusion could be drawn that the bid for Winter Olympics has an important influence on cultural and athletic expenditures, international travel income and the number of sport venues, thus affecting the level of CPI greatly. The influential path is from successful bidding to the three explanatory variables, ultimately making local CPI increasing.
6 Conclusion
This paper employs regression discontinuity design (RDD) to examine the impact of bid for 2022 Beijing Winter Olympic Games on local economy with data from 2010 to 2020. Through empirical analysis, we come up with the following conclusions:
The effect of bid for Winter Olympics on GDP and residential income per capita in Beijing is insignificant. There exists no obvious difference before and after 2015.
The effect of bid for Winter Olympics on CPI in Beijing is significantly positive. We can clearly observe an obvious difference between two sides of the cutoff year 2015, in other words, local CPI has been greatly shocked in response to the bid for Winter Olympics in 2015.
The bid for Winter Olympics plays a significant role in the changes of CPI through three ways: cultural and athletic expenditures, international travel income and the number of sports venues. More concrete, the bid has a positive influence on cultural and athletic expenditures while it has a negative influence on the number of sports, finally making great contributions to the increments to CPI level.
Finally, there exist several drawbacks in this paper. For one thing, in analysis of RDD method, the changes caused by the bid for Winter Olympics between the cutoff year will not appear soon due to lag effect of policy implementation. Therefore, it would be more accurate and efficient to use fuzzy regression discontinuity instead of sharp regression discontinuity. For another thing, the paper chooses yearly data from 2010 to 2020, which seems to be insufficient to evaluate the whole effect of bid on local economy. Certain problems of data selection may lead to bias of results.
References
[1]. Toohey, K., and Veal, A.J. (2007) The Olympic Games: A Social Science Perspective. CAB International, London.
[2]. Chai, Wangjun, and Ni, Xin. (2009) On the characteristics and development process of the Olympic movement system -- from the perspective of other organization and self-organization theory. Journal of Beijing University of Physical Education, 32, 12-15.
[3]. Madden, J.R., and Crowe, M. (1998) Estimating the economic impact of the Sydney Olympic Games. http://hdl.handle.net/10419/113652.
[4]. Owen, J.R. (2005) Estimating the Cost and Benefit of Hosting Olympic Games: What Can Beijing Expect from Its 2008 Games? The Industrial Geographer, 3, 1540-1669.
[5]. Gu, Haibing, and Zhang, Xiaoyan. (2016) Forecasting the Economic Impact of Beijing 2022 Olympic Winter Games. Research on Economics and Management, 37, 27-36.
[6]. Hu, Liangbin, and Yang, Jianquan. (2017) The influence of Beijing Winter Olympic Games on the regional economy of North China and Its Countermeasures. Economic Research Guide, 27, 56-57.
[7]. Kaplanidou K. and Karadakis K. (2010) Understanding the Legacies of a Host Olympic City: The Case of the 2010 Vancouver Olympic Games. Sport Marketing Quarterly, 19, 110-117.
[8]. Porter P.K. and Fletcher D. (2008) The Economic Impact of the Olympic Games: Ex Ante Predictions and Ex Poste Reality. Journal of Sport Management, 22, 470-486.
Cite this article
Li,J.;Wang,X.;Sun,S. (2023). The Impact of Successful Bid for 2022 Beijing Winter Olympic Games on Local Economic and Social Lives. Advances in Economics, Management and Political Sciences,3,154-164.
Data availability
The datasets used and/or analyzed during the current study will be available from the authors upon reasonable request.
Disclaimer/Publisher's Note
The statements, opinions and data contained in all publications are solely those of the individual author(s) and contributor(s) and not of EWA Publishing and/or the editor(s). EWA Publishing and/or the editor(s) disclaim responsibility for any injury to people or property resulting from any ideas, methods, instructions or products referred to in the content.
About volume
Volume title: Proceedings of the 6th International Conference on Economic Management and Green Development (ICEMGD 2022), Part Ⅰ
© 2024 by the author(s). Licensee EWA Publishing, Oxford, UK. This article is an open access article distributed under the terms and
conditions of the Creative Commons Attribution (CC BY) license. Authors who
publish this series agree to the following terms:
1. Authors retain copyright and grant the series right of first publication with the work simultaneously licensed under a Creative Commons
Attribution License that allows others to share the work with an acknowledgment of the work's authorship and initial publication in this
series.
2. Authors are able to enter into separate, additional contractual arrangements for the non-exclusive distribution of the series's published
version of the work (e.g., post it to an institutional repository or publish it in a book), with an acknowledgment of its initial
publication in this series.
3. Authors are permitted and encouraged to post their work online (e.g., in institutional repositories or on their website) prior to and
during the submission process, as it can lead to productive exchanges, as well as earlier and greater citation of published work (See
Open access policy for details).
References
[1]. Toohey, K., and Veal, A.J. (2007) The Olympic Games: A Social Science Perspective. CAB International, London.
[2]. Chai, Wangjun, and Ni, Xin. (2009) On the characteristics and development process of the Olympic movement system -- from the perspective of other organization and self-organization theory. Journal of Beijing University of Physical Education, 32, 12-15.
[3]. Madden, J.R., and Crowe, M. (1998) Estimating the economic impact of the Sydney Olympic Games. http://hdl.handle.net/10419/113652.
[4]. Owen, J.R. (2005) Estimating the Cost and Benefit of Hosting Olympic Games: What Can Beijing Expect from Its 2008 Games? The Industrial Geographer, 3, 1540-1669.
[5]. Gu, Haibing, and Zhang, Xiaoyan. (2016) Forecasting the Economic Impact of Beijing 2022 Olympic Winter Games. Research on Economics and Management, 37, 27-36.
[6]. Hu, Liangbin, and Yang, Jianquan. (2017) The influence of Beijing Winter Olympic Games on the regional economy of North China and Its Countermeasures. Economic Research Guide, 27, 56-57.
[7]. Kaplanidou K. and Karadakis K. (2010) Understanding the Legacies of a Host Olympic City: The Case of the 2010 Vancouver Olympic Games. Sport Marketing Quarterly, 19, 110-117.
[8]. Porter P.K. and Fletcher D. (2008) The Economic Impact of the Olympic Games: Ex Ante Predictions and Ex Poste Reality. Journal of Sport Management, 22, 470-486.