


1. Introduction
A portfolio refers to a collection of various financial assets, including stocks, funds, bonds, real estate, and derivatives. As portfolio management is the art of selecting and forecasting the assets of investments, the aim is to adhere to the desired financial goals and minimize the risk tolerance of individuals or institutions. However, there are many factors involved in building and maintaining a high-return portfolio, including diversification, asset allocation, and especially the fluctuation of the stock market. The instability of the market attracts an increasing number of researchers and investors to pursue their passions in predicting stock prices to achieve high portfolio returns.
Portfolio construction is a big challenge for institutions and individual investors, primarily driven by the pursuit of higher returns. Therefore, researchers integrate portfolio construction models with forecasting models in order to investigate efficient portfolio allocations. The time series model is introduced to improve portfolio performance. For instance, Soeryana, Fadhlina, and Rusyaman took a time series approach to optimize the Mean-Variance portfolio [1]; Neto, Calvalcanti and Ren used data extracted from exogenous series to do a time series forecast [2]; Zhou, Yang and Yu achieved portfolio optimization under the fuzzy time series method [3]. In recent years, there has been a surge in the utilization of machine learning and deep learning models for the purpose of portfolio development, such as random forest (RF), support vector regression (SVR), and long short-term memory (LSTM). In a study conducted by Ma, Han, and Wang [4], the authors employed machine learning and deep learning models to enhance return prediction in portfolio performance by integrating returns and risks in portfolio construction. Similarly, Ban, EL, and Lim addressed the limitations of mean-variance and mean-conditional value-at-risk models by incorporating performance-based regularization (PBR) into portfolio optimization [5]. Chen, Zhang, Mehlawat and Jia applied eXtreme Gradient Boosting (XGBoost) and the firefly algorithm (IFA) to predict stock prices and constructed a portfolio under the mean-variance model [6]. Moreover, Ma, Han, and Wang explored portfolio optimization by employing three deep neural networks: deep multilayer perceptron (DMLP), long short memory (LSTM), and convolutional neural network (CNN) [4]. However, the existing research on deep learning models and machine learning models is currently restricted and requires more practical implementation.
This paper combines the LSTM foresting method for price forecasting to conduct portfolio construction and stock price prediction. The article initially identifies a set of 5 equities obtained from Yahoo Finance, spanning the time period from January 1, 2018, through December 31, 2022. Secondly, the paper adopts the LSTM model to train the first 80% of selected data and then tests the bottom 20% of selected data, yielding the predicted data. The Maximum Sharpe ratio and Minimum Variance portfolios can be computed based on predicted data and the mean-variance model. This study presents an analysis of cumulative returns derived from the Sharpe model and risk model depicted in a graph, as well as the cumulative returns of The S&P 500. By evaluating the Maximum Sharpe ratio and Minimum volatility portfolios, this paper can conclude that the portfolio constructed using predicted data has exceptional g performance compared to the S&P 500.
2. Data
For diversification purpose, the paper selected 5 stocks among various industries, which are Pegasystems Inc.; Wolfspeed, Inc.; Shell plc; Exxon Mobil Corporation; and DigitalOcean Holdings, Inc. The dataset comprises five years of closing prices, ranging from January 1, 2018, to December 31, 2022, which has been sourced from Yahoo Finance. The dataset is divided into a training set and a testing set, with the train-test ratio at 80:20. For further research, the paper processes the selected data.
Table 1: Selected stocks.
Stock Symbol | Company |
PEGA | Pegasystems Inc |
WOLF | Wolfspeed, Inc |
SHEL | Shell plc |
XOM | Exxon Mobil Corporation |
DOCN | DigitalOcean Holdings, Inc |
Based on selected database, the paper calculates several measurements and cumulative returns of 5 selected stocks during the 5-year period. Furthermore, the paper generates the cumulative returns of selected stocks. (See Table 2 and Figure 1).
Table 2: Statistics of selected stocks.
PEGA | WOLF | SHEL | XOM | DOCN | |
Mean | 86.5475 | 95.7838 | 48.3927 | 77.5748 | 53.4925 |
Std | 39.0723 | 16.4390 | 6.6890 | 18.2654 | 20.6941 |
Skewness | -0.1405 | 0.2071 | -0.0745 | 0.3449 | 1.3193 |
Kurtosis | -1.6201 | -0.2800 | -1.3926 | -1.2155 | 1.5490 |
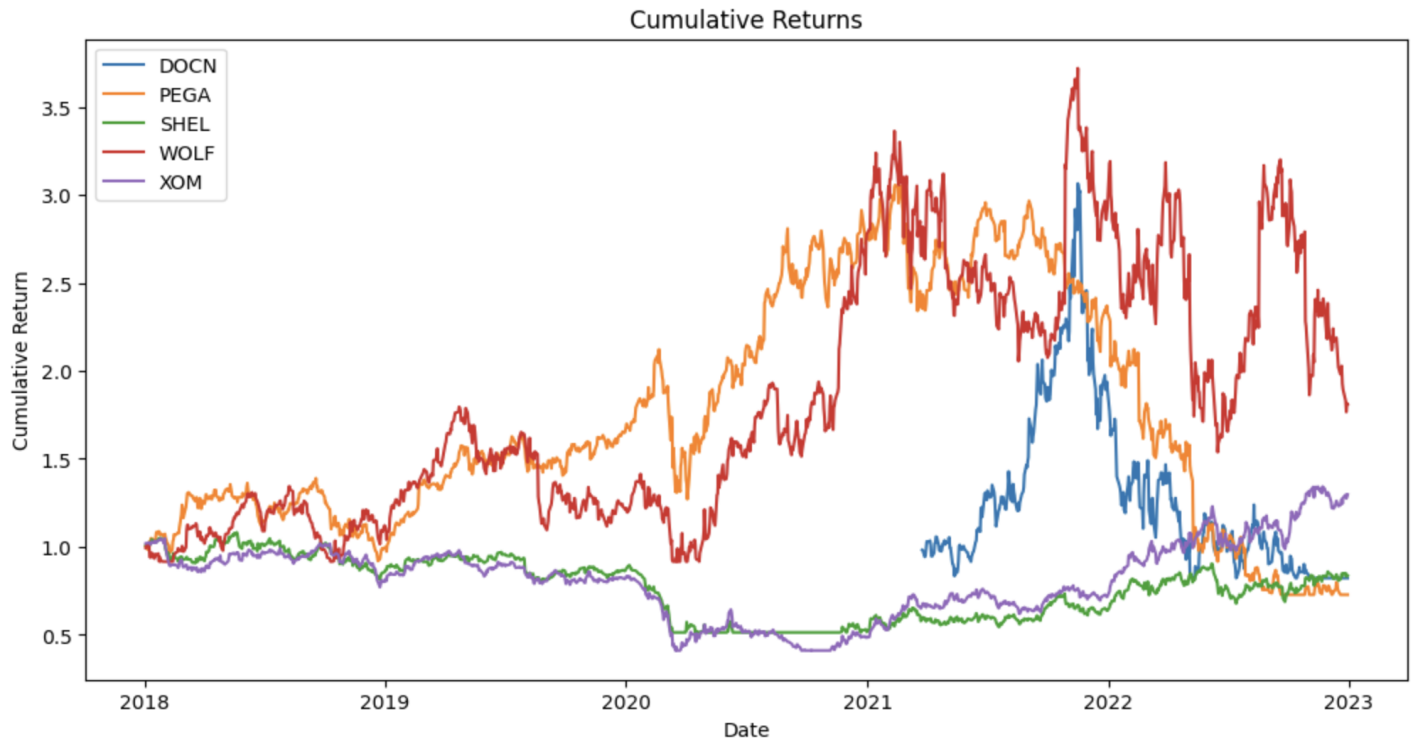
Figure 1: Cumulative returns of selected stocks.
3. Method
The portfolio allocation process consists of two distinct components. In the initial phase, data was gathered through Yahoo Finance. The utilization of Long Short-Term Memory (LSTM) prediction models has been observed in the domain of stock price forecasting. After assessing the Maximum Sharpe ratio and minimum variance, the paper chooses the most outperformance stocks according to predicted data with the object of exhibiting the highest anticipated returns and lowest levels of risk. The second part employs the mean-variance optimization (MVO) technique and subsequently uses the asset weight approach to conduct portfolio evaluation. The methodology structure is demonstrated in Figure 2.
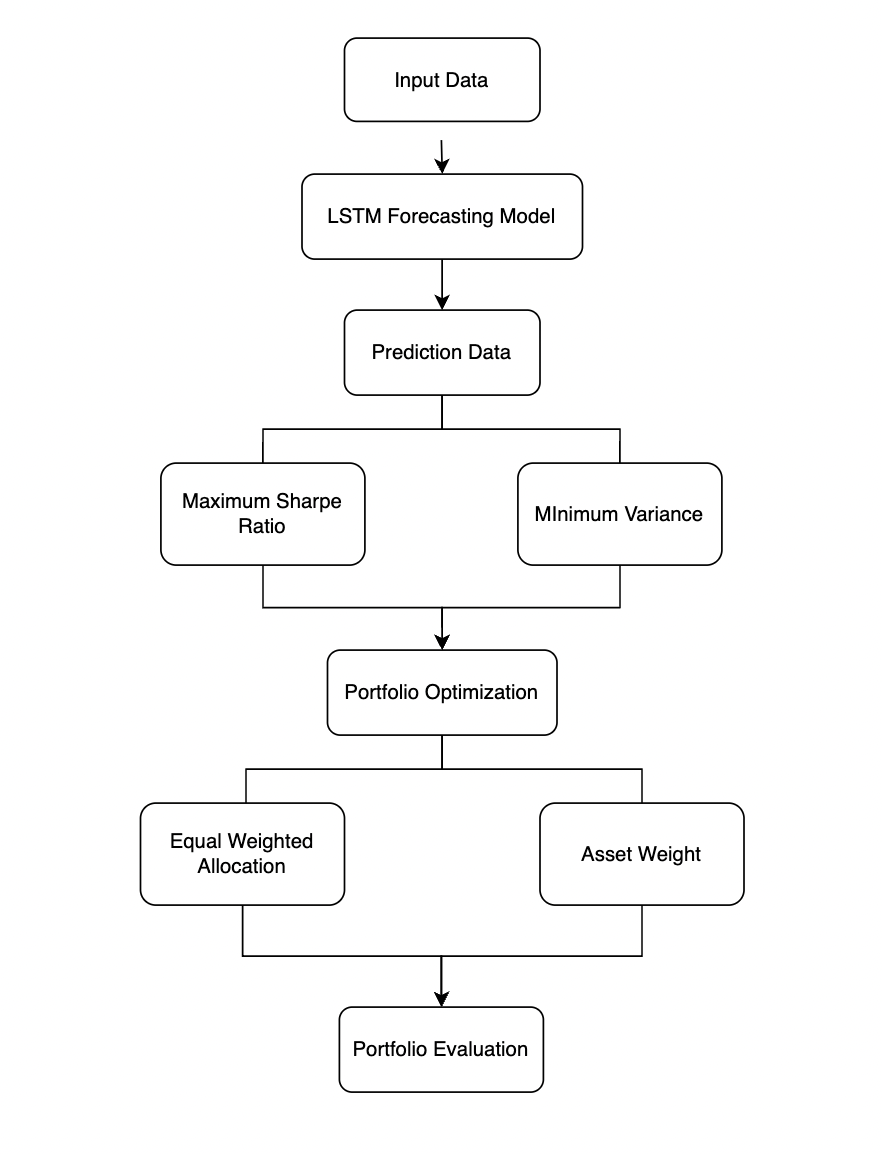
Figure 2: The overview of theoretical framework.
3.1. Prediction Model
The paper applies the LSTM forecasting model to predict stock prices and constructs a portfolio using the predicted results. The LSTM is a neural network structure. It can classify and process historical data to make predictions based on time series data [7]. The high effectiveness of reducing redundancy when processing historical data makes LSTM a well-spread prediction method for institutions and investors [8].
As an advanced version of RNN, LSTM possesses distinct benefits in effectively training data with long-term dependencies through the utilization of hidden layer units, commonly referred to as memory cells [9]. These memory cells have strong self-connecting functions that could help store network temporal state and incur three gates to control through: the input gate, the output gate, and the forget gate [10]. The previous two gates regulate the flow of the memory cell, where the input gate is utilized for inputting information into the cell state and the output gate is responsible for selecting the next hidden state [11]. The forget gate is used for finding out the information that should be dismissed from the cell [12]. Below is the structure of the LSTM network (See Figure 3):
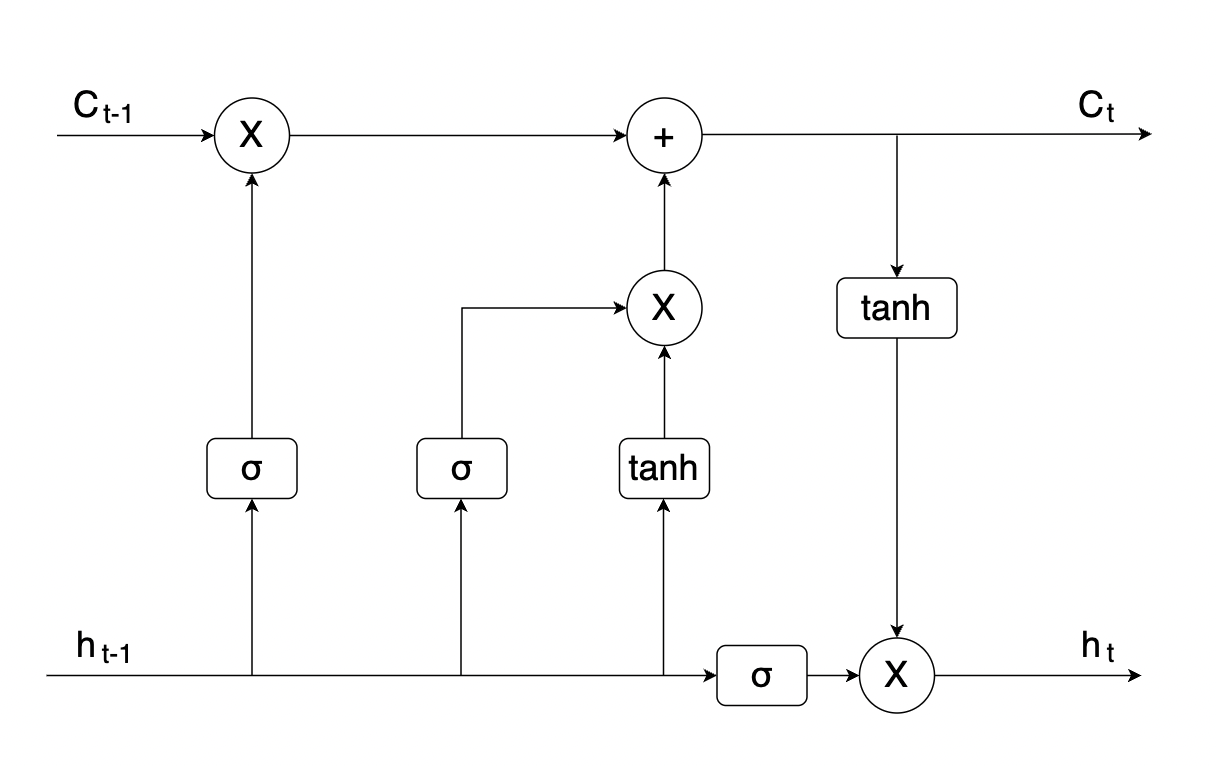
Figure 3: The overview of LSTM model.
The forget gate:
\( {f_{t}}= σ ({W_{f}} ∙[{h_{t-1}}, {x_{t}}]+ {b_{f}}) \) (1)
The input gate:
\( {i_{t}}=σ ( {W_{i}}∙[{ h_{t-1}},{ x_{t}} ]+ {b_{i}} ) \) (2)
\( \widetilde{C}{ _{t}}= tan{h} ({W_{C}} ∙[{ h_{t-1}}, {x_{t}}]+ {b_{C}}) \) (3)
Cell state:
\( {C_{t}}= {f_{t}}* {C_{t-1}}+ {i_{t}}* \widetilde{C}{ _{t}} \) (4)
The output gate:
\( {ο_{t}}= σ ( {W_{o}} [{h_{t-1}}, {x_{t}}]+ {b_{o}}) \) (5)
\( {h_{t}}= {o_{t}}* tan{h}({C_{t}}) \) (6)
3.2. Portfolio Optimization
The construction of portfolio is based on N different assets with different weights \( w=({w_{1}},{w_{2}},{w_{3}},..........{w_{n}}) \) and total weight is equal to 1. Using mean-variance optimization (MVO) method, the paper calculates the expected return and variance of the portfolio with weights:
\( E(R) = ∑(S× w) \) (7)
In this formula, S represents each asset, and w represents the weight assigned to each asset in the portfolio.
\( Var(P) = ∑∑({w_{i}} × {w_{j}} × {S_{i}} × {S_{j}} × Cov(i, j)) \) (8)
In this formula, Var(P) represents the portfolio variance, \( {w_{i}} \) and \( {w_{j}} \) are the weights of assets i and j, the \( {S_{i}} \) and \( {S_{j}} \) illustrates the signals for assets i and j, and Cov(i, j) refers to the covariance between assets i and j
4. Results
4.1. LSTM Forecasts
The paper collects 5-year historical data of selected stocks from Yahoo Finance during the period from 2018-01-01 to 2022-12-31 and sets an 80:20 train-test ratio for data prediction through the LSTM forecasting model. This study calculated the adjusted closing price and Mean Squared Error for each stock based on the specified criteria in the LSTM model. To be more specific, the LSTM model is configured with 50 units, and the range of epochs considered spans from 1 to 200. The results illustrate that the forecasted adjusted close price has better performance compared to the actual adjusted closing prices of the selected stocks over the five years (See Figure 4).
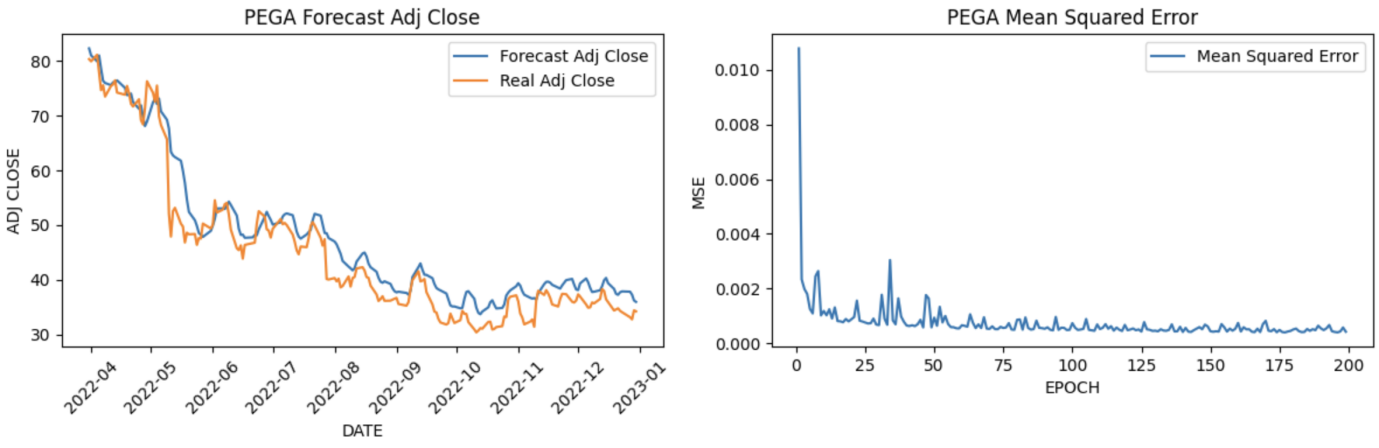
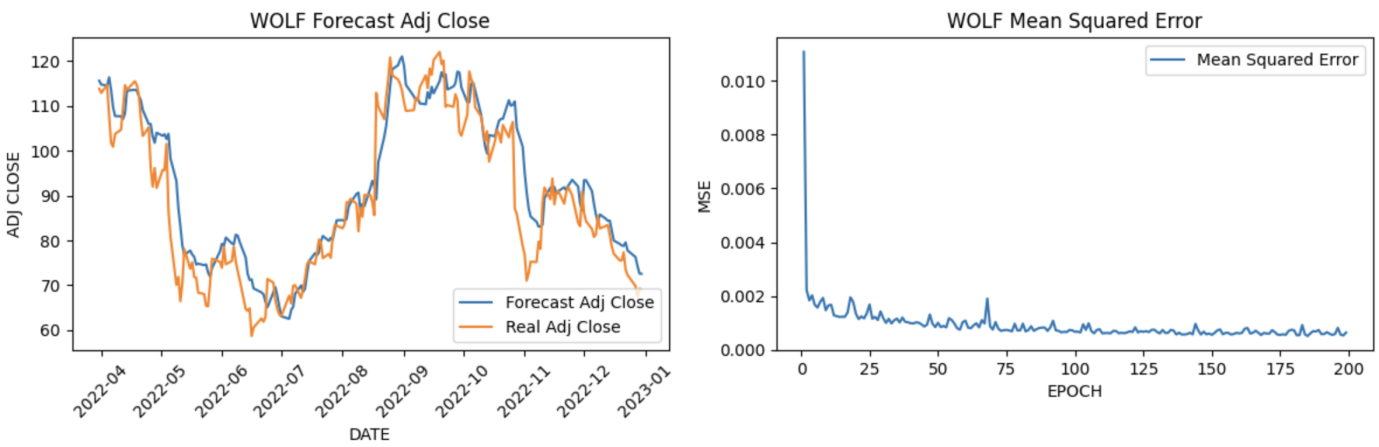
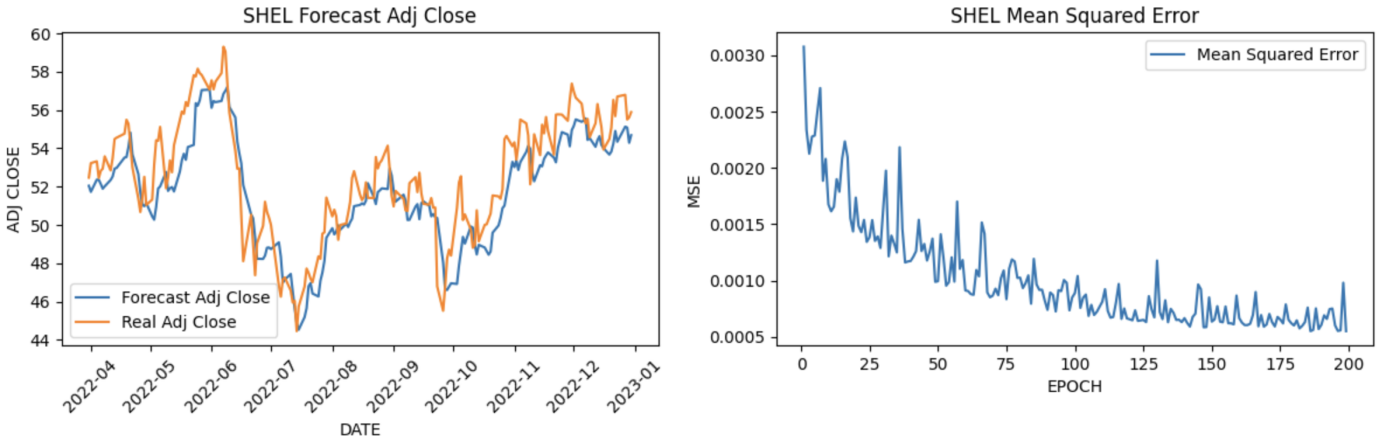
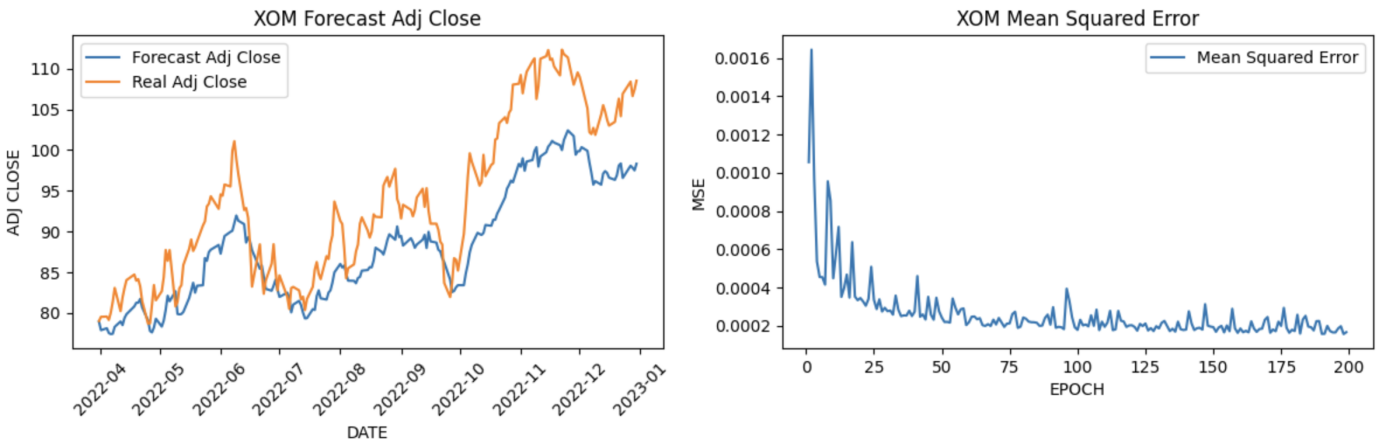

Figure 4: Predict values.
4.2. Portfolio Construction
With the intention of optimizing the portfolio, the paper uses the Mean-variance optimization method to calculate the portfolio’s expected return, maximum Sharpe ratio and minimum risk. Furthermore, the study uses the Monte Carlo simulation model to generate simulations for more than 5000 portfolios in order to determine the appropriate weight of each stock within the created portfolio.
4.2.1. Monte Carlo Simulation Model
It is a popular method to repeat random sampling and do what-if analysis to reach the maximum Sharpe ratio in optimal portfolio. The simulation model is an efficient tool for evaluating multiple variables correlation and reviewing strategies. First, it generates portfolio weights based on random sampling and adjusts weights until the portfolio gets the highest Sharpe ratio. The Figure 5 below is efficient frontier, and the red star represents the maximum Sharpe ratio in the optimized portfolio [13]. And the related asset weights are shown in Table 3.
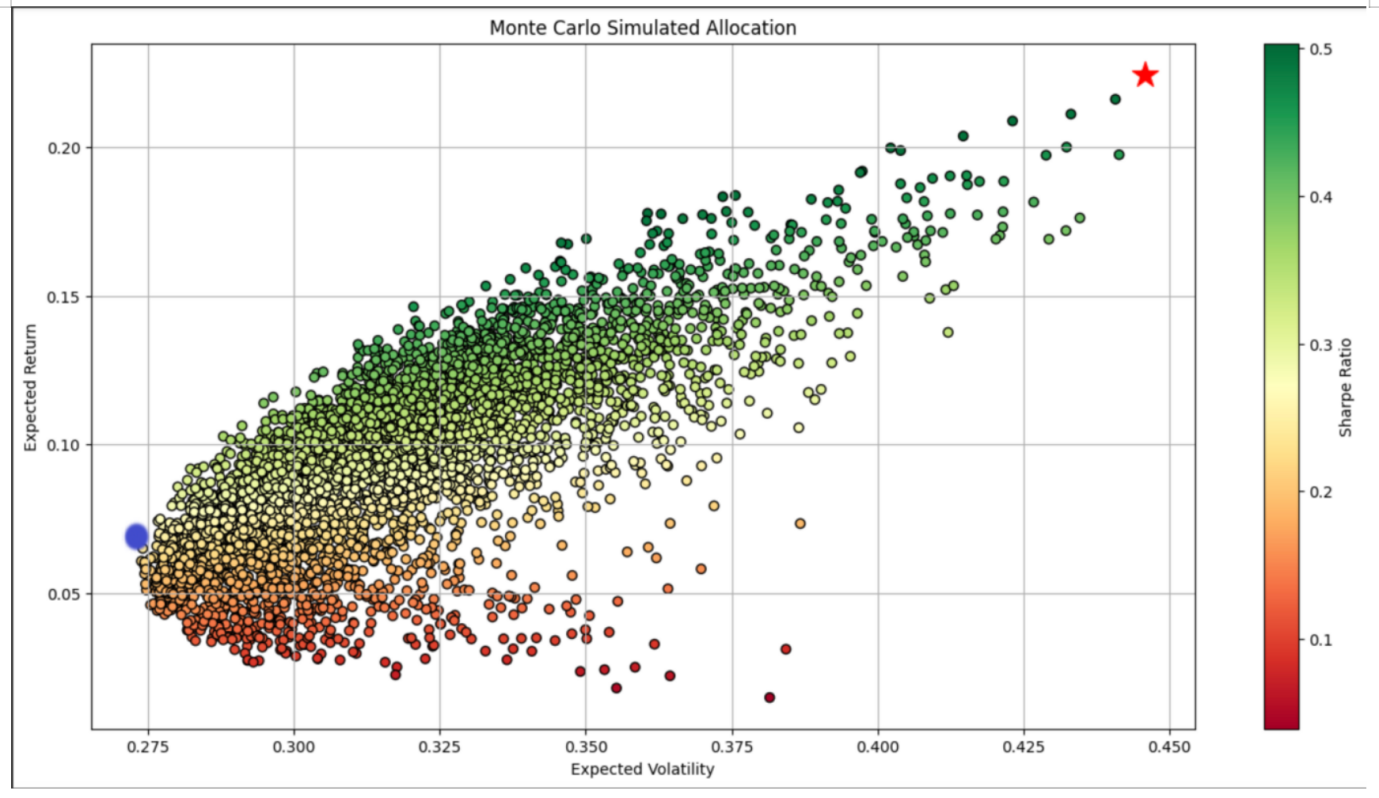
Figure 5: Efficient frontier.
Table 3: Asset weights.
Weights | Maximum Sharpe Ratio | Minimum Variance |
PEGA | 3.92 | 23.58 |
WOLF | 0.21 | 19.0 |
SHEL | 5.84 | 13.49 |
XOM | 64.27 | 0.0 |
DOCN | 25.76 | 43.93 |
4.2.2. Comparison with S&P500
To evaluate the portfolio’s performance, the paper compares Maximum Sharpe Ratio and Minimum Variance of constructed portfolio with these data of S&P 500. The results are shown below in Figure 6:
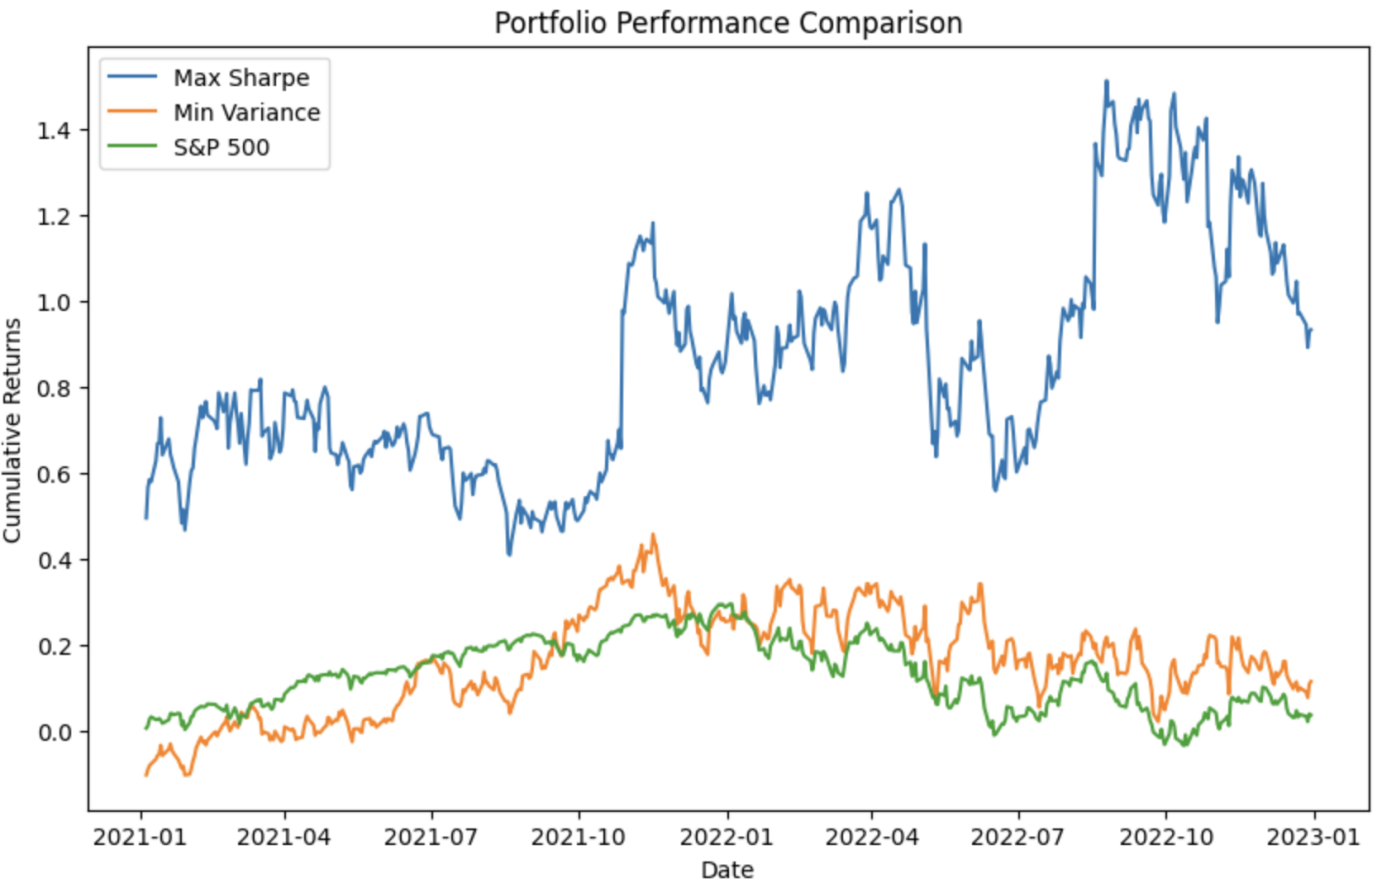
Figure 6: Comparison of with the S&P 500 index.
Obviously, the lines of Max Sharpe and Min Variance are better than the S&P 500 line. Hence, the constructed portfolio based on LSTM forecasting model has a better performance.
5. Conclusions
Predicting stock performance holds significant importance in the creation of investment portfolios. By using the LSTM model, the paper trains and tests a 5-year period dataset to get prediction data. In the context of portfolio evaluation, based on the predicted dataset, the paper uses the Minimum Variance Optimization method to approach the optimized portfolio with the maximum Sharpe ratio and minimum risk. Ultimately, this study undertakes a comparative analysis of the outcomes from the two models with S&P500 and concludes that the portfolio using the LSTM forecasting model has a strong performance.
There are several challenges in the process of portfolio construction. Firstly, historical data can not exactly forecast the future market. Secondly, the stock market experiences volatility as a result of a multitude of causes. Therefore, a good portfolio performance based on historical data does not guarantee profitability in the actual stock market.
Authors Contribution
All the authors contributed equally, and their names were listed in alphabetical order.
References
[1]. Soeryana, E., Fadhlina, N., Rusyaman, E., & Supian, S. (2017). Mean-variance portfolio optimization by using time series approaches based on logarithmic utility function. In IOP Conference Series: Materials Science and Engineering (Vol. 166, No. 1, p. 012003). IOP Publishing.
[2]. M. C. Amorim Neto, G. D. C. Calvalcanti and T. I. Ren, "Financial time series prediction using exogenous series and combined neural networks," 2009 International Joint Conference on Neural Networks, Atlanta, GA, USA, 2009, pp. 149-156, doi: 10.1109/IJCNN.2009.5178949.
[3]. Zhou, R., Yang, Z., Yu, M., & Ralescu, D. A. (2015). A portfolio optimization model based on information entropy and fuzzy time series. Fuzzy Optimization and Decision Making, 14, 381-397.
[4]. Ma, Y., Han, R., & Wang, W. (2021). Portfolio optimization with return prediction using deep learning and machine learning. Expert Systems with Applications, 165, 113973.
[5]. Ban, G. Y., El Karoui, N., & Lim, A. E. (2018). Machine learning and portfolio optimization. Management Science, 64(3), 1136-1154.
[6]. Chen, W., Zhang, H., Mehlawat, M. K., & Jia, L. (2021). Mean–variance portfolio optimization using machine learning-based stock price prediction. Applied Soft Computing, 100, 106943.
[7]. Ta, V. D., Liu, C. M., & Tadesse, D. A. (2020). Portfolio optimization-based stock prediction using long-short term memory network in quantitative trading. Applied Sciences, 10(2), 437.
[8]. Sami, H. M., Fardous, L., & Ruhit, D. S. (2021). Portfolio optimization in DSE using financial indicators, LSTM & PyportfolioOpt. Int. J. Mat. Math. Sci, 3(4), 74-84.
[9]. Ya Gao, Rong Wang, Enmin Zhou, "Stock Prediction Based on Optimized LSTM and GRU Models", Scientific Programming, vol. 2021, Article ID 4055281, 8 pages, 2021. https://doi.org/10.1155/2021/4055281
[10]. Shahid, F., Zameer, A., & Muneeb, M. (2020). Predictions for COVID-19 with deep learning models of LSTM, GRU and Bi-LSTM. Chaos, Solitons & Fractals, 140, 110212.
[11]. Chen, W., Zhang, H., Mehlawat, M. K., & Jia, L. (2021). Mean–variance portfolio optimization using machine learning-based stock price prediction. Applied Soft Computing, 100, 106943.
[12]. Shahid, F., Zameer, A., & Muneeb, M. (2020). Predictions for COVID-19 with deep learning models of LSTM, GRU and Bi-LSTM. Chaos, Solitons & Fractals, 140, 110212.
[13]. Zaremba, W., Sutskever, I., & Vinyals, O. (2014). Recurrent neural network regularization. arXiv preprint arXiv:1409.2329.
Cite this article
Li,H.;Liu,T. (2023). Portfolio Optimization Based on the LSTM Forecasting Model. Advances in Economics, Management and Political Sciences,48,97-106.
Data availability
The datasets used and/or analyzed during the current study will be available from the authors upon reasonable request.
Disclaimer/Publisher's Note
The statements, opinions and data contained in all publications are solely those of the individual author(s) and contributor(s) and not of EWA Publishing and/or the editor(s). EWA Publishing and/or the editor(s) disclaim responsibility for any injury to people or property resulting from any ideas, methods, instructions or products referred to in the content.
About volume
Volume title: Proceedings of the 2nd International Conference on Financial Technology and Business Analysis
© 2024 by the author(s). Licensee EWA Publishing, Oxford, UK. This article is an open access article distributed under the terms and
conditions of the Creative Commons Attribution (CC BY) license. Authors who
publish this series agree to the following terms:
1. Authors retain copyright and grant the series right of first publication with the work simultaneously licensed under a Creative Commons
Attribution License that allows others to share the work with an acknowledgment of the work's authorship and initial publication in this
series.
2. Authors are able to enter into separate, additional contractual arrangements for the non-exclusive distribution of the series's published
version of the work (e.g., post it to an institutional repository or publish it in a book), with an acknowledgment of its initial
publication in this series.
3. Authors are permitted and encouraged to post their work online (e.g., in institutional repositories or on their website) prior to and
during the submission process, as it can lead to productive exchanges, as well as earlier and greater citation of published work (See
Open access policy for details).
References
[1]. Soeryana, E., Fadhlina, N., Rusyaman, E., & Supian, S. (2017). Mean-variance portfolio optimization by using time series approaches based on logarithmic utility function. In IOP Conference Series: Materials Science and Engineering (Vol. 166, No. 1, p. 012003). IOP Publishing.
[2]. M. C. Amorim Neto, G. D. C. Calvalcanti and T. I. Ren, "Financial time series prediction using exogenous series and combined neural networks," 2009 International Joint Conference on Neural Networks, Atlanta, GA, USA, 2009, pp. 149-156, doi: 10.1109/IJCNN.2009.5178949.
[3]. Zhou, R., Yang, Z., Yu, M., & Ralescu, D. A. (2015). A portfolio optimization model based on information entropy and fuzzy time series. Fuzzy Optimization and Decision Making, 14, 381-397.
[4]. Ma, Y., Han, R., & Wang, W. (2021). Portfolio optimization with return prediction using deep learning and machine learning. Expert Systems with Applications, 165, 113973.
[5]. Ban, G. Y., El Karoui, N., & Lim, A. E. (2018). Machine learning and portfolio optimization. Management Science, 64(3), 1136-1154.
[6]. Chen, W., Zhang, H., Mehlawat, M. K., & Jia, L. (2021). Mean–variance portfolio optimization using machine learning-based stock price prediction. Applied Soft Computing, 100, 106943.
[7]. Ta, V. D., Liu, C. M., & Tadesse, D. A. (2020). Portfolio optimization-based stock prediction using long-short term memory network in quantitative trading. Applied Sciences, 10(2), 437.
[8]. Sami, H. M., Fardous, L., & Ruhit, D. S. (2021). Portfolio optimization in DSE using financial indicators, LSTM & PyportfolioOpt. Int. J. Mat. Math. Sci, 3(4), 74-84.
[9]. Ya Gao, Rong Wang, Enmin Zhou, "Stock Prediction Based on Optimized LSTM and GRU Models", Scientific Programming, vol. 2021, Article ID 4055281, 8 pages, 2021. https://doi.org/10.1155/2021/4055281
[10]. Shahid, F., Zameer, A., & Muneeb, M. (2020). Predictions for COVID-19 with deep learning models of LSTM, GRU and Bi-LSTM. Chaos, Solitons & Fractals, 140, 110212.
[11]. Chen, W., Zhang, H., Mehlawat, M. K., & Jia, L. (2021). Mean–variance portfolio optimization using machine learning-based stock price prediction. Applied Soft Computing, 100, 106943.
[12]. Shahid, F., Zameer, A., & Muneeb, M. (2020). Predictions for COVID-19 with deep learning models of LSTM, GRU and Bi-LSTM. Chaos, Solitons & Fractals, 140, 110212.
[13]. Zaremba, W., Sutskever, I., & Vinyals, O. (2014). Recurrent neural network regularization. arXiv preprint arXiv:1409.2329.