


1. Introduction
Coca-Cola and Pepsi have attracted extensive research in the beverage industry, particularly concerning their marketing models, competitive strategies, and investment in advertising, corporate image, and product pricing. Luis Filipe Silva Moreira analyzed Coca-Cola’s competitive advantages, business model, and product iterations, highlighting the company’s current challenges and opportunities [1]. In a separate study, Dhar et al. performed an econometric analysis to examine the brand-level strategic pricing of Coca-Cola and PepsiCo, investigating the impact of price fluctuations on their revenue profiles at a micro level [2]. Building upon existing scholarship, this paper aims to provide a comprehensive insight into the marketing strategies, brand positioning, and competitive dynamics of Coca-Cola and PepsiCo. The primary data utilized in this study is sourced from the annual reports of both companies for the period of 2019-2021. To further enhance the understanding of their performance, this paper assesses the financial performance of Coca-Cola and PepsiCo by measuring their profitability, efficiency, liquidity, solvency, and market expectations. Various ratios are calculated to evaluate their overall positions, highlighting differences in profitability and market value driven by their respective strategies. The paper concludes by summarizing both companies’ overall strengths and future development prospects while providing suggestions for updating valuation methodologies. For example, under the guidance of the concept of sustainable development, some new standards such as CSR (sustainability and corporate social responsibility) and ESG (environmental, social, and corporate governance) have emerged [3][4]. The comprehensive assessment of the financial performance of Coca-Cola and PepsiCo can contribute to the existing body of research while providing valuable insights for industry analysts, investors, and stakeholders seeking to understand the dynamics of the carbonated beverage market.
2. Company Profile
The Coca-Cola Company began in 1886 as the world’s first Coke category pioneer. As the world’s largest non-alcoholic soft drink company, it sells over 500 brands of beverage products in more than 200 countries and territories. By 2019, Coca-Cola had a global presence and revenues of US$37, 266 million [5]. PepsiCo was launched later than Coca-Cola in 1890 and registered its trademark in 1903. It became a soft drink trendsetter independent of Coca-Cola. It operates in nearly 200 countries around the world and employs 285,000 people. With revenues of US$67,161 million in 2019, it is the world’s fourth-largest food and beverage company [6]. These two companies have each demonstrated strong market dynamics while constantly competing regarding market structure, strategic pricing, and marketing models. Their different strategies have allowed the two companies to perform differently regarding profitability, efficiency, and liquidity.
3. Methodology
The data for this article is derived from the annual financial reports of the Coca-Cola Company and PepsiCo for 2019-2021[6][7][8][9][10][11]. The method of analysis in this paper uses fundamental financial ratios for quantitative analysis. Financial ratios are basic calculations using quantitative data from a company’s financial statements. They are used to gain insights and essential information about a company’s performance, profitability, and financial position. The typical financial ratios every business should track are profitability, efficiency, liquidity, solvency, and market value ratios.
Corresponding ratios are used to measure the five dimensions. In detail, this paper uses return on asset (ROA) and net profit margin to measure profitability. In contrast, cash flow on total assets, inventory turnover ratio, receivable turnover ratio, and total asset turnover ratio are used to measure efficiency. For the assessment of liquidity, the current ratio and the quick ratio are selected. Additionally, the debt ratio and debt-to-equity ratio are calculated for solvency evaluation. Regarding the market expectations of Coca-Cola and Pepsi, the book value per ordinary share, dividend yield ratio, and price earning ratio (P/E) are calculated.
Partial ratio calculation formula are shown as follows. For profitability ratios, ROA = Net Income/Average Total Assets; Net profit margin = Net Income/Net Sales. For market value ratios, the book value per ordinary share = Total Shareholders’ Equity/Number of outstanding ordinary shares; dividend yield ratio = dividends per share/market price per share; P/E ratio = market price per share/earnings per share.
4. Financial Performance
4.1. Profitability
Pepsi is substantially ahead of Coca-Cola in terms of net operating income. Specifically, as shown in Figure 1, from fiscal years 2015-2019, PepsiCo’s net operating income was consistently above US$60 billion, reaching US$67.16 billion in 2019, an increase of 3.9% year-on-year. On the other hand, Coca-Cola only achieved an operating income of US$37.27 billion during the same period, up 9% year-on-year.
However, as shown in Table 1, Coca-Cola has performed better than PepsiCo in terms of its ability to draw money. In the 2014-2019 fiscal year, Coca-Cola’s net profit was higher than PepsiCo’s overall, and in 2019, Coca-Cola’s net profit was US$8.920 billion, up 39% year-on-year; PepsiCo’s net profit was US$7.314 billion, down 42% year-on-year. The same trend can be seen in ROA and net profit margin. For the 2019-2021 financial year, Coca-Cola’s ROA value and net profit margin are higher than PepsiCo’s, meaning Coca-Cola is better at generating as much profit as possible from its assets. On balance, Coca-Cola has shown its ability to absorb money, although PepsiCo’s operating income is higher than Coca-Cola’s.
Table1: ROA and net profit margin of Pepsi and Coca-Cola from 2019 to 2021 [4][5][6][7][8][9].
Pepsi 2021 | CocaCola 2021 | Pepsi 2020 | CocaCola 2020 | Pepsi 2019 | CocaCola 2019 | |
ROA | 8.29 | 10.79 | 8.37 | 8.95 | 9.42 | 10.60 |
Net profit margin | 9.66 | 25.36 | 10.20 | 23.53 | 10.95 | 24.11 |
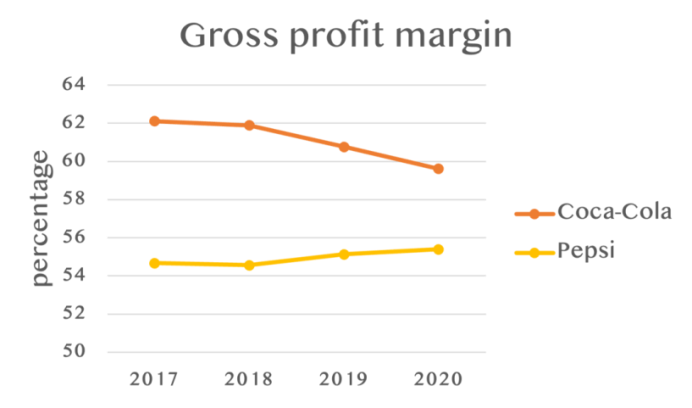
Figure 1: Gross profit margin for Pepsi and Coca-Cola from 2017 to 2020 [4][5][6][7][8][9].
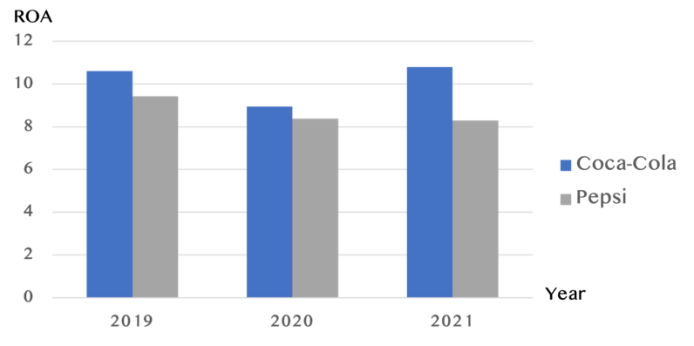
Figure 2: ROA for Pepsi and Coca-Cola from 2017 to 2020 [6][7][8][9][10][11].
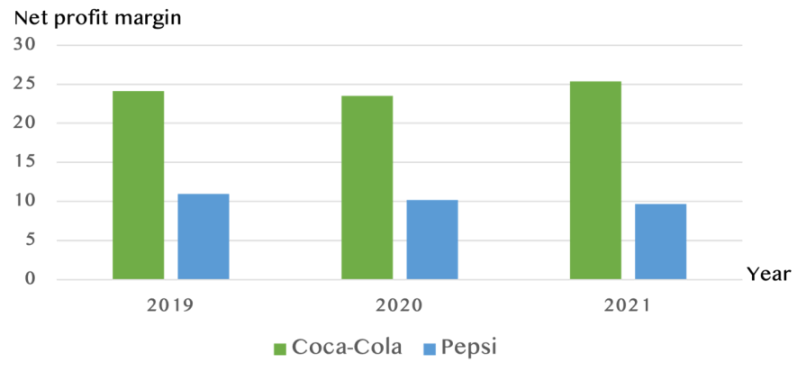
Figure3: Net profit margin for Pepsi and Coca-Cola from 2017 to 2020 [6][7][8][9][10][11].
To conduct a comprehensive analysis of the profitability disparity between Coca-Cola and PepsiCo, it is imperative to delve into the distinct components contributing to their respective earnings. Beginning with Coca-Cola’s earnings composition, insights from the Coca-Cola Business and Sustainability Report 2019 reveal that over fifty percent of the company’s revenue is generated through the sales of Sparkling Soft Drinks [5]. Coca-Cola’s business model revolves around these categories, primarily emphasizing beverages encompassing juices, coffees, teas, and other related products. In contrast, at PepsiCo, as seen in the 2019 PepsiCo Annual Statement, 46 percent of PepsiCo’s revenue is provided by the sales of beverages, while 54 percent of revenue is provided by food sales [6]. While Coca-Cola primarily focuses on soft drinks, Pepsi has expanded its business to include snacks.
Thus, the difference in “money-sucking” ability lies in the different focuses of the companies. New beverages primarily drive Coca-Cola’s net profit; however, PepsiCo is positioning itself as a food and beverage company. Based on this, PepsiCo’s food business must compete with relevant international majors and regional leaders. This means it costs much money each year in marketing, personnel, and other expenses, which undoubtedly reduces the business’s net profitability.
In addition, there are some differences in the two companies business models and strategies. In general, Coca-Cola pursues relative stability, focusing on the research and development of cola and the innovation of green drinks and not obsessing over expanding its food business. On the other hand, Pepsi is more diversified, with a wide range of products and marketing tools. PepsiCo’s Ritz-Cola, for example, launches new flavors of crisps every year and has made great efforts in marketing the product by using co-branding and endorsements. Of course, product diversification is also a double-edged sword. For Pepsi, the more product variety it has, the more competitors it faces. Pepsi must face more significant upward pressure on raw material costs than a company focusing on a single business. This has resulted in a situation where Pepsi has higher marketing revenues than Coca-Cola but lower net profits
4.2. Efficiency
Regarding the efficiency of the two companies, the four indicators used here are Cash Flow on Total assets, Inventory Turnover Ratio, Receivable Turnover Ratio, and Total Asset Turnover. All four figures are presented as three-year averages.
Table 2: Three-year-average of Cash flow on total asset, Inventory turnover ratio, Receivable turnover ratio and Total asset turnover for Pepsi and Coca-Cola from 2017 to 2020 [6][7][8][9][10][11].
PepsiCo | Coca-Cola | |
Cash flow on total asset | 0.12 | 0.12 |
Inventory turnover ratio | 4.39 | 8.83 |
Receivable turnover ratio | 10.21 | 8.98 |
Total asset turnover | 0.42 | 0.85 |
As shown in Table 2, Coca-Cola uses its inventory and assets more effectively to generate sales, as. Inventory Turnover Ratio and Total Asset Turnover Ratio are almost twice as high as Pepsi’s. However, Pepsi is more efficient in converting accounts receivable into cash. Both companies are equally efficient in using their assets to generate cash flow. Overall, Coca-Cola is more efficient in its operations than PepsiCo.
4.3. Liquidity
Two metrics have been chosen for liquidity: the current ratio and the quick ratio. As shown in Figure 4, from 2019 to 2021, Coca-Cola’s Current Ratio and Quick Ratio are consistently higher than PepsiCo’s, indicating that Coca-Cola can better meet its short-term obligations regardless of whether it needs to sell its inventory over time and therefore has higher liquidity than PepsiCo. In addition, as shown in Figure 5, the quick ratio and the current ratio are at most one from 2019 to 2021. Coca-Cola’s current ratio exceeds 1 in both 2020 and 2021, suggesting that Coca-Cola can better meet its short-term obligations if all short-term debt comes due simultaneously. Therefore, from 2019 - 2021, Coca-Cola’s liquidity capacity will be stronger than PepsiCo’s.
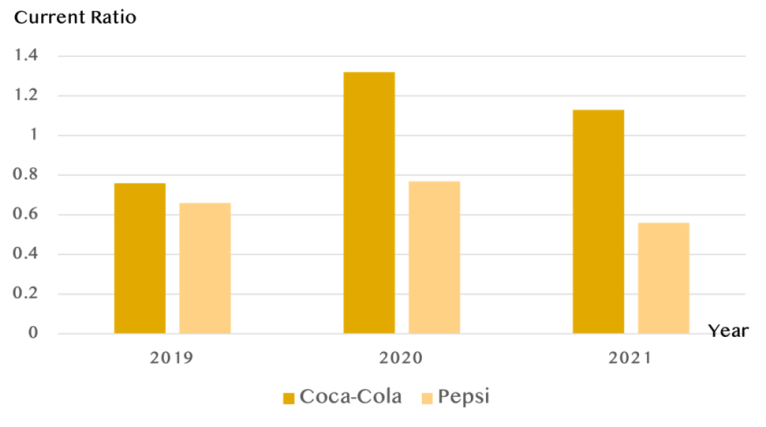
Figure 4: Current ratio for Coca-Cola and Pepsi from 2019 to 2021 [6][7][8][9][10][11].
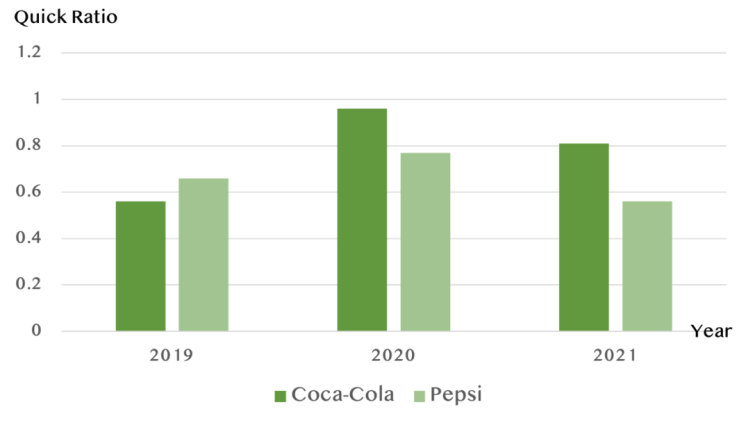
Figure5: Quick ratio for Coca-Cola and Pepsi from 2019 to 2021 [6][7][8][9][10][11].
4.4. Solvency
The debt ratio and debt-to-equity ratio are selected to assess solvency. As shown in Figure 6, from 2019-2021, Coca-Cola’s debt ratio is always lower than PepsiCo’s, which indicates that Coca-Cola’s debt ratio is smaller than PepsiCo’s, and that Coca-Cola is more likely to redeem its long-term obligations.
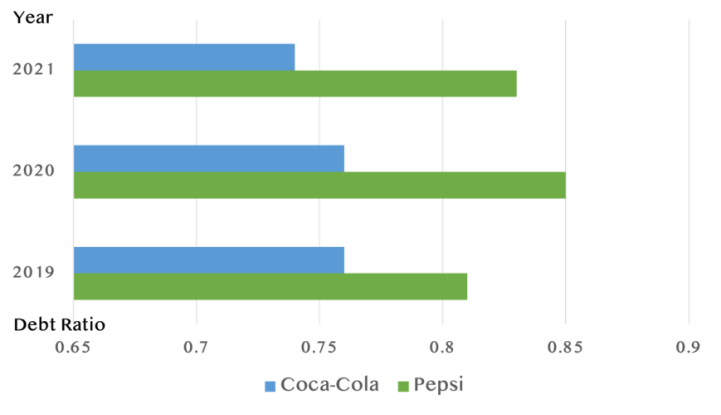
Figure 6: Debt ratio for Coca-Cola and Pepsi from 2019 to 2021 [6][7][8][9][10][11].
As shown in Figure 7, in terms of debt-to-equity ratio, Coca-Cola’s debt-to-equity ratio is always lower than PepsiCo’s, meaning that PepsiCo has to take on more debt per dollar of equity. Therefore, fully repaying its debt in the long run will take more work. On balance, Coca-Cola is more solvent than PepsiCo.
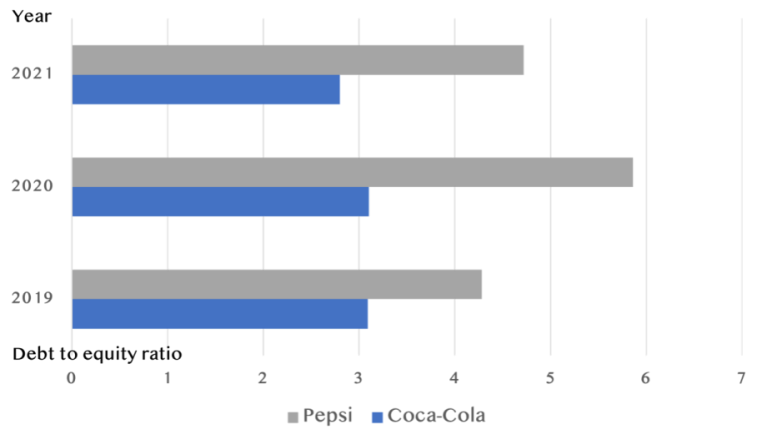
Figure 7: Debt to equity ratio for Coca-Cola and Pepsi from 2019 to 2021[6][7][8][9][10][11].
4.5. Market Value
Finally, the dividend yield, P/E ratio, and Book value per ordinary share were used to analyze the market outlook for both companies. As mentioned above, Coca-Cola performed better than Pepsi on the first four indicators. Nevertheless, the market outlook is different.
Over the last three years, Coca-Cola’s dividend yield has remained stable, with less than 0.49% fluctuations. This suggests that the company is a long-lasting investment. PepsiCo’s dividend yield has declined, but not by much. Although it is becoming less attractive, it is still a good investment option. As shown in Figure 8, in terms of P/E ratios, Coca-Cola’s is up in 2020 but down in 2021, while PepsiCo’s P/E ratio has been moderately up over the past three years. This suggests that investors are more optimistic about the company and are in a favorable position. Looking at the figures, Pepsi’s market outlook is more promising than that of Coca-Cola in general.
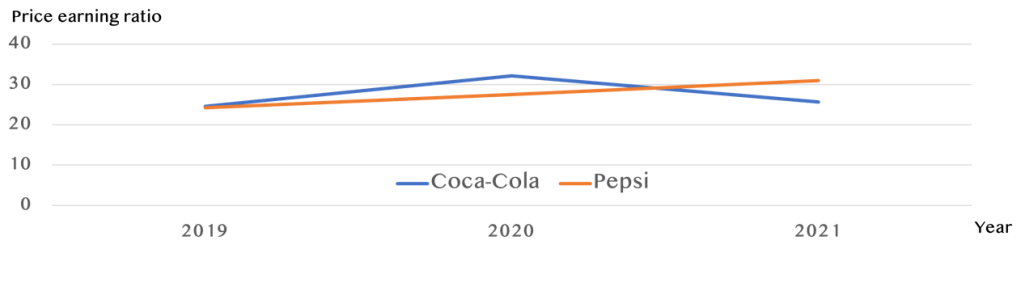
Figure 8: PE for Coca-Cola and Pepsi from 2019 to 2021 [6][7][8][9][10][11].
The performance of both Coca-Cola and PepsiCo during the recent pandemic can provide valuable insights into their respective strategies and adaptability. The closure of numerous restaurants and the overall impact on the beverage industry have posed challenges. Remarkably, the market for traditional carbonated beverages, predominantly associated with Coca-Cola, experienced a decline, resulting in significant fluctuations in the operating results of both companies. In 2020, Coca-Cola’s revenue recorded a year-on-year decrease of 11%, amounting to US$33,014 million [10]. Conversely, PepsiCo, benefiting from its diversified presence in both the food and beverage segments, witnessed a 4.8% increase in revenue compared to the previous year [7]. This highlights the advantage of PepsiCo’s broader product portfolio, which resembles the strategy of distributing investments across multiple areas, enabling it to withstand unexpected shocks better. Furthermore, PepsiCo’s superior market expectations can be attributed to its emphasis on innovation. The company displays a greater inclination towards developing new flavors compared to Coca-Cola. Generally, brands that establish themselves quickly, maintain a prominent presence on store shelves, and sustain consumer attention are less likely to lose their market position over time.
5. Conclusion
This paper examines the financial performance of Coca-Cola and PepsiCo, highlighting Coca-Cola’s overall superiority in terms of profitability, liquidity, efficiency, and solvency. In general, Coca-Cola’s pursuit of stability is commendable, but it lags behind PepsiCo in market value and future expectations. To remain competitive, Coca-Cola needs to embrace innovation and diverse strategies. On the other hand, PepsiCo excels in innovation and diversification but faces the challenge of reducing costs while sustaining profitability. The evolving nature of value assessment systems emphasizes the growing significance of CSR in evaluating company value. Alongside fundamental financial ratios, indicators such as ESG are now considered in the comprehensive evaluation of companies. To further enhance this research, future studies will expand the scope by incorporating other important non-financial factors that influence firm value by incorporating diverse data sources, such as market surveys, industry reports, and consumer feedback, to provide a more comprehensive analysis. By incorporating these improvements, the research aims to offer more accurate guidance and valuable insights for similar companies in the future.
References
[1]. Luis filipe Silva Moreira. Coca-Cola: Difficult To Mask Its Bitter Aftertaste. (2019, January 3). Https://Seekingalpha.Com/. https://seekingalpha.com/article/4231182-coca-cola-difficult-to-mask-bitter-aftertaste
[2]. Dhar, T., Chavas, J.-P., Cotterill, R. W., & Gould, B. W. An Econometric Analysis of Brand-Level Strategic Pricing Between Coca-Cola Company and PepsiCo. Journal of Economics Management Strategy, 14(4), 905–931. (2005).
[3]. Muniz, F., Guzmán, F., Paswan, A. K., & Crawford, H. J. The immediate effect of corporate social responsibility on consumer-based brand equity. Journal of Product & Brand Management. (2019).
[4]. Tien, N. H., Anh, D. B. H., & Ngoc, N. M. Corporate financial performance due to sustainable development in Vietnam. Corporate Social Responsibility and Environmental Management, 27(2), 694-705. (2020).
[5]. Coca-Cola Business And Sustainability Report. Coca-Cola. (2019).
[6]. Annual Report 2019. Pepsi. (2020).
[7]. Annual Report 2020. Pepsi. (2021).
[8]. Annual Report 2021. Pepsi. (2022).
[9]. Annual Report 2019. The Coca-Cola Company. (2020).
[10]. Annual Report 2020. The Coca-Cola Company. (2021).
[11]. Annual Report 2021. The Coca-Cola Company. (2022).
Cite this article
Qian,Y. (2023). Battle for the Lead: Analysis of Coca-Cola and Pepsi from Financial Performance. Advances in Economics, Management and Political Sciences,50,29-35.
Data availability
The datasets used and/or analyzed during the current study will be available from the authors upon reasonable request.
Disclaimer/Publisher's Note
The statements, opinions and data contained in all publications are solely those of the individual author(s) and contributor(s) and not of EWA Publishing and/or the editor(s). EWA Publishing and/or the editor(s) disclaim responsibility for any injury to people or property resulting from any ideas, methods, instructions or products referred to in the content.
About volume
Volume title: Proceedings of the 2nd International Conference on Financial Technology and Business Analysis
© 2024 by the author(s). Licensee EWA Publishing, Oxford, UK. This article is an open access article distributed under the terms and
conditions of the Creative Commons Attribution (CC BY) license. Authors who
publish this series agree to the following terms:
1. Authors retain copyright and grant the series right of first publication with the work simultaneously licensed under a Creative Commons
Attribution License that allows others to share the work with an acknowledgment of the work's authorship and initial publication in this
series.
2. Authors are able to enter into separate, additional contractual arrangements for the non-exclusive distribution of the series's published
version of the work (e.g., post it to an institutional repository or publish it in a book), with an acknowledgment of its initial
publication in this series.
3. Authors are permitted and encouraged to post their work online (e.g., in institutional repositories or on their website) prior to and
during the submission process, as it can lead to productive exchanges, as well as earlier and greater citation of published work (See
Open access policy for details).
References
[1]. Luis filipe Silva Moreira. Coca-Cola: Difficult To Mask Its Bitter Aftertaste. (2019, January 3). Https://Seekingalpha.Com/. https://seekingalpha.com/article/4231182-coca-cola-difficult-to-mask-bitter-aftertaste
[2]. Dhar, T., Chavas, J.-P., Cotterill, R. W., & Gould, B. W. An Econometric Analysis of Brand-Level Strategic Pricing Between Coca-Cola Company and PepsiCo. Journal of Economics Management Strategy, 14(4), 905–931. (2005).
[3]. Muniz, F., Guzmán, F., Paswan, A. K., & Crawford, H. J. The immediate effect of corporate social responsibility on consumer-based brand equity. Journal of Product & Brand Management. (2019).
[4]. Tien, N. H., Anh, D. B. H., & Ngoc, N. M. Corporate financial performance due to sustainable development in Vietnam. Corporate Social Responsibility and Environmental Management, 27(2), 694-705. (2020).
[5]. Coca-Cola Business And Sustainability Report. Coca-Cola. (2019).
[6]. Annual Report 2019. Pepsi. (2020).
[7]. Annual Report 2020. Pepsi. (2021).
[8]. Annual Report 2021. Pepsi. (2022).
[9]. Annual Report 2019. The Coca-Cola Company. (2020).
[10]. Annual Report 2020. The Coca-Cola Company. (2021).
[11]. Annual Report 2021. The Coca-Cola Company. (2022).