


1. Introduction
The stock market has long been acknowledged as a pivotal indicator of a nation's economic condition, with fluctuations in stock prices serving as a reflection of financial activities among industries and enterprises as well as the overall market sentiment [1]. As such, it plays a vital role in economic analysis and forecasting. Over time, China's stock market has witnessed a gradual rise in its economic significance, accompanied by a notable increase in the proportion of retail investors. By the year 2022, retail investors constituted approximately 60% of the total investor base in China [2]. However, this demographic of retail investors tends to exhibit shorter investment horizons, emotional biases, and a lack of in-depth financial knowledge, making them more sensitive to short-term policy changes. The prevalence of several trading restrictions and the profound influence of market information and government policies have contributed to a heightened probability of irrational trading behavior in the stock market [3]. As a result, factors such as the predominance of retail investors, stringent trading mechanisms, and susceptibility to policy-driven influences have rendered China's stock market more prone to emotional and irrational trading, resulting in frequent market turbulence. The current landscape is characterized by complex international dynamics and an imperative need for economic structural transformation, leading to policy uncertainty escalations. This internal policy uncertainty has already exerted discernible effects on the financial market, with external policy uncertainty further exacerbating market volatility. Heightened uncertainty in economic policy can significantly influence the decision-making process and psychology of economic agents, particularly investors, affecting their expectations regarding future asset returns and risks [4]. As China's financial market system continues to evolve, further refinement is necessary. Moreover, the predominant presence of individual investors in China's stock market renders it susceptible to herd behavior. Consequently, exploring the impact of economic policy uncertainty on stock market returns from the vantage point of investor sentiment holds profound practical implications. In this study, we employ the bootstrap analysis technique to examine the potential role of investor sentiment as a mediator in the intricate relationship between policy uncertainty and stock market returns. Through this endeavor, we aim to provide valuable insights into China's financial market dynamics and its response to policy uncertainties.
2. Literature Review
2.1. The Impact of Economic Policy Uncertainty on Stock Market Returns: A Comprehensive Review
Economic policy adjustments play are pivotal in shaping economic development, providing a necessary regulatory mechanism. However, economic policy uncertainty emerges when economic actors cannot accurately anticipate if, when, and how the government will alter existing economic policies [5]. Numerous factors influence the stability of the stock market, with policy-related factors deemed among the most influential [6].
However, consensus remains elusive within the academic community regarding the relationship between excessive economic policy adjustments and stock market dynamics. Some scholars approach this issue from a risk-return perspective and construct government policy choice models for investigation. They posit that frequent changes in economic policies can be viewed as undiversifiable risks [7]. The implementation of policies with frequent modifications can lead to asset value volatility in financial markets and significantly heighten investment risk, thus motivating investors to seek higher returns. As the degree of economic policy uncertainty escalates, stock market fluctuations witness a notable increase, yielding more pronounced effects on the market's long-term volatility [8].
Conversely, contrasting viewpoints exist, positing that a higher frequency of economic policy adjustments correlates with lower stock market returns, revealing a significant negative association. This phenomenon may be attributed to frequent policy changes triggering market uncertainty, inducing reduced investor confidence, and consequently influencing stock market performance [9].
Despite ongoing debate, the dynamics of economic policy uncertainty's impact on stock market returns remain an important and active area of research, urging further inquiry for a comprehensive understanding.
2.2. The Definition and Measurement of Investor Sentiment
In past research, there has been some controversy regarding the definition of investor sentiment, with scholars offering various perspectives on its nature. Some scholars consider investor sentiment to be the process by which investors form beliefs and values that deviate from their subjective expectations [10]. On the other hand, Baker and Wurgler define investor sentiment as speculative beliefs formed by traders based on expected returns and risks [11]. Lee, Sheleifer, and Thaler suggest that investor irrational emotions lead to cognitive biases in investment decisions [12], while Brown and Cliff propose that investor sentiment represents optimistic or pessimistic deviations in expectations regarding future stock price changes [13]. In essence, investor sentiment can be understood as optimistic or pessimistic expectations of uncertain future returns.
To investigate the impact of investor sentiment, many scholars use proxies that closely align with actual market conditions. These indicators can be categorized as direct, indirect, and composite. Direct indicators are obtained by directly surveying investor sentiment, while indirect indicators are constructed by analyzing market trading data to reflect investor sentiment. Composite indicators are synthesized to comprehensively measure investor sentiment. For instance, researchers have utilized PCA (Principal Component Analysis) to synthesize the BW index, representing investor sentiment, based on six indicators, including the IPO initial return.
Yi and Mao constructed the CICSI index by selecting six indicators, including the IPO quantity and the first-day return, and using PCA to measure investor sentiment [14]. Wei et al. also used PCA to construct the ISI index, based on six indicators including IPO first-day returns and issuance quantity, to gauge trader sentiment [15]. In various studies, CICSI and ISI indices have frequently been employed as readily available indicators of Chinese investor sentiment.
In conclusion, investor sentiment plays a vital role in financial markets. Defining and selecting appropriate proxy indicators for investor sentiment are critical factors to consider in research. Economic policies implemented by governments significantly influence investor sentiment, while changes in investor sentiment, in turn, impact the stock market. Therefore, delving into the relationship between investor sentiment and economic policy uncertainty holds essential significance for understanding financial market behavior.
H0: There is a mediation effect of investor sentiment on the relationship between economic policy uncertainty and stock market returns.
3. Data & Methodology
3.1. Data
The analysis in this study covers the monthly data from January 2010 to February 2023.
Dependent Variable
The Shanghai Shenzhen 300 Index (CSI300) is a composite index jointly compiled by the Shanghai Stock Exchange and the Shenzhen Stock Exchange. It includes 300 A-share stocks with relatively large market capitalization and good liquidity. The CSI300 is an important benchmark in the Chinese A-share market and is widely used to gauge the overall performance of the Chinese stock market [16]. Therefore, we select the CSI300 as the variable representing stock market performance.
Independent Variable
The Economic Policy Uncertainty Index (EPU) is an indicator that measures the level of uncertainty surrounding national economic policies [17]. The calculation of this index is based on data from three sources: media reports, policy documents, and economist surveys. The Chinese Economic Policy Uncertainty Index aims to reflect the level of uncertainty regarding the direction and extent of economic policies in China. Through this index, investors, researchers, and policymakers can gain insights into the level of economic policy uncertainty in China, facilitating a better understanding of market dynamics and decision-making environments.
Mediator
This study refers to the widely influential work of Wei et al. and uses the Principal Component Analysis (PCA) method to select six proxy variables, including the Discount on Closed-end Funds (DCEF), turnover rate (turn), the number of new account openings (nia), initial public offering (IPO) first-day returns (ipor), IPO quantity (IPON), and Consumer Confidence Index (CCI) [15]. These variables are collected for the current period and with one-lagged observations to construct the Investor Sentiment (IS) as a mediator variable. The analysis is conducted using STATA.
Table 1: Matrix of correlations.
Variables | (1) | (2) | (3) | (4) | (5) | (6) | (7) | (8) | (9) | (10) | (11) | (12) | (13) |
(1) dcef | 1.000 | ||||||||||||
(2) cci | -0.445 | 1.000 | |||||||||||
(3) turn | 0.260 | 0.000 | 1.000 | ||||||||||
(4) ipon | 0.232 | 0.134 | 0.228 | 1.000 | |||||||||
(5) ipor | -0.050 | 0.234 | 0.159 | 0.379 | 1.000 | ||||||||
(6) nia | 0.105 | 0.278 | 0.723 | 0.512 | 0.261 | 1.000 | |||||||
(7) numdate | 0.051 | 0.360 | 0.196 | 0.375 | 0.331 | 0.377 | 1.000 | ||||||
(8) dcef_lag | 0.924 | -0.445 | 0.262 | 0.195 | -0.049 | 0.098 | 0.057 | 1.000 | |||||
(9) cci_lag | -0.446 | 0.948 | 0.014 | 0.149 | 0.240 | 0.302 | 0.383 | -0.437 | 1.000 | ||||
(10) turn_lag | 0.271 | -0.009 | 0.748 | 0.138 | 0.066 | 0.565 | 0.199 | 0.258 | -0.007 | 1.000 | |||
(11) ipon_lag | 0.231 | 0.143 | 0.268 | 0.693 | 0.272 | 0.525 | 0.363 | 0.223 | 0.132 | 0.230 | 1.000 | ||
(12) ipor_lag | -0.066 | 0.253 | 0.291 | 0.405 | 0.326 | 0.322 | 0.330 | -0.049 | 0.242 | 0.160 | 0.375 | 1.000 | |
(13) nia_lag | 0.090 | 0.261 | 0.560 | 0.453 | 0.204 | 0.804 | 0.372 | 0.100 | 0.274 | 0.724 | 0.514 | 0.260 | 1.000 |
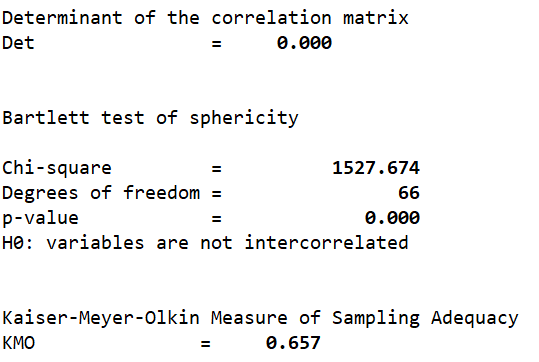
Figure 1: The result of Kaiser-Meyer-Olkin and Bartlett test.
From Figure 1, it can be observed that the Kaiser-Meyer-Olkin (KMO) value is 0.657, indicating that there is a certain level of correlation among the selected proxy variables for investor sentiment. This justifies the use of factor analysis. Additionally, Bartlett's test of sphericity shows a Chi-square value of 1527.674 with 66 degrees of freedom, and the associated probability value is 0.000, which is less than 0.01. This significant result leads us to reject the null hypothesis (H0) in the test of sphericity, implying that the chosen proxy indicators are suitable for conducting principal component analysis.
Principal Component Analysis (PCA) is employed to extract relevant factors, and the criteria for factor extraction are based on eigenvalues. Factors with eigenvalues greater than 1 are considered significant, as they effectively retain information and preserve non-rational components in the component matrix. These factors will be included in the construction of the investor sentiment index as the proxy matrix for investor sentiment.
Table 2: Factor analysis using principal-component factors.
Factor | Eigenvalue | Difference | Proportion | Cumulative |
Factor1 | 4.169 | 1.167 | 0.347 | 0.347 |
Factor2 | 3.002 | 1.529 | 0.250 | 0.598 |
Factor3 | 1.473 | 0.598 | 0.123 | 0.720 |
Factor4 | 0.874 | 0.129 | 0.073 | 0.793 |
Factor5 | 0.746 | 0.080 | 0.062 | 0.855 |
Factor6 | 0.665 | 0.292 | 0.055 | 0.911 |
Factor7 | 0.373 | 0.081 | 0.031 | 0.942 |
Factor8 | 0.293 | 0.070 | 0.024 | 0.966 |
Factor9 | 0.222 | 0.142 | 0.018 | 0.985 |
Factor10 | 0.080 | 0.025 | 0.007 | 0.991 |
Factor11 | 0.055 | 0.006 | 0.005 | 0.996 |
Factor12 | 0.048 | . | 0.004 | 1.000 |
LR test: independent vs. saturated: chi2(66) = 1537.78 Prob>chi2 = 0.0000 | ||||
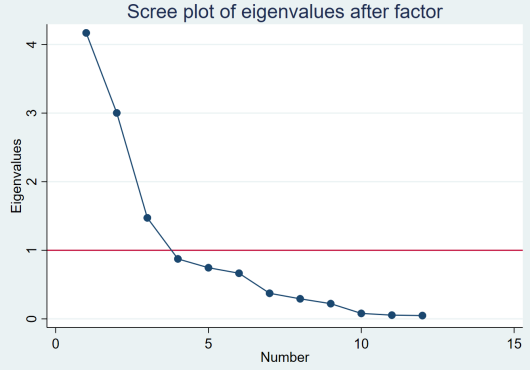
Figure 2: Scree plot.
In Table 2 and Figure 2, it is evident that extracting Factors 1 to 3 as the sentiment factors is more appropriate. This is because the eigenvalues of the first three factors are all greater than 1, indicating their significant contribution to the original variables. Additionally, the cumulative percentage of variance explained by these three factors accounts for 72.03% of the total variance, which further supports their significance in representing investor sentiment.
Table 3: Scoring coefficients based on promax(3) rotated factors.
Variable | Factor1 | Factor2 | Factor3 |
dcef | 0.069 | -0.273 | 0.135 |
cci | 0.061 | 0.280 | -0.021 |
turn | 0.178 | -0.067 | -0.292 |
ipon | 0.162 | 0.008 | 0.386 |
ipor | 0.095 | 0.089 | 0.276 |
nia | 0.211 | 0.033 | -0.131 |
dcef_lag | 0.067 | -0.272 | 0.128 |
cci_lag | 0.063 | 0.279 | -0.026 |
turn_lag | 0.166 | -0.078 | -0.379 |
ipon_lag | 0.168 | -0.003 | 0.307 |
ipor_lag | 0.119 | 0.087 | 0.209 |
nia_lag | 0.204 | 0.026 | -0.184 |
The relationship between the Investor Sentiment (IS) composite index and the principal components can be expressed as follows:
IS=0.4823*Factor 1+0.3473*Factor 2+0.1703*Factor 3 (1)
Control variable
To mitigate the potential influence of other latent variables on the model, this study includes the following variables as control variables: the broad measure of money supply, the term deposit rate of 1 year, the total deposit balance year-on-year, the short-term lending rate of 6 months, and the producer's Price Index year-on-year. The specific details of these variables can be found in Table 4.
Table 4: All variables.
Variable Type | Variable Name | Sign | Source |
Dependent variable | Shanghai and shenzhen 300 | CSI300 | China Stock Market & Accounting index Research (CSMAR) Database |
independent variable | China Economic Policy Uncertainty index | lEPU | CEIC DataBase(EPU) and logarithmically transformed |
Mediator | Investor sediment | IS | Principal components analysis |
Control Variables | Broad measure of money | M2 | CSMAR Database |
Term Deposit Rate of 1 year | Drate | The People's Bank Of China | |
Total Deposits Balance year-on-year | Debt | The People's Bank Of China | |
Short term lending rate of 6 months | Short | The People's Bank Of China | |
Producer's Price Index year-on- year | PPI | National Bureau of Statistics of China |
3.2. Methodology
In order to investigate whether economic policy uncertainty affects stock market returns through the mediation of investor sentiment, this study adopts an intermediary model. The mediation effect refers to the internal mechanism through which the independent variable (lEPU) exerts its influence on the dependent variable (CSI300) by first affecting the mediator variable (IS), and then the mediator variable subsequently impacts the dependent variable. A series of control variables (X) are also included.
\( CSI300={b_{0}}+{b_{1}}*lEPU+{b_{2}}*X+e \) model 1
\( IS={b_{0}}+{b_{1}}*lEPU+{b_{2}}*X+e \) model 2
\( CSI300={b_{0}}+{b_{1}}*lEPU+{b_{2}}*IS+{b_{3}}*X+e \) model 3
This study employs a method proposed by Chen Rui in 2013, using bootstrap testing to examine the mediation effect. Bootstrap testing involves repeatedly resampling the sample to estimate the significance of the mediation effect [18]. By comparing the observed value with the distribution generated from the bootstrap samples, this analysis aims to verify whether economic policy uncertainty indirectly affects stock market returns through its influence on investor sentiment.
4. Result
4.1. Descriptive Statistical Analysis
Table 5: The summary of all variables.
Variable | Obs | Mean | Std. dev. | Min | Max |
CSI300 | 158 | 3472.58 | 843.4108 | 2147.06 | 5559.2 |
lEPU | 158 | 5.498451 | .6636722 | 4.084987 | 6.747648 |
IS | 157 | 4.45e-11 | .6281348 | -1.206845 | 2.333378 |
M2 | 158 | 1.53e+14 | 5.90e+13 | 6.26e+13 | 2.76e+14 |
Drate | 158 | 2.098101 | .7437829 | 1.5 | 3.5 |
Debt | 158 | 14.09291 | 2.603908 | 10.9 | 29.31 |
Short | 158 | 4.856899 | .6378126 | 4.35 | 6.1 |
PPI | 158 | 1.474177 | 4.534297 | -5.95 | 13.5 |
Based on the statistical data from Table 5, the average value of the CSI300 is 3472.58, indicating that the overall performance of the A-share market remained relatively stable during the sample period. However, the large standard deviation (843.4108) suggests high market volatility, possibly influenced by multiple factors, including policy-related elements. The average value of lEPU is 5.498, with a standard deviation of 0.6638, indicating that economic policy experienced some fluctuations during the sample period. Economic policy uncertainty may impact the decisions of businesses and investors, leading to increased market volatility.
The IS (Investor Sentiment) index is close to zero, suggesting relatively stable investor sentiment during the sample period. However, the large standard deviation (0.6281348) indicates that investor sentiment may have experienced significant fluctuations at different time periods. Such fluctuations in investor sentiment may be closely related to changes in policies and market expectations.
4.2. The Mediation Effect Test
Table 6: The results of Mediation tests.
Sobel-Goodman Mediation Tests | Est | Std_err | Z | P>|Z| | ||
Sobel | 169.721 | 66.171 | 2.565 | 0.010 | ||
Aroian | 169.721 | 66.377 | 5.557 | 0.011 | ||
Goodman | 169.721 | 65.964 | 2.573 | 0.010 | ||
Indirect, Direct, and Total Effects | Est | Std_err | Z | P>|Z| | ||
a_coefficient | 0.239 | 0.091 | 2.622 | 0.009 | ||
b_coefficient | 710.677 | 57.374 | 12.387 | 0.000 | ||
Indirect_effect_aXb | 169.721 | 66.171 | 2.565 | 0.010 | ||
Direct_effect_c’ | -364.766 | 65.458 | -5.572 | 0.000 | ||
Total_effect_c | -195.045 | 90.888 | -2.146 | 0.032 | ||
Proportion of total effect that is mediated: | -0.870 | |||||
Ratio of indirect to direct effect: | -0.465 | |||||
Ratio of total to direct effect: | 0.535 | |||||
This value of -0.870 indicates that a significant portion (87.0%) of the total effect of economic policy uncertainty on Stock return is mediated through the three principal components. Investment sediment.
The ratio of indirect to direct effect (-0.465) shows that the indirect effect of economic policy uncertainty on Stock return through the mediator variable is approximately 46.5% of the direct effect.
The ratio of total to direct effect (0.535) indicates that the total effect of economic policy uncertainty on Stock return, considering both direct and indirect pathways, is approximately 53.5% of the direct effect.
Table 7: The results of Bootstrap.
Observed coefficient | Bias | Bootstrap Std.err. | [95% conf.interval] | |||
_bs_1 | 169.72088 | -0.5310767 | 54.172807 | 70.52168 | 282.6707 | (P) |
_bs_2 | -364.76551 | 0.0652512 | 73.393259 | -502.9655 | -221.2424 | (P) |
_bs_3 | -195.04463 | -0.4658252 | 92.58657 | -373.3211 | -3.754915 | (P) |
Based on the bootstrap results in Table 7, the confidence interval for the indirect effect analysis does not include 0, indicating a significant mediation effect. The presence of a significant mediation effect suggests that there is a mediation effect of investor sentiment on the relationship between economic policy uncertainty and stock market returns. Therefore, Hypothesis 1 is supported.
5. Conclusion
The findings of this study offer valuable insights into the mediating role of investor sentiment in the relationship between economic policy uncertainty and stock market returns. The results support the hypothesis that investor sentiment acts as a mediator in this relationship, shedding light on the underlying mechanisms through which economic policy uncertainty influences stock market performance. The study underscores the significance of considering investor sentiment when formulating and adjusting economic policies. As investor sentiment plays a pivotal role in driving stock market fluctuations, policymakers must carefully consider its potential impact to prevent market panics and ensure financial market stability during policy adjustments. Moreover, the study provides important recommendations for individual investors. Given the relatively low level of financial literacy among investors and their susceptibility to emotions and diverse sources of information, it is imperative for investors to engage in rational decision-making. The government can utilize internet platforms to disseminate accurate financial information and foster a sound value system to guide investors in making well-informed choices. Nevertheless, it is essential to acknowledge certain limitations in the study. The research did not delve into the specific stages of the mediating effect of investor sentiment on the relationship between economic policy uncertainty and stock market returns. Further investigation is warranted to explore the short-term and long-term impacts of investor sentiment as a mediator within this context. Additionally, the study did not analyze the potential variations in the mediating effect of investor sentiment between bullish and bearish market conditions.
References
[1]. Bosworth, B., Hymans, S., & Modigliani, F. (1975). The stock market and the economy. Brookings Papers on Economic Activity, 1975(2), 257-300.
[2]. Zhou, W., & Zhen, S. (2023). Analysis: China retail investors from Gen-Z to retirees sit out Stock Rally. Reuters. https://www.reuters.com/markets/asia/china-retail-investors-gen-z-retirees-sit-out-stock-rally-2023-02-15/
[3]. Daniel, K., Hirshleifer, D., & Teoh, S. H. (2002). Investor psychology in capital markets: Evidence and policy implications. Journal of monetary economics, 49(1), 139-209.
[4]. Rodrik, D. (1991). Policy uncertainty and private investment in developing countries. Journal of Development Economics, 36(2), 229-242.
[5]. Campello, M., Graham, J. R., & Harvey, C. R. (2010). The real effects of financial constraints: Evidence from a financial crisis. Journal of Financial Economics, 97(3), 470-487.
[6]. Pastor, L., & Veronesi, P. (2012). Uncertainty about government policy and stock prices. The Journal of Finance, 67(4), 1219-1264.
[7]. Pástor, Ľ., & Veronesi, P. (2013). Political uncertainty and risk premia. Journal of Financial Economics, 110(3), 520-545.
[8]. Baker, S. R., & Bloom, N. (2013). Does uncertainty reduce growth? Using disasters as natural experiments (No. w19475). National Bureau of Economic Research
[9]. Baker, S. R., Bloom, N., & Davis, S. J. (2016). Measuring economic policy uncertainty. The Quarterly Journal of Economics, 131(4), 1593-1636.
[10]. Shleifer, A. (2000). Inefficient markets: An introduction to behavioural finance. Oup Oxford.
[11]. Baker, M., & Wurgler, J. (2006). Investor sentiment and the cross‐section of stock returns. The Journal of Finance, 61(4), 1645-1680.
[12]. Lee, C. M., Shleifer, A., & Thaler, R. H. (1991). Investor sentiment and the closed‐end fund puzzle. The Journal of Finance, 46(1), 75-109.
[13]. Brown, G. W., & Cliff, M. T. (2004). Investor sentiment and the near-term stock market. Journal of Empirical Finance, 11(1), 1-27.
[14]. Yi, Z., & Mao, N. (2009). Research on the measurement of Chinese stock market investor sentiment: Construction of CICSI. Financial Research, (11), 174-184.
[15]. Wei, X., Xia, W., & Sun, T. (2014). A research on the measurement of A-share market investor sentiment based on the BW model. Management Observation, (33), 71-73.
[16]. Wan, X., Zhang, Z., Zhang, C., & Meng, Q. (2020). Stock market temporal complex networks construction, robustness analysis, and systematic risk identification: a case of CSI 300 index. Complexity, 2020, 1-19.
[17]. (Čižmešija, M., Lolić, I., & Sorić, P. (2017). Economic policy uncertainty index and economic activity: what causes what?. Croatian Operational Research Review, 563-575.
[18]. Chen R, Zheng YH, & Liu W. (2013). Mediating effect analysis: principle, procedure, bootstrap method and its application. Journal of Marketing Science (4), 16.
Cite this article
Huang,L. (2023). The Impact of China Economic Policy Uncertainty on CSI 300: An Analysis of the Mediating Effect of Investor Sentiment. Advances in Economics, Management and Political Sciences,51,41-49.
Data availability
The datasets used and/or analyzed during the current study will be available from the authors upon reasonable request.
Disclaimer/Publisher's Note
The statements, opinions and data contained in all publications are solely those of the individual author(s) and contributor(s) and not of EWA Publishing and/or the editor(s). EWA Publishing and/or the editor(s) disclaim responsibility for any injury to people or property resulting from any ideas, methods, instructions or products referred to in the content.
About volume
Volume title: Proceedings of the 2nd International Conference on Financial Technology and Business Analysis
© 2024 by the author(s). Licensee EWA Publishing, Oxford, UK. This article is an open access article distributed under the terms and
conditions of the Creative Commons Attribution (CC BY) license. Authors who
publish this series agree to the following terms:
1. Authors retain copyright and grant the series right of first publication with the work simultaneously licensed under a Creative Commons
Attribution License that allows others to share the work with an acknowledgment of the work's authorship and initial publication in this
series.
2. Authors are able to enter into separate, additional contractual arrangements for the non-exclusive distribution of the series's published
version of the work (e.g., post it to an institutional repository or publish it in a book), with an acknowledgment of its initial
publication in this series.
3. Authors are permitted and encouraged to post their work online (e.g., in institutional repositories or on their website) prior to and
during the submission process, as it can lead to productive exchanges, as well as earlier and greater citation of published work (See
Open access policy for details).
References
[1]. Bosworth, B., Hymans, S., & Modigliani, F. (1975). The stock market and the economy. Brookings Papers on Economic Activity, 1975(2), 257-300.
[2]. Zhou, W., & Zhen, S. (2023). Analysis: China retail investors from Gen-Z to retirees sit out Stock Rally. Reuters. https://www.reuters.com/markets/asia/china-retail-investors-gen-z-retirees-sit-out-stock-rally-2023-02-15/
[3]. Daniel, K., Hirshleifer, D., & Teoh, S. H. (2002). Investor psychology in capital markets: Evidence and policy implications. Journal of monetary economics, 49(1), 139-209.
[4]. Rodrik, D. (1991). Policy uncertainty and private investment in developing countries. Journal of Development Economics, 36(2), 229-242.
[5]. Campello, M., Graham, J. R., & Harvey, C. R. (2010). The real effects of financial constraints: Evidence from a financial crisis. Journal of Financial Economics, 97(3), 470-487.
[6]. Pastor, L., & Veronesi, P. (2012). Uncertainty about government policy and stock prices. The Journal of Finance, 67(4), 1219-1264.
[7]. Pástor, Ľ., & Veronesi, P. (2013). Political uncertainty and risk premia. Journal of Financial Economics, 110(3), 520-545.
[8]. Baker, S. R., & Bloom, N. (2013). Does uncertainty reduce growth? Using disasters as natural experiments (No. w19475). National Bureau of Economic Research
[9]. Baker, S. R., Bloom, N., & Davis, S. J. (2016). Measuring economic policy uncertainty. The Quarterly Journal of Economics, 131(4), 1593-1636.
[10]. Shleifer, A. (2000). Inefficient markets: An introduction to behavioural finance. Oup Oxford.
[11]. Baker, M., & Wurgler, J. (2006). Investor sentiment and the cross‐section of stock returns. The Journal of Finance, 61(4), 1645-1680.
[12]. Lee, C. M., Shleifer, A., & Thaler, R. H. (1991). Investor sentiment and the closed‐end fund puzzle. The Journal of Finance, 46(1), 75-109.
[13]. Brown, G. W., & Cliff, M. T. (2004). Investor sentiment and the near-term stock market. Journal of Empirical Finance, 11(1), 1-27.
[14]. Yi, Z., & Mao, N. (2009). Research on the measurement of Chinese stock market investor sentiment: Construction of CICSI. Financial Research, (11), 174-184.
[15]. Wei, X., Xia, W., & Sun, T. (2014). A research on the measurement of A-share market investor sentiment based on the BW model. Management Observation, (33), 71-73.
[16]. Wan, X., Zhang, Z., Zhang, C., & Meng, Q. (2020). Stock market temporal complex networks construction, robustness analysis, and systematic risk identification: a case of CSI 300 index. Complexity, 2020, 1-19.
[17]. (Čižmešija, M., Lolić, I., & Sorić, P. (2017). Economic policy uncertainty index and economic activity: what causes what?. Croatian Operational Research Review, 563-575.
[18]. Chen R, Zheng YH, & Liu W. (2013). Mediating effect analysis: principle, procedure, bootstrap method and its application. Journal of Marketing Science (4), 16.