


1. Introduction
The global economy has been profoundly impacted by the far-reaching consequences of both the COVID-19 pandemic and the Russia-Ukraine conflict, culminating in a severe economic recession. Central banks around the world have been compelled to adopt aggressive monetary policies to stimulate economic growth. However, the resulting disruption in the supply chain has posed a new challenge for the United States government in the form of inflation. Since May 2020, the U.S. Consumer Price Index (CPI) has been continuously escalating, reaching a staggering 9.1% year-on-year growth in June 2022, the highest in 41 years, while GDP growth has remained at a relatively low level.
Figure 1: CPI from 2020 to 2022. |
Data source: Wind |
Photo credit: Original |
Starting from March 2022, the Federal Reserve has accelerated the tightening of its monetary policy. As of July 26, 2023, there have been 11 consecutive interest rate hikes, totaling 525 basis points—an unprecedented frequency and magnitude in history. In the monetary policy meeting held on July 26, 2023, the Federal Reserve made the announcement of a 25-basis-point increase in the interest rate. Consequently, the target range for the federal funds rate has been raised from 0%-0.25% to 5.25%-5.50%.
Figure 2: Federal funds rate from 2012 to 2023. |
Data source: Wind |
Photo credit: Original |
Previous research has indicated that the Federal Reserve's aggressive interest rate hikes have had significant repercussions on the global economy.
Firstly, several central banks around the world mimicked the United States by raising interest rates, which increased financing costs and suppressed corporate valuations. Consumers are also greatly affected by the increased cost of borrowing, leading to a decline in consumption and a dampening of forward spending, thereby further weakening the market economy [1]. Secondly, this attracted a flow of dollars back to the United States, triggering capital outflows from other countries and amplifying systemic financial risks in developing economies. Jeongsim Kim point that foreign investors have continued to withdraw from the South Korean stock market following the interest rate hikes by the Federal Reserve [2]. Thirdly, the appreciation of the U.S. dollar placed a substantial burden on economies burdened with dollar-denominated debt, making debt repayment increasingly challenging, especially for emerging economies seeking financing from international financial markets [3].
Divergence emerges in the choice of monetary policies between China and the United States. The Federal Reserve has entered a tightening cycle, while China faces increasing expectations for interest rate cuts. Therefore, the monetary policy of the Federal Reserve primarily affects China's stock market through two channels.
Firstly, the international capital flow channel. As the yields on US government bonds rise, the returns on US dollar-denominated assets increase, attracting international capital inflows into the United States, including those invested in the Chinese stock market. In the short term, this leads to increased outflows from the Chinese stock market, resulting in market volatility. According to the capital flow report published by the US Treasury in August 2022, foreign investors held an additional $185 billion of US long-term securities [4], marking nearly 8 consecutive months of net inflows.
Secondly, the investor confidence and expectation channel. Chen Xiaotan and Zheng Zhiwen believe that the Chinese stock market is increasingly influenced by international events, fostering a tighter connection with the international financial markets [5]. The Federal Reserve's interest rate hikes directly impact the confidence of US investors and indirectly influence the confidence of Chinese investors [6], thereby affecting the trading situation in the Chinese stock market.
The aim of this study is to explore the impact of the Federal Reserve's unconventional monetary policy, particularly aggressive interest rate hikes, on China's gradually opening financial markets and economic order. The research seeks to investigate whether significant spillover effects occur and to explore the transmission mechanisms involved. The study carries significant practical significance as it not only provides theoretical support for the prevention of systemic risks in China's financial system but also offers suggestions for improving regulatory mechanisms to address global financial shocks in our financial markets. Furthermore, it provides practical guidance for policymakers and investors.
Following the Introduction, Section2 will cover the data source, data stability, and models setting in this paper. After that, Section3 will conduct an ARIMA model analysis using the data obtained. The result of empirical research will be employed to validate whether the rate hikes by the Federal Reserve have spillover effects on the Chinese stock market. The forthcoming discussion will center on elucidating the objective and significance of the study from the perspectives of policymakers and investors. Lastly, this study aims to draw conclusions and provide recommendations for fostering the healthy growth of the Chinese stock market.
2. Model Setting, Variable Selection, And Data Description
2.1. Data Source
With its inclusion of over 3,000 stocks listed on the Nasdaq Stock Exchange, The NASDAQ Composite index not only serves as indicator of investor sentiment but also potentially reflects the health of the broader economy [7]. The Shanghai Composite Index (SSEC) stands as one of the prime stock market indices in China. As of August 1, 2023, the SSEC comprises a total of 1,476 listed stocks, serving as a key benchmark of the Chinese stock market [8]. Therefore, the paper selects the SSEC and NASDAQ as representative benchmarks of the Chinese and American stock markets, respectively. The study collected daily, weekly, and monthly closing prices of both indices from January 1, 2016, to July 26, 2023, using the Wind financial terminal. To present numerical data encompassing a broad spectrum of values succinctly, the data is transformed using the formula \( ln{(1+x)} \) . Due to the closure of stock markets by the government on certain holidays or events, the trading hours of stock markets in China and the United States are not synchronized. These non-trading days will be disregarded. Based on the edited data, STATA will be utilized to conduct further exploratory data analysis and model building.
2.2. Weak Stationarity Test
Before analyzing the data, it is imperative to conduct a test for stationarity. The stationary tests for indices series are displayed in Table 1, the study employed Augmented Dickey and Fuller (1979)–ADF test. Based on the displayed results, the p-values for the Nasdaq daily, weekly, and monthly closing prices, as well as the SSEC daily, weekly, and monthly closing prices, all amount to 0. Hence, the evidence is substantial enough to reject the null hypothesis that the variable possesses a unit root. The model is deemed valid, and the data are considered stationary.
Table 1: Weak stationarity test.
Panel A: Nasdaq | t | p |
Daily | ||
Raw | -2.609 | 0.2756 |
1st order difference | -29.268 | 0.0000 |
Weekly | ||
Raw | -2.639 | 0.2621 |
1st order difference | -13.226 | 0.0000 |
Monthly | ||
Raw | -2.309 | 0.4287 |
1st order difference | -6.433 | 0.0000 |
2nd order difference | -9.868 | 0.0000 |
Panel B: SSEC | t | p |
Daily | ||
Raw | -3.060 | 0.1161 |
1st order difference | -29.637 | 0.0000 |
Weekly | ||
Raw | -2.266 | 0.4526 |
1st order difference 2nd order difference | -12.831 -21.474 | 0.0000 0.0000 |
Monthly | ||
Raw | -2.658 | 0.2538 |
1st order difference | -7.359 | 0.0000 |
2nd order difference | -11.133 | 0.0000 |
2.3. ARIMA Model
ARIMA (Autoregressive Integrated Moving Average) is a statistical analysis model that uses time series data to either better to predict future trends [9]. ARIMA models are widely used for real-life time series analysis since most time series data are non-stationary and need differencing [10] and perform well on short-term forecasts.
\( {Index_{t}}=c+{∅_{1}}{Index_{t-1}}+{∅_{2}}{Index_{t-2}}+...+{∅_{p}}{Index_{t-p}}+{ε_{t}} \) (1)
From equation (1) above is AutoRegressive(AR), a regression model with lagged values of Index, until p-th time in the past, as predictors and \( ε \) t represents white noise.
\( {Index_{t}}=c+{{ε_{t}}+θ_{1}}{ε_{t-1}}+{θ_{2}}{ε_{t-2}}+...+{θ_{q}}{ε_{t-q}} \) | (2) |
Equation (2) represents Moving Average (MA), In this model, a regression-like approach is employed to analyze past forecast errors. Within this framework, ε represents white noise at time t, c denotes a constant, and θs represent parameters.
The process involves differencing the original series d times until it achieves stationarity. Combining AR and MR models and Integrated(d), a common representation of ARIMA could be formulate as:
\( {Index_{t}}=c+{∅_{1}}{Index_{t-1}}+{∅_{2}}{Index_{t-2}}+...+{∅_{p}}{Index_{t-p}}+{θ_{1}}{ε_{t-1}}+{θ_{2}}{ε_{t-2}}+...+{θ_{q}}{ε_{t-q}}+{ε_{t}} \) | (3) |
The study utilizes the autoregressive (AR) model to predict potential price fluctuations in the Nasdaq and SSEC indices, capturing the trends in the stock markets of the United States and China. It assumes the absence of any interest rate hike by the Federal Reserve and relies on historical returns from the two indices. On the other hand, the moving average (MA) model incorporates an error term to forecast future prices. The forecasting period only spans from March 16, 2022, the date of the first interest rate hike by the Federal Reserve, to August 1, 2022. Consequently, the forecast horizon is relatively short, minimizing any potential impact on the accuracy of the predictions.
3. Empirical Results and Analysis
3.1. Intuitive Data Analysis
In the year 2022, the Federal Reserve implemented a series of seven interest rate hikes, thereby making adjustments to the targeted range for the federal funds rate, which now stands at 4.25% to 4.50%. By observing the market reactions following each rate hike, it can be observed that both the trading volume and turnover of the Shanghai Stock Exchange Composite Index (SSEC) experienced a decline. The most significant decrease occurred after March 16th. However, in the medium to long term, the SSEC began to rise again after a brief decline. It is apparent that while each interest rate increase initiated by the Federal Reserve has spillover effect on the Chinese stock market, over the medium to long term, the market in China gradually assimilates and alleviates these influences.
SSEC Trading Volume (In 10,000 shares) | SSEC Transaction Volume (In ten thousand yuan) |
Figure 3: SSEC Trading situation. | |
Photo credit: Original | |
3.2. Econometric Empirical Analysis
3.2.1. Order Differencing
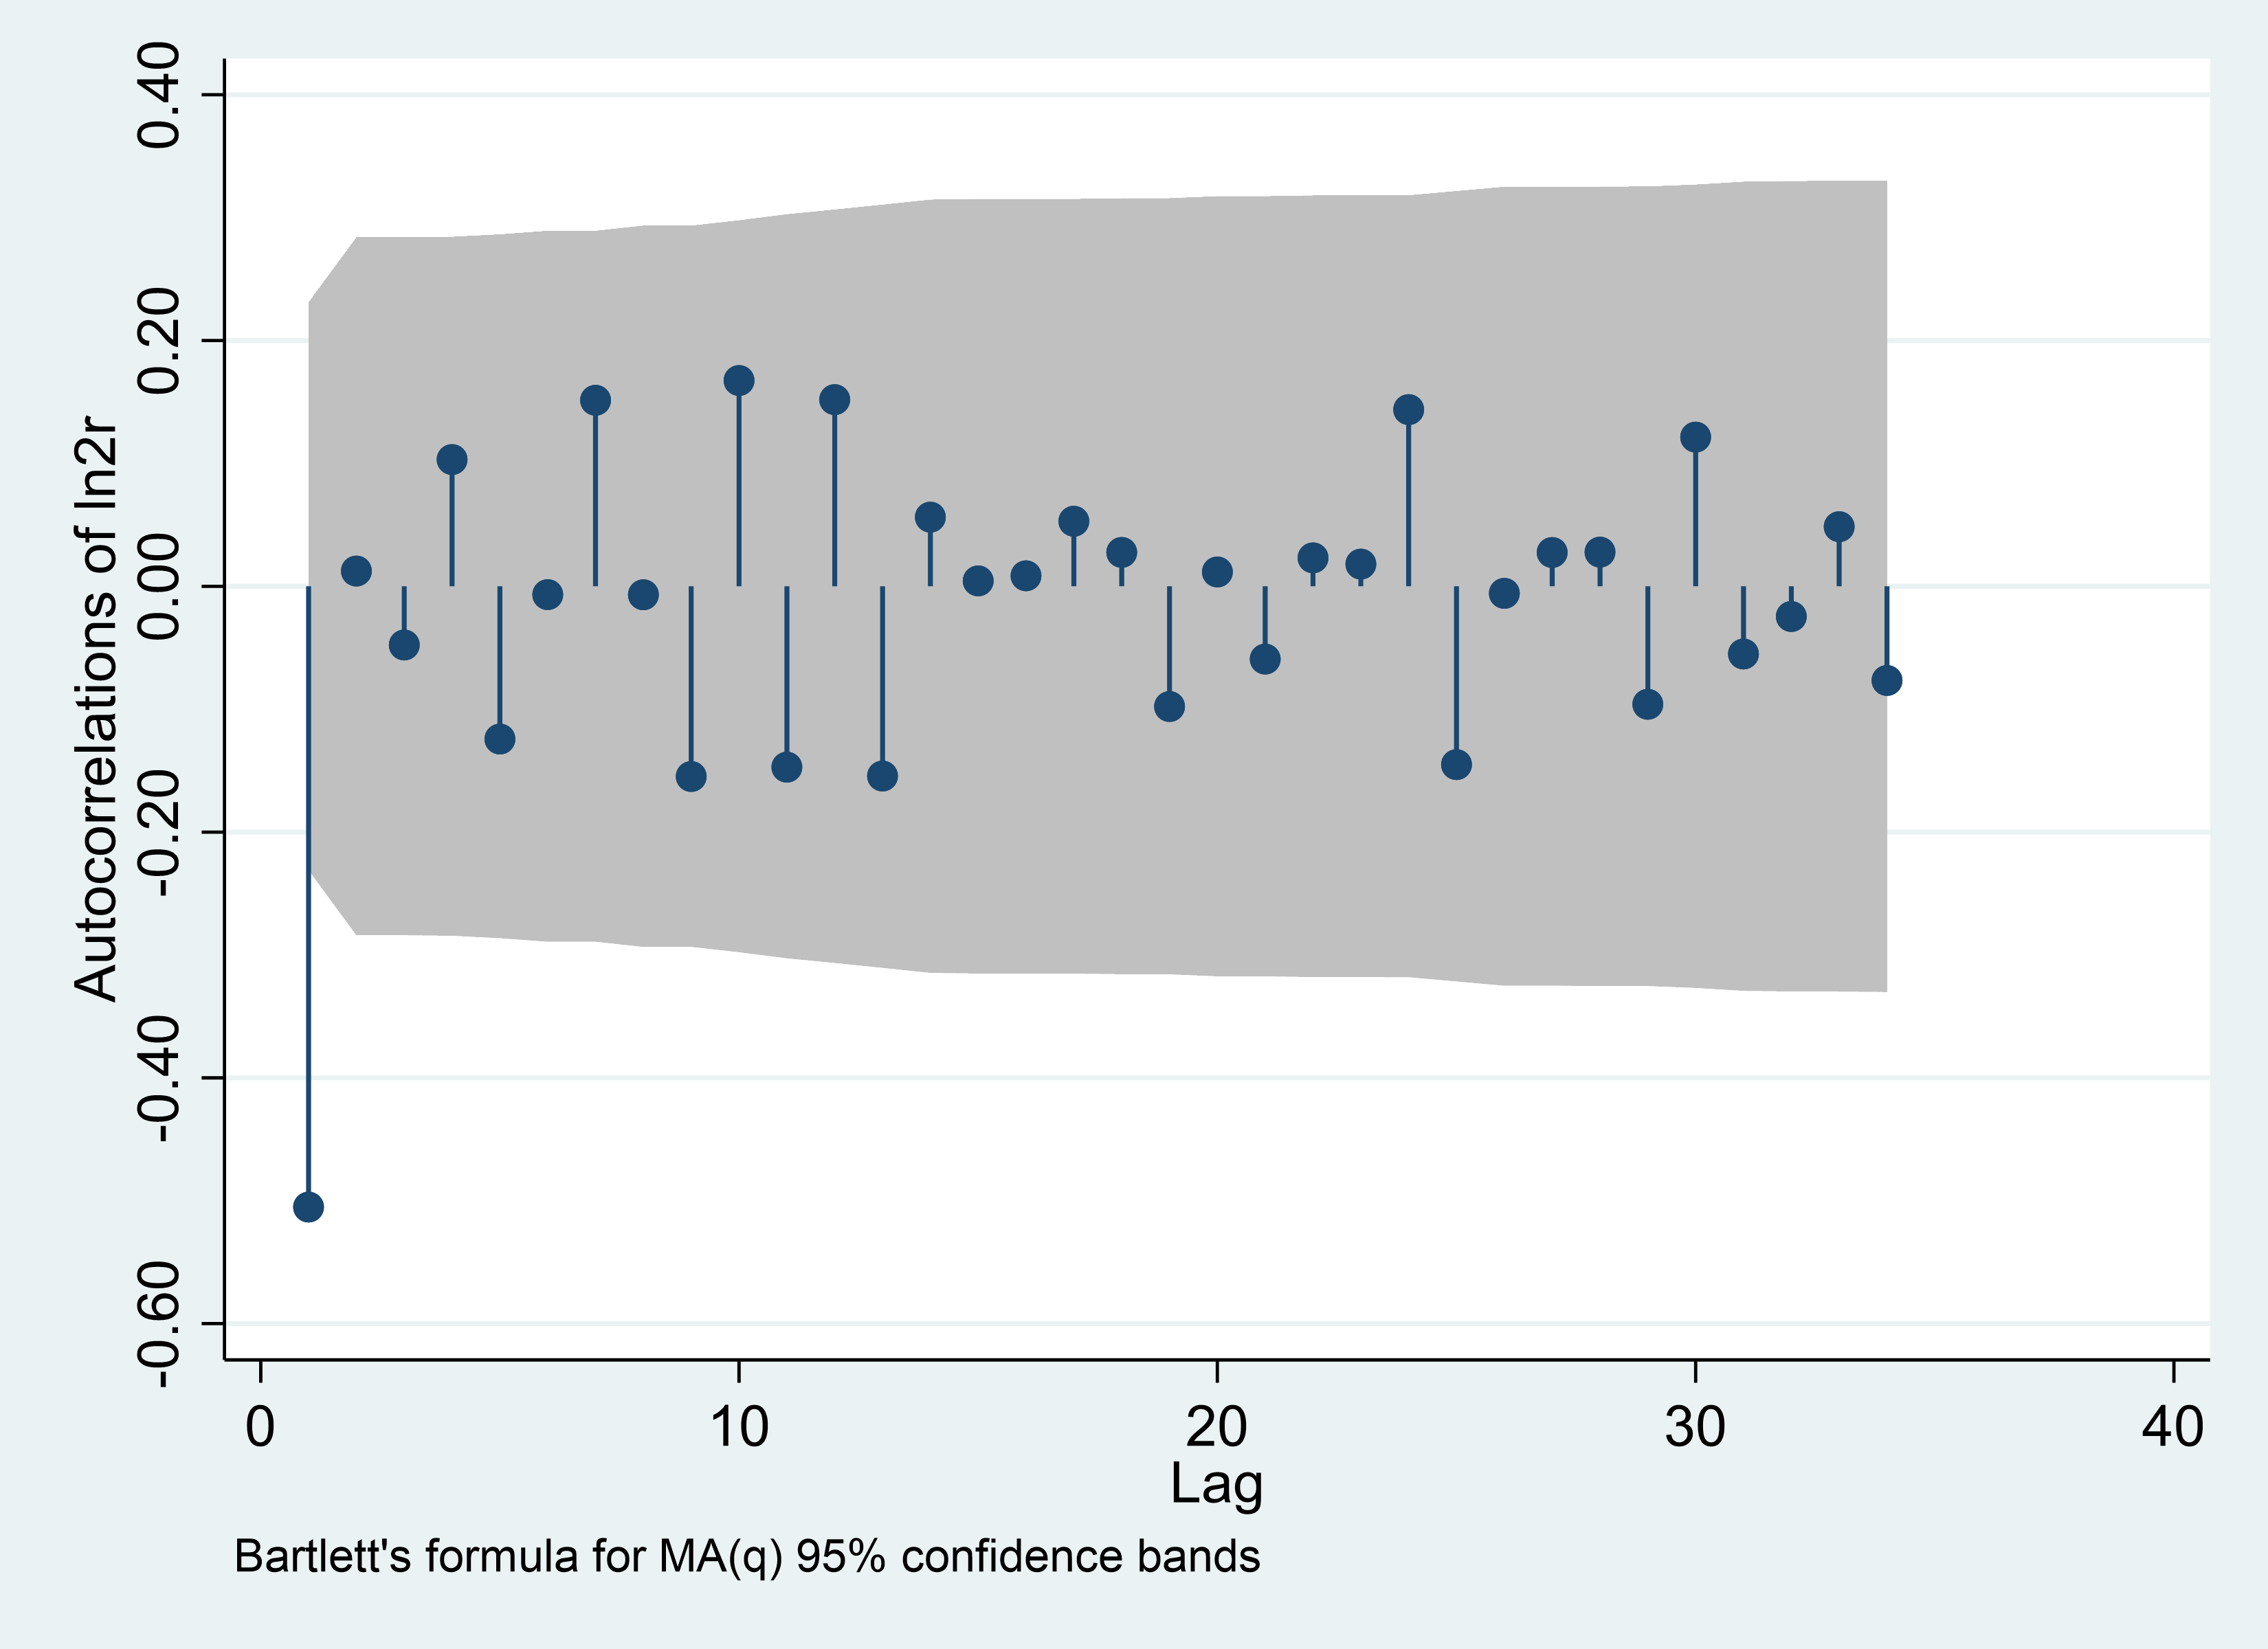
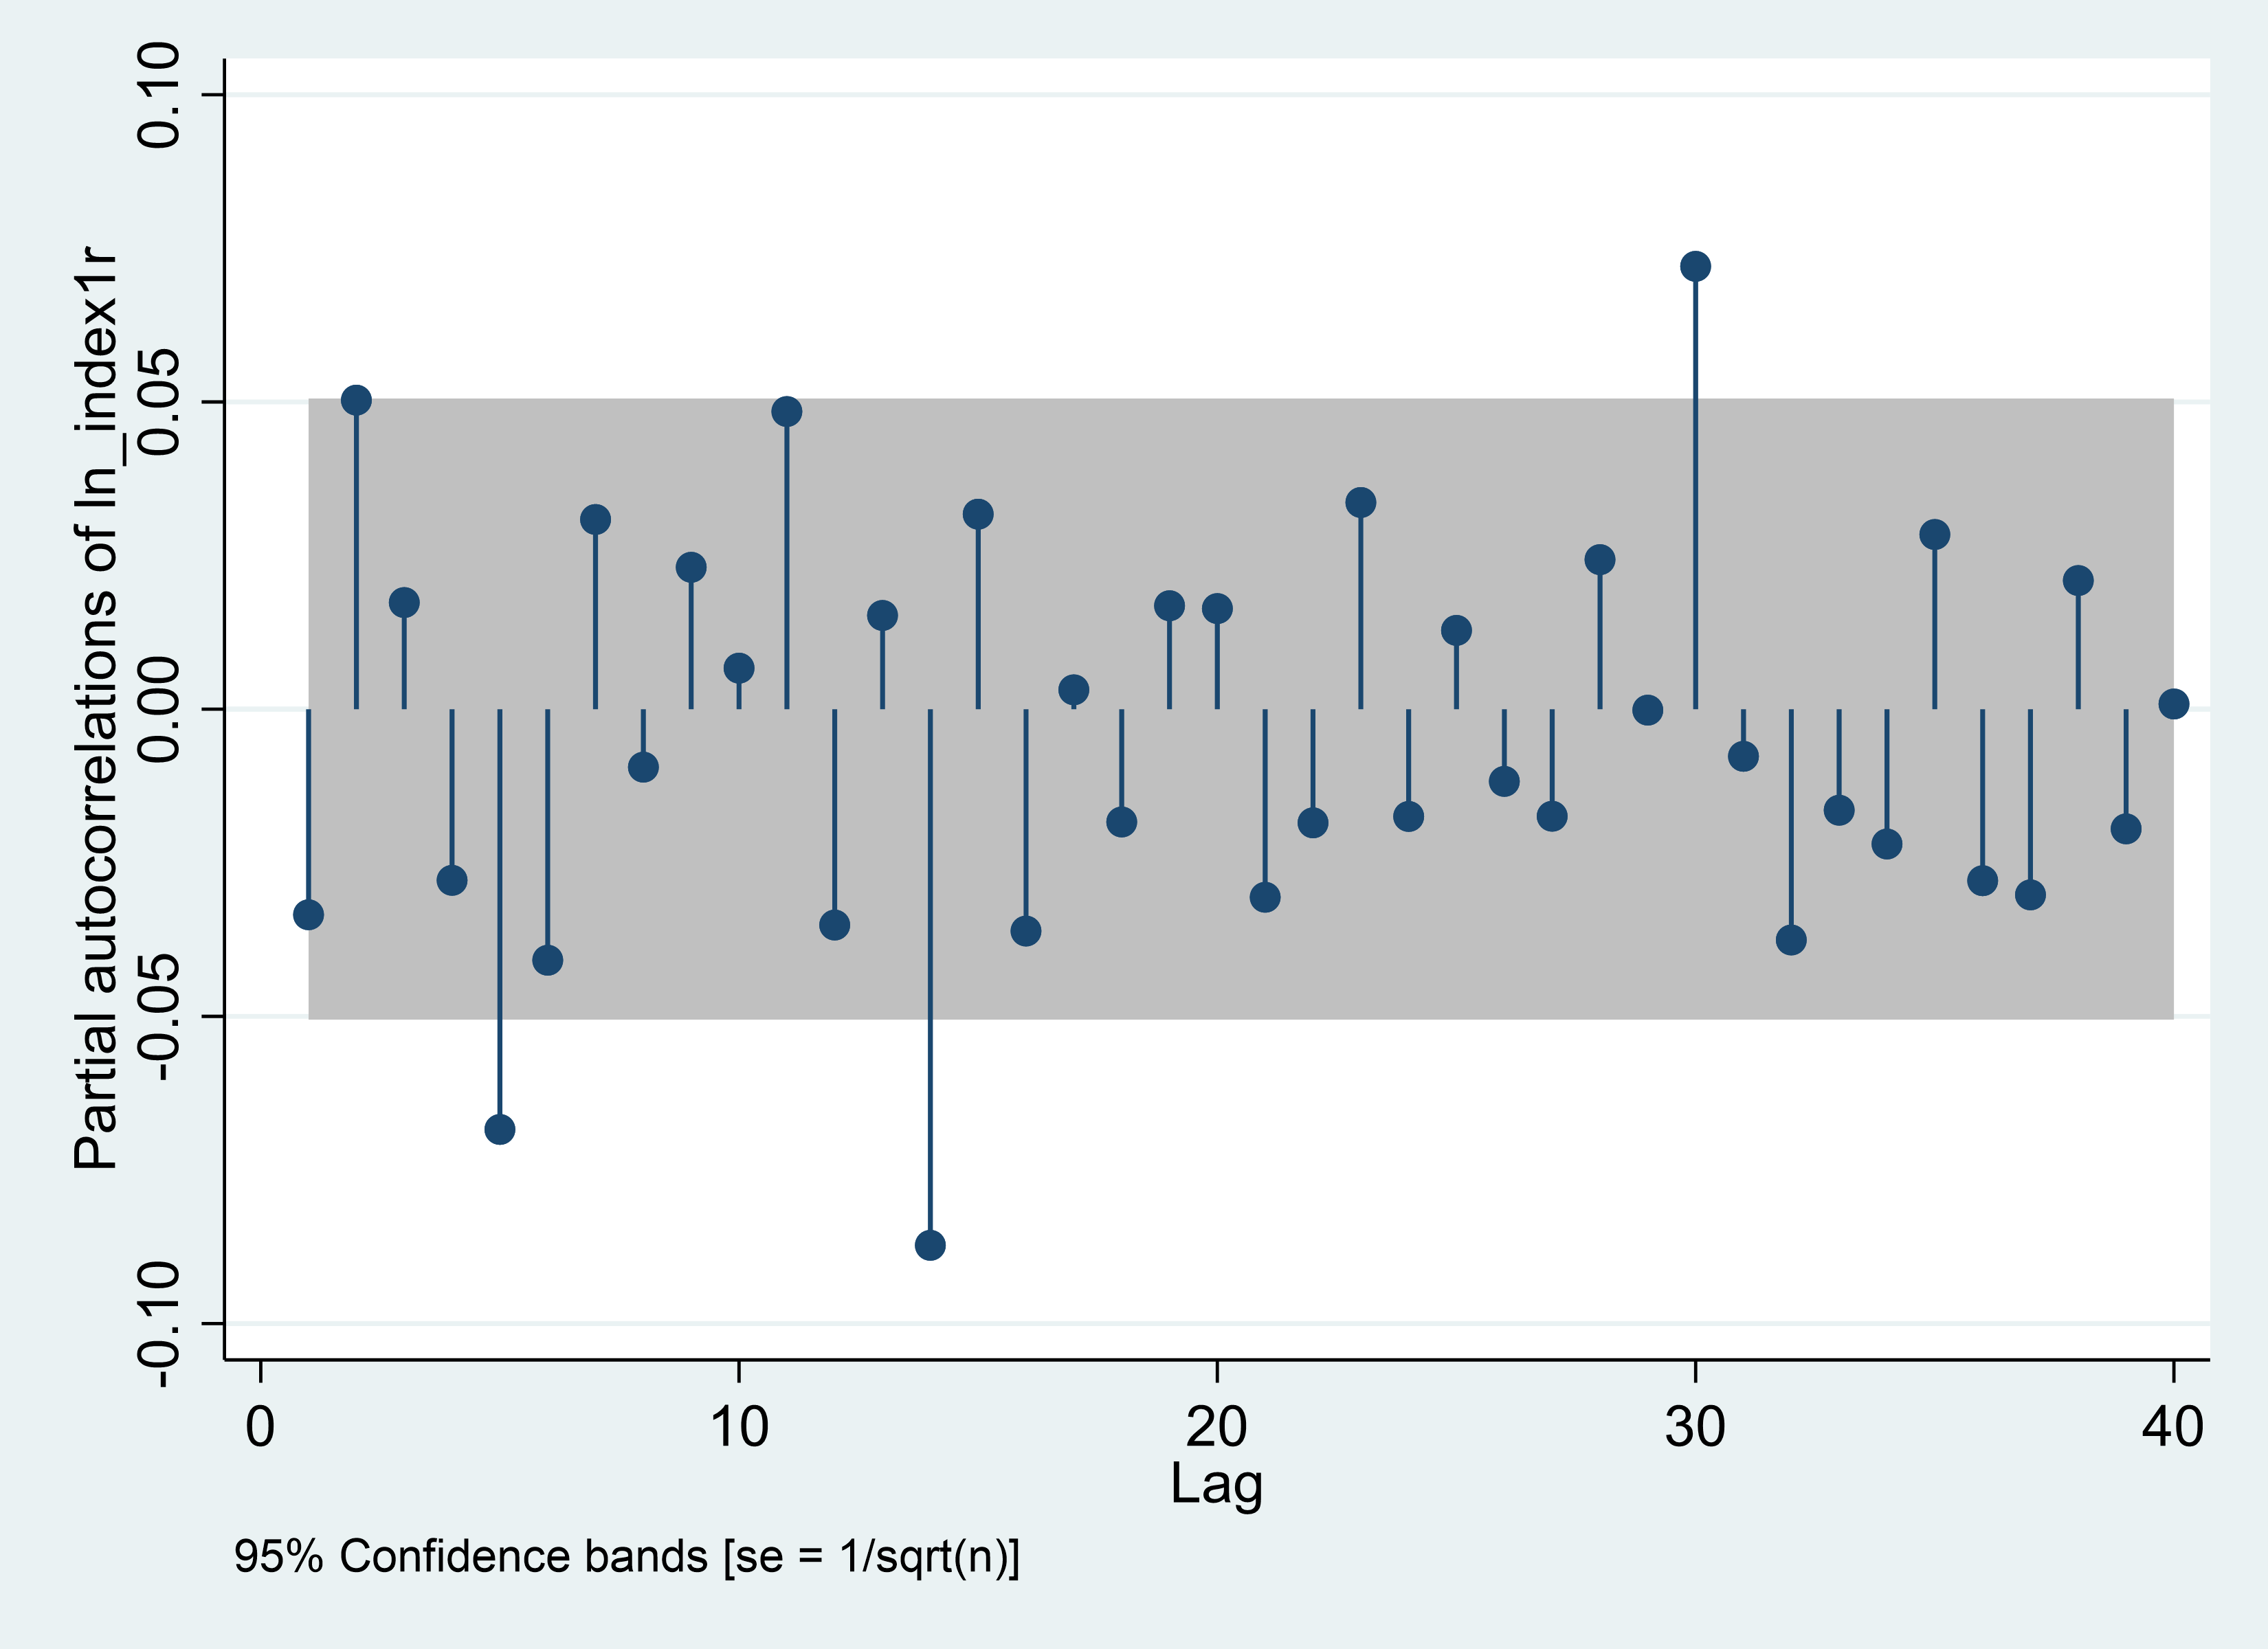
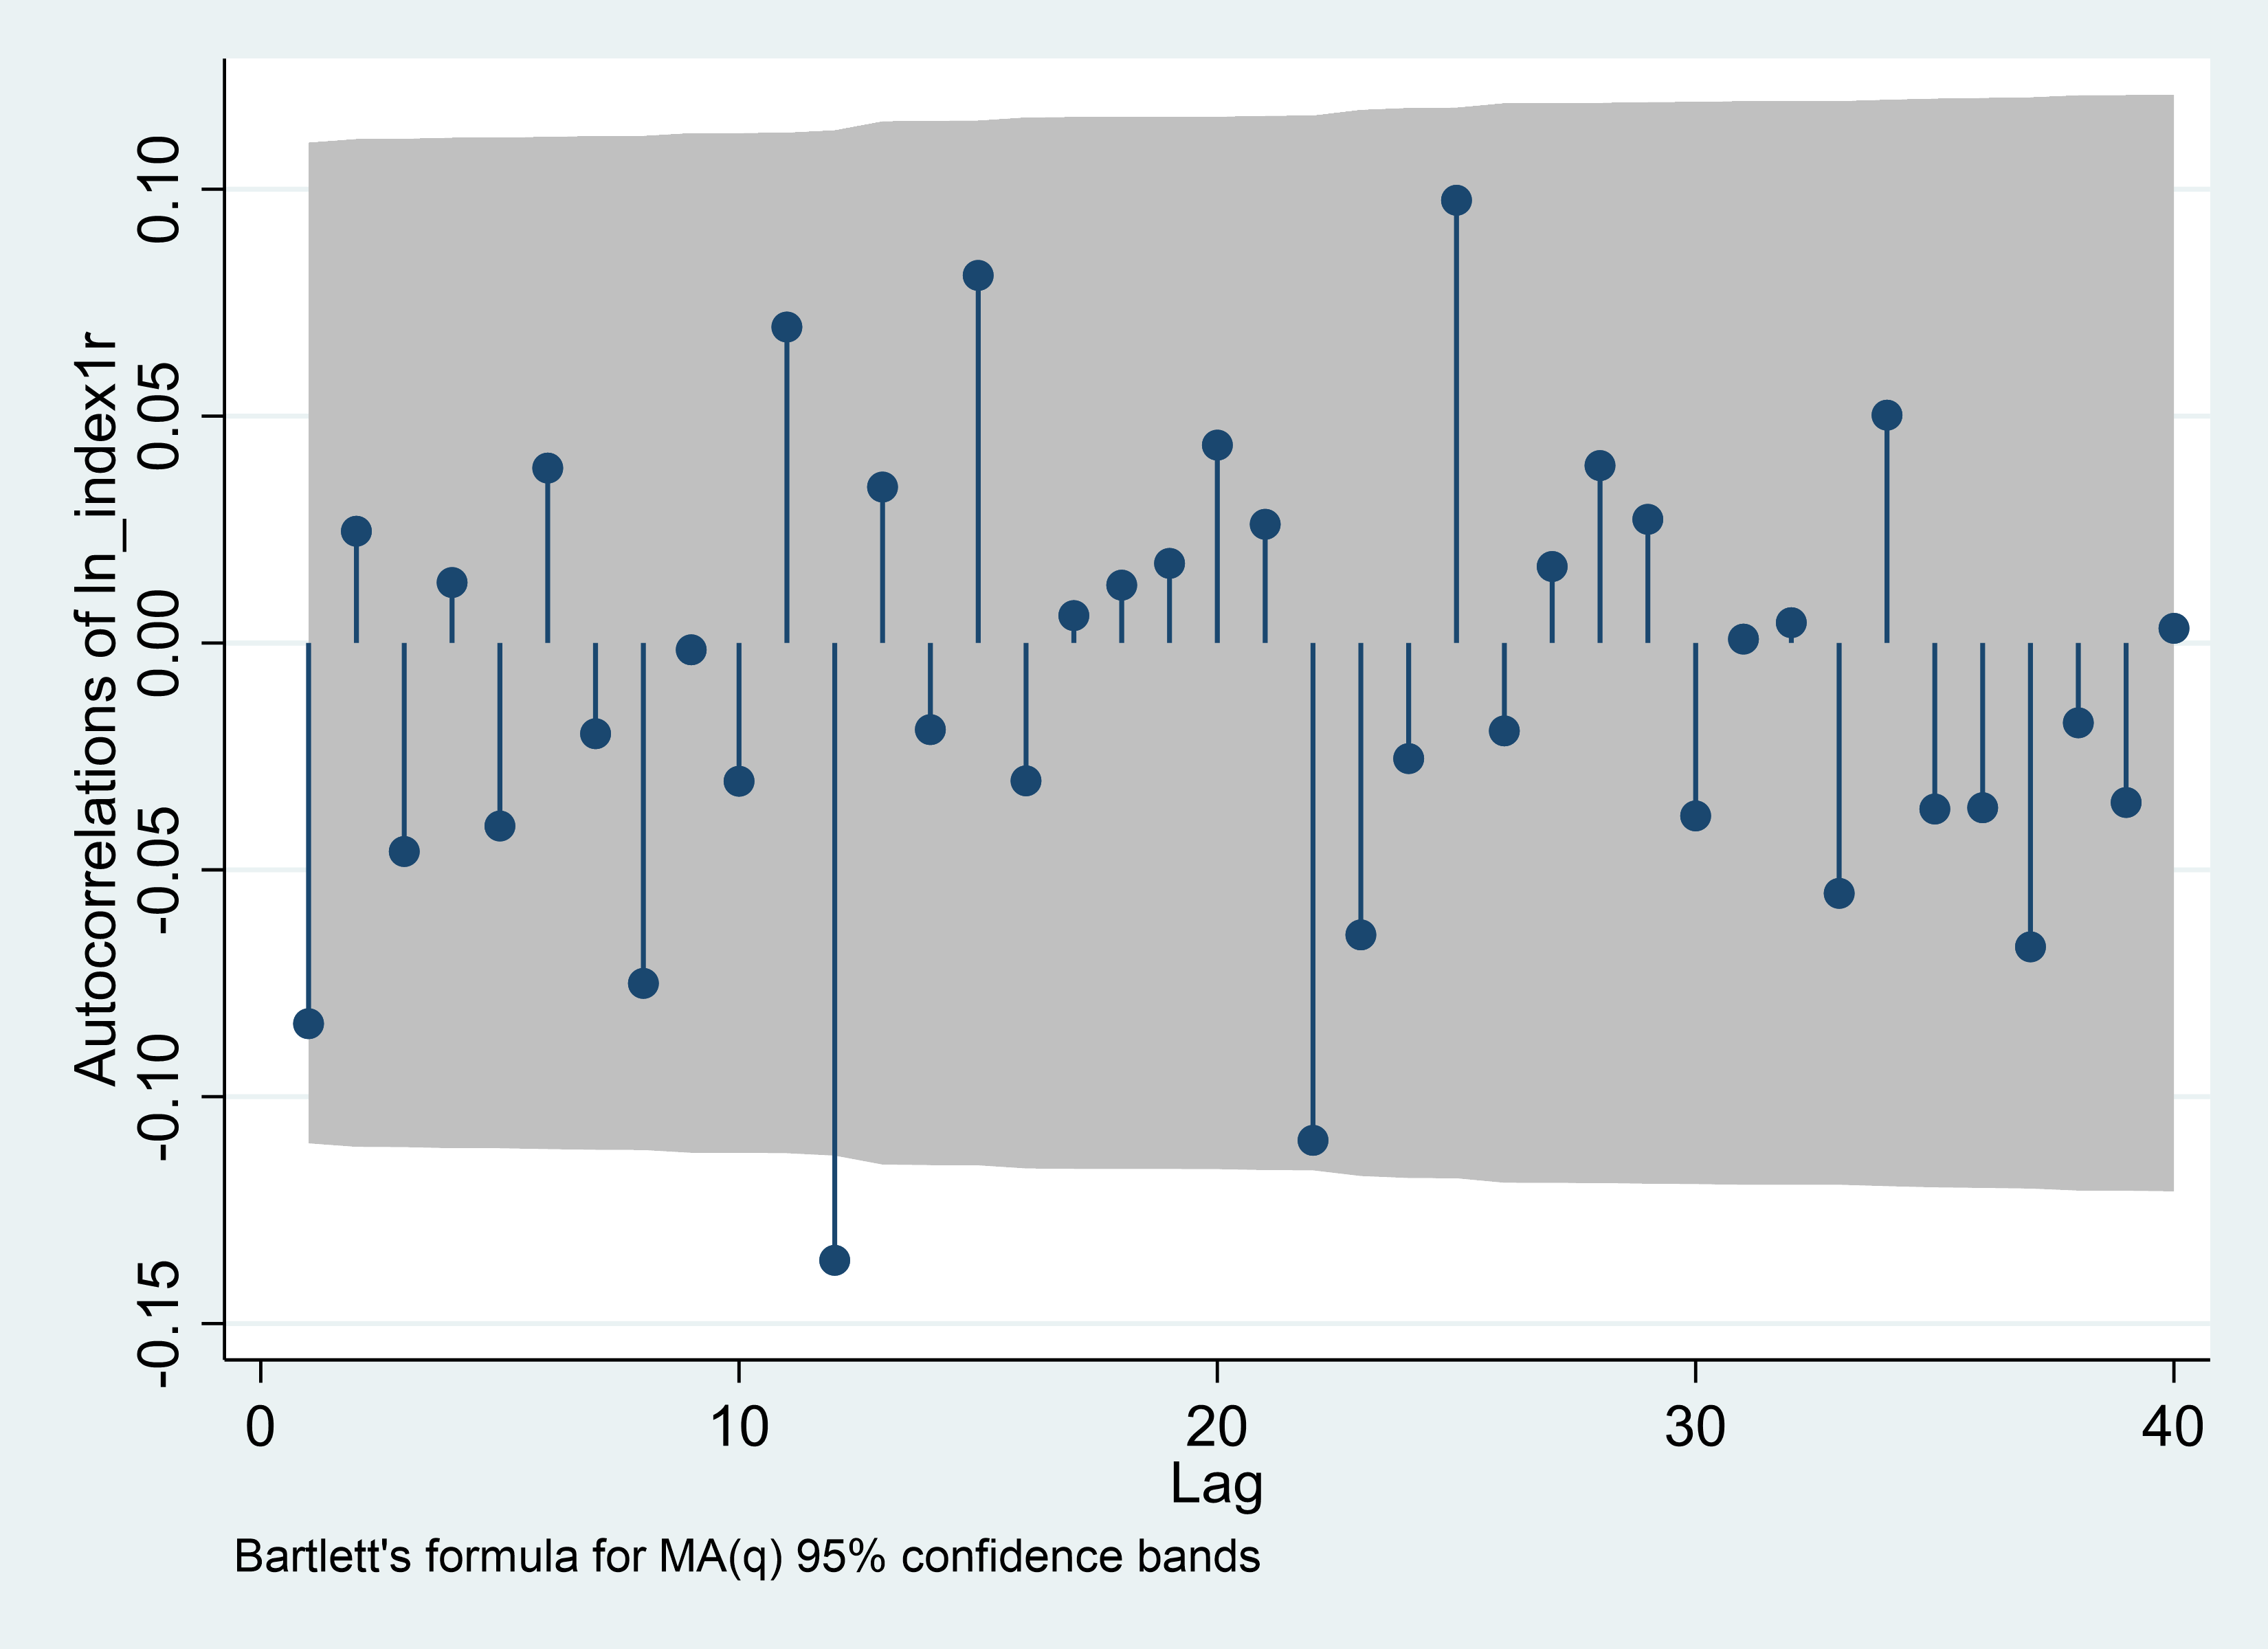
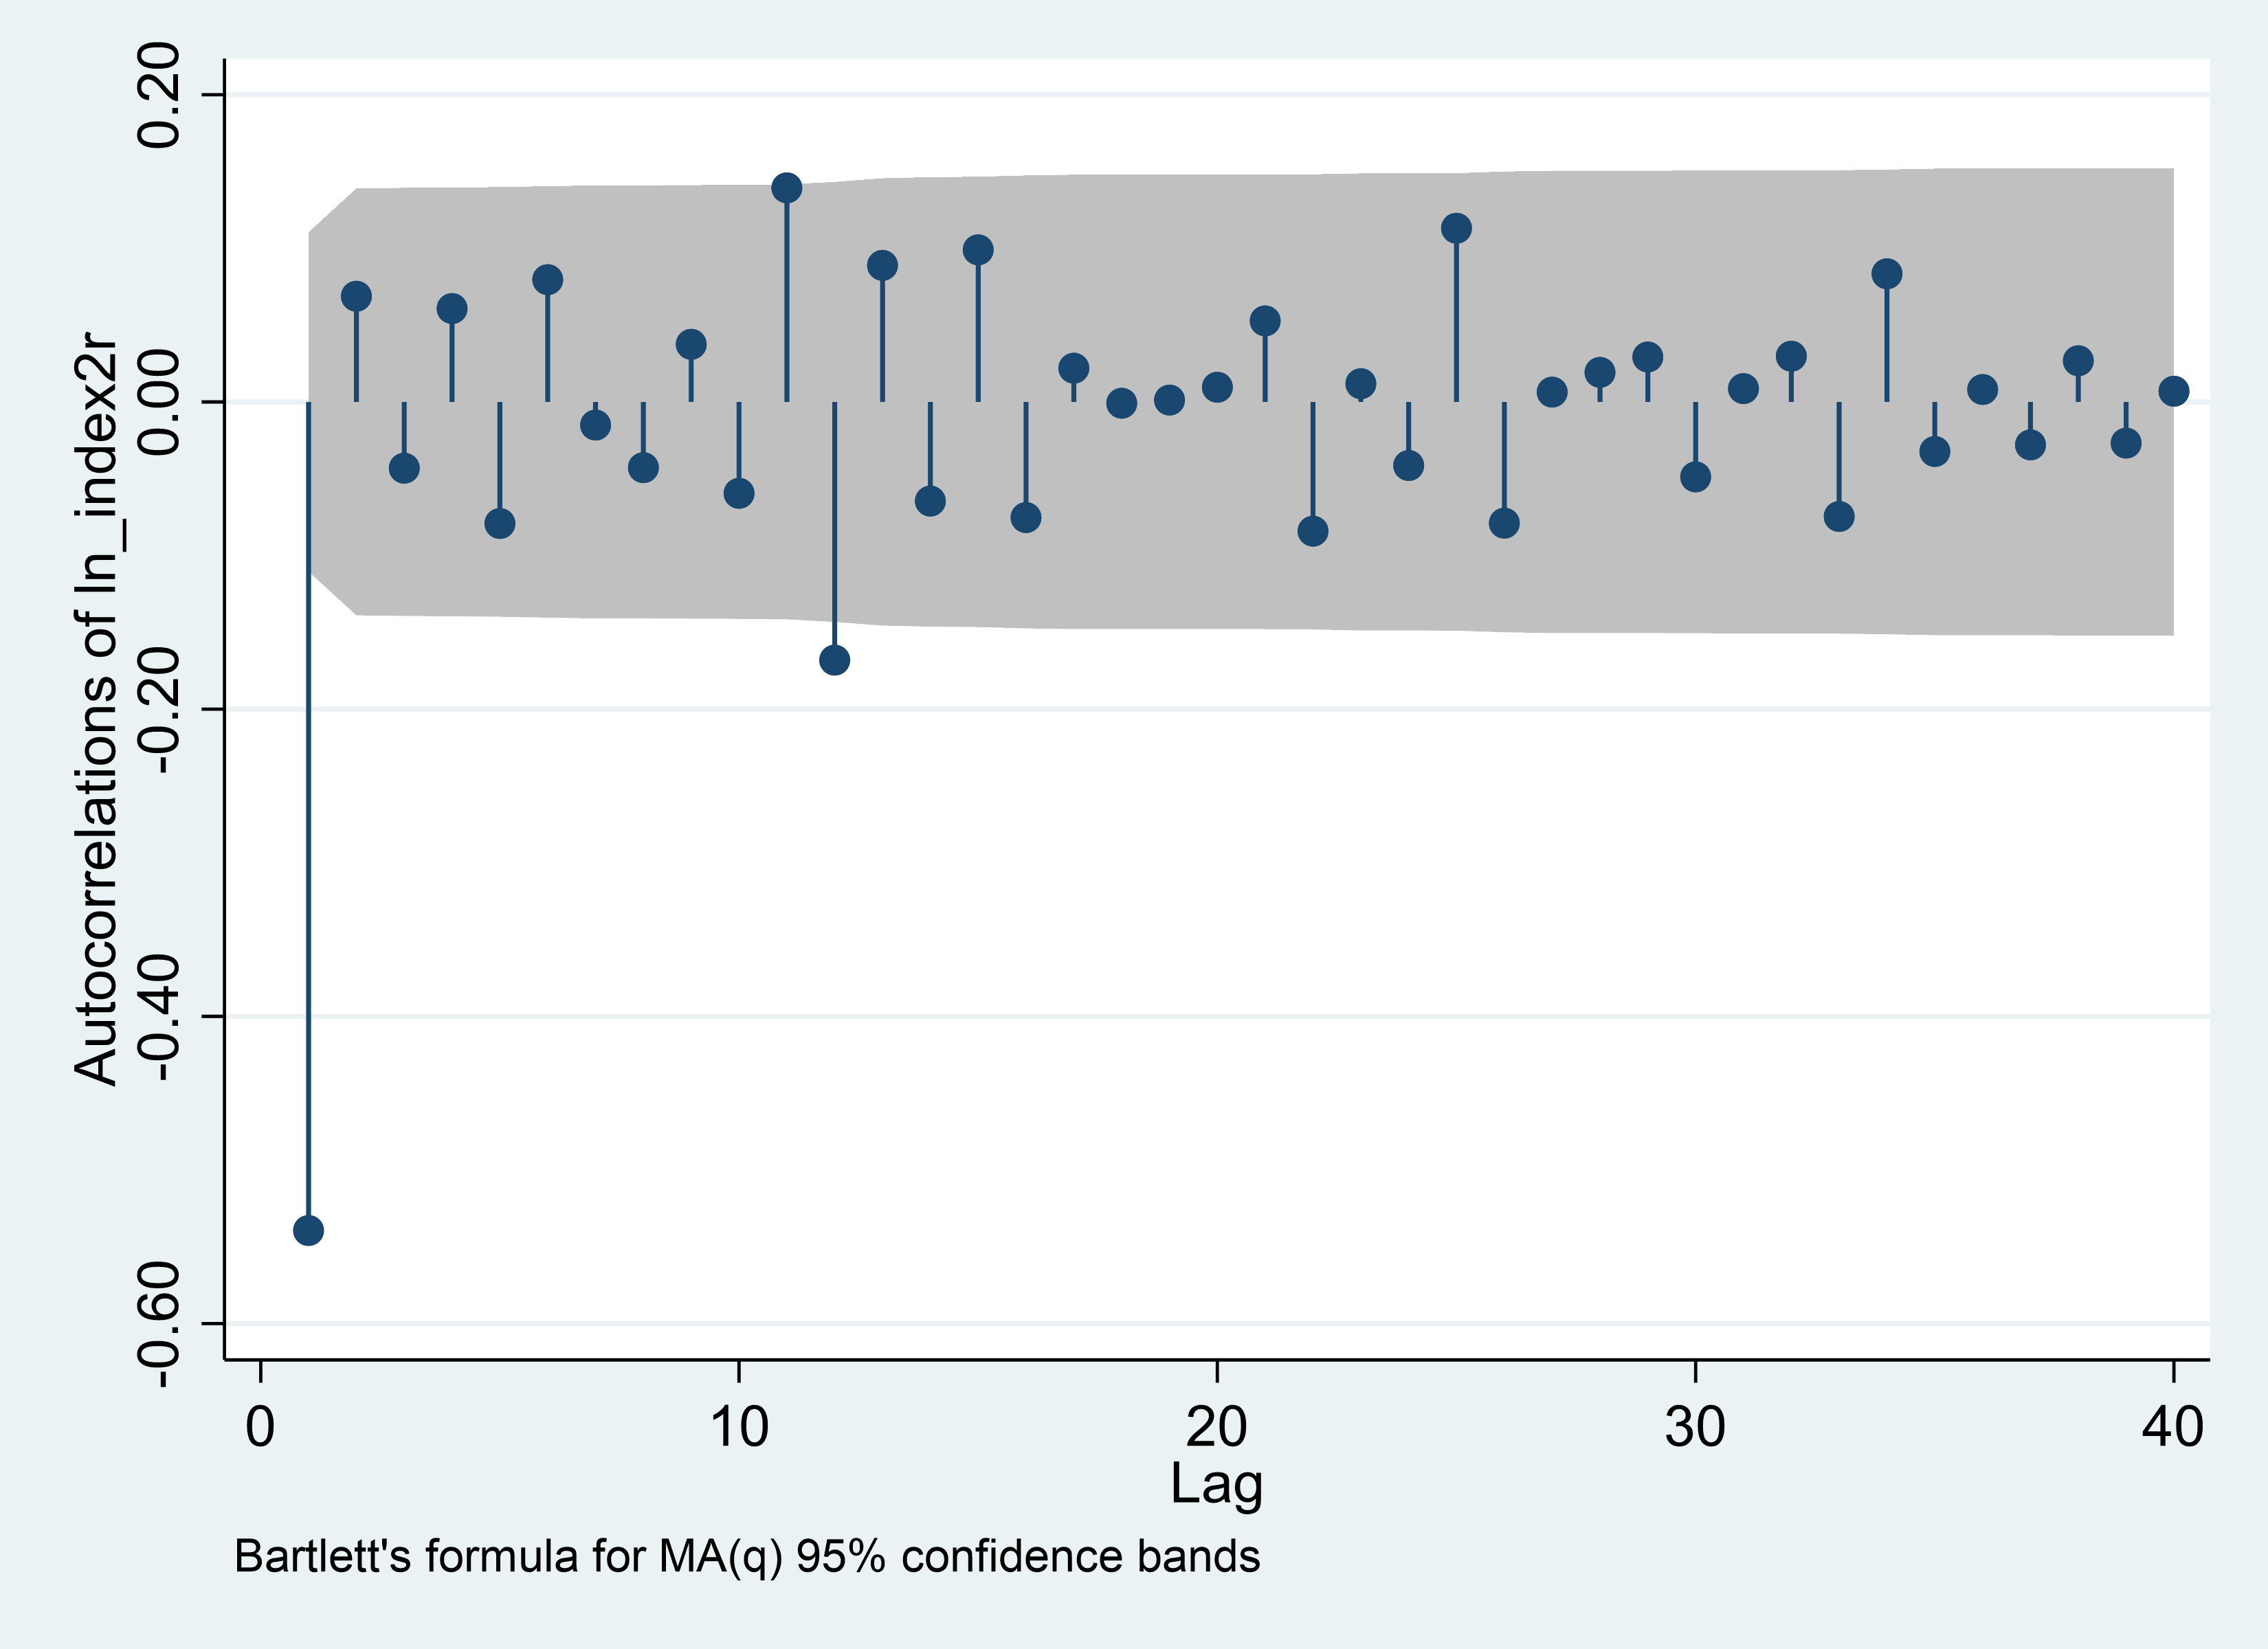
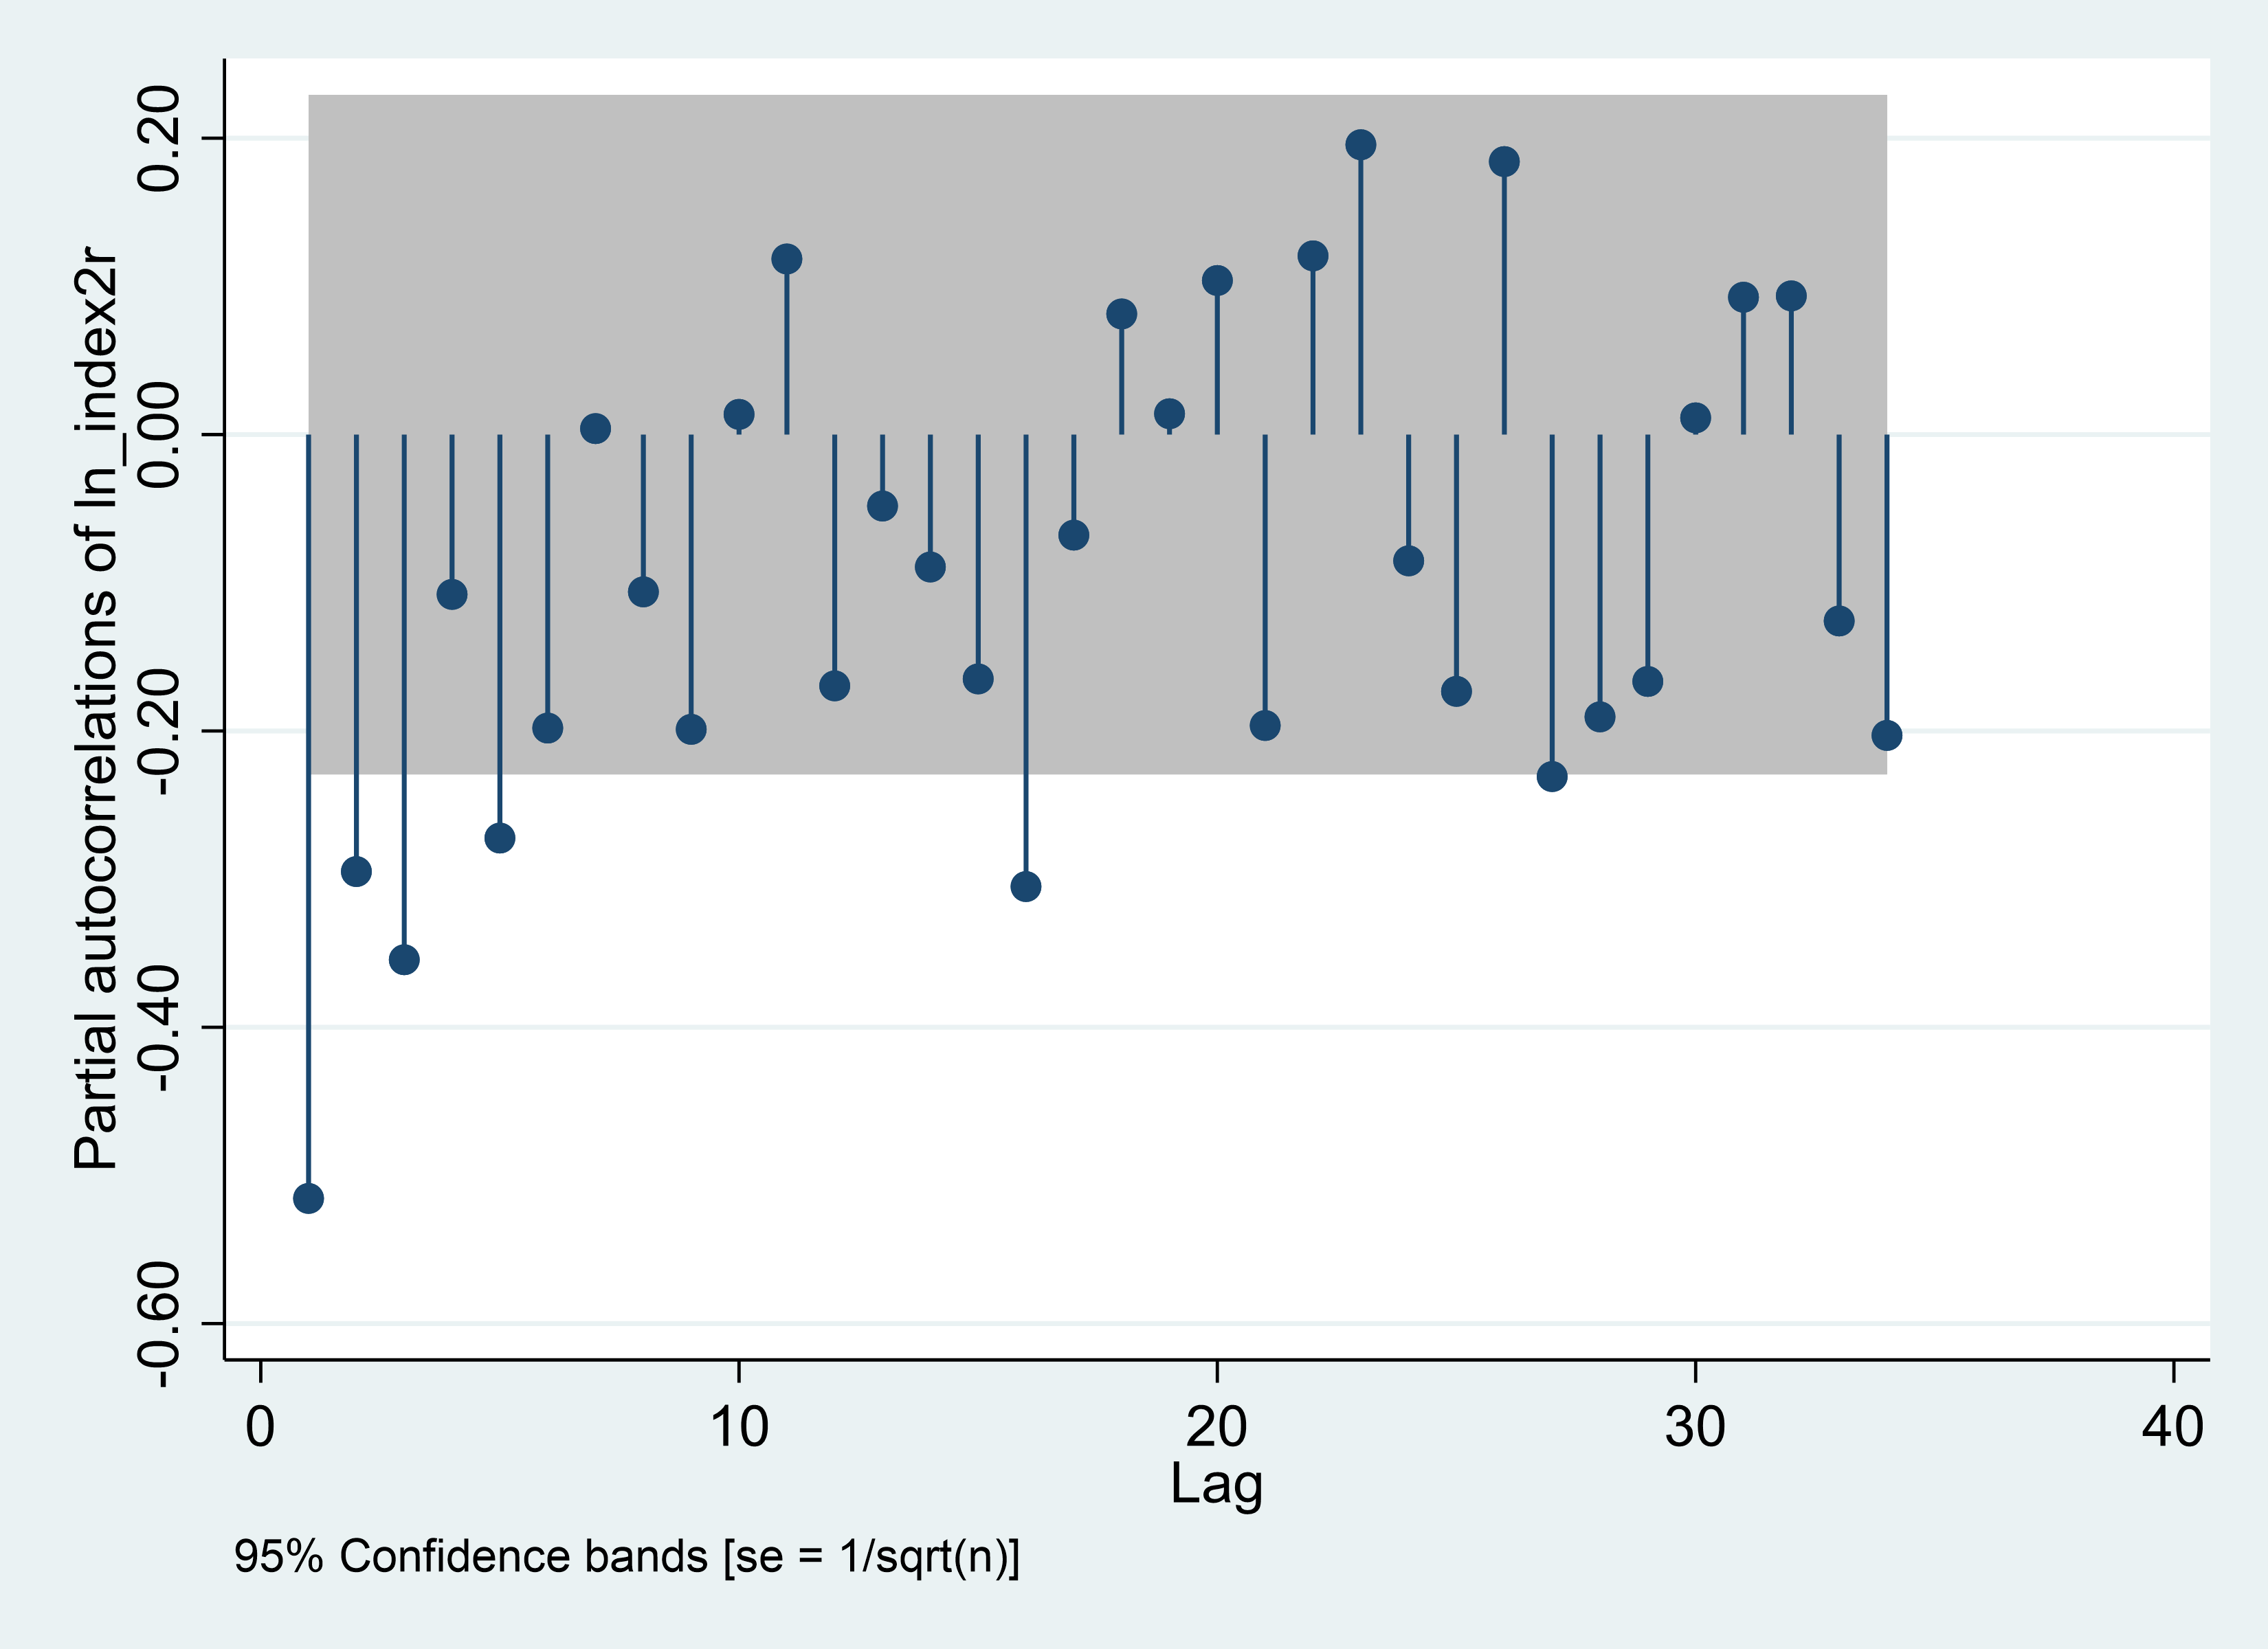
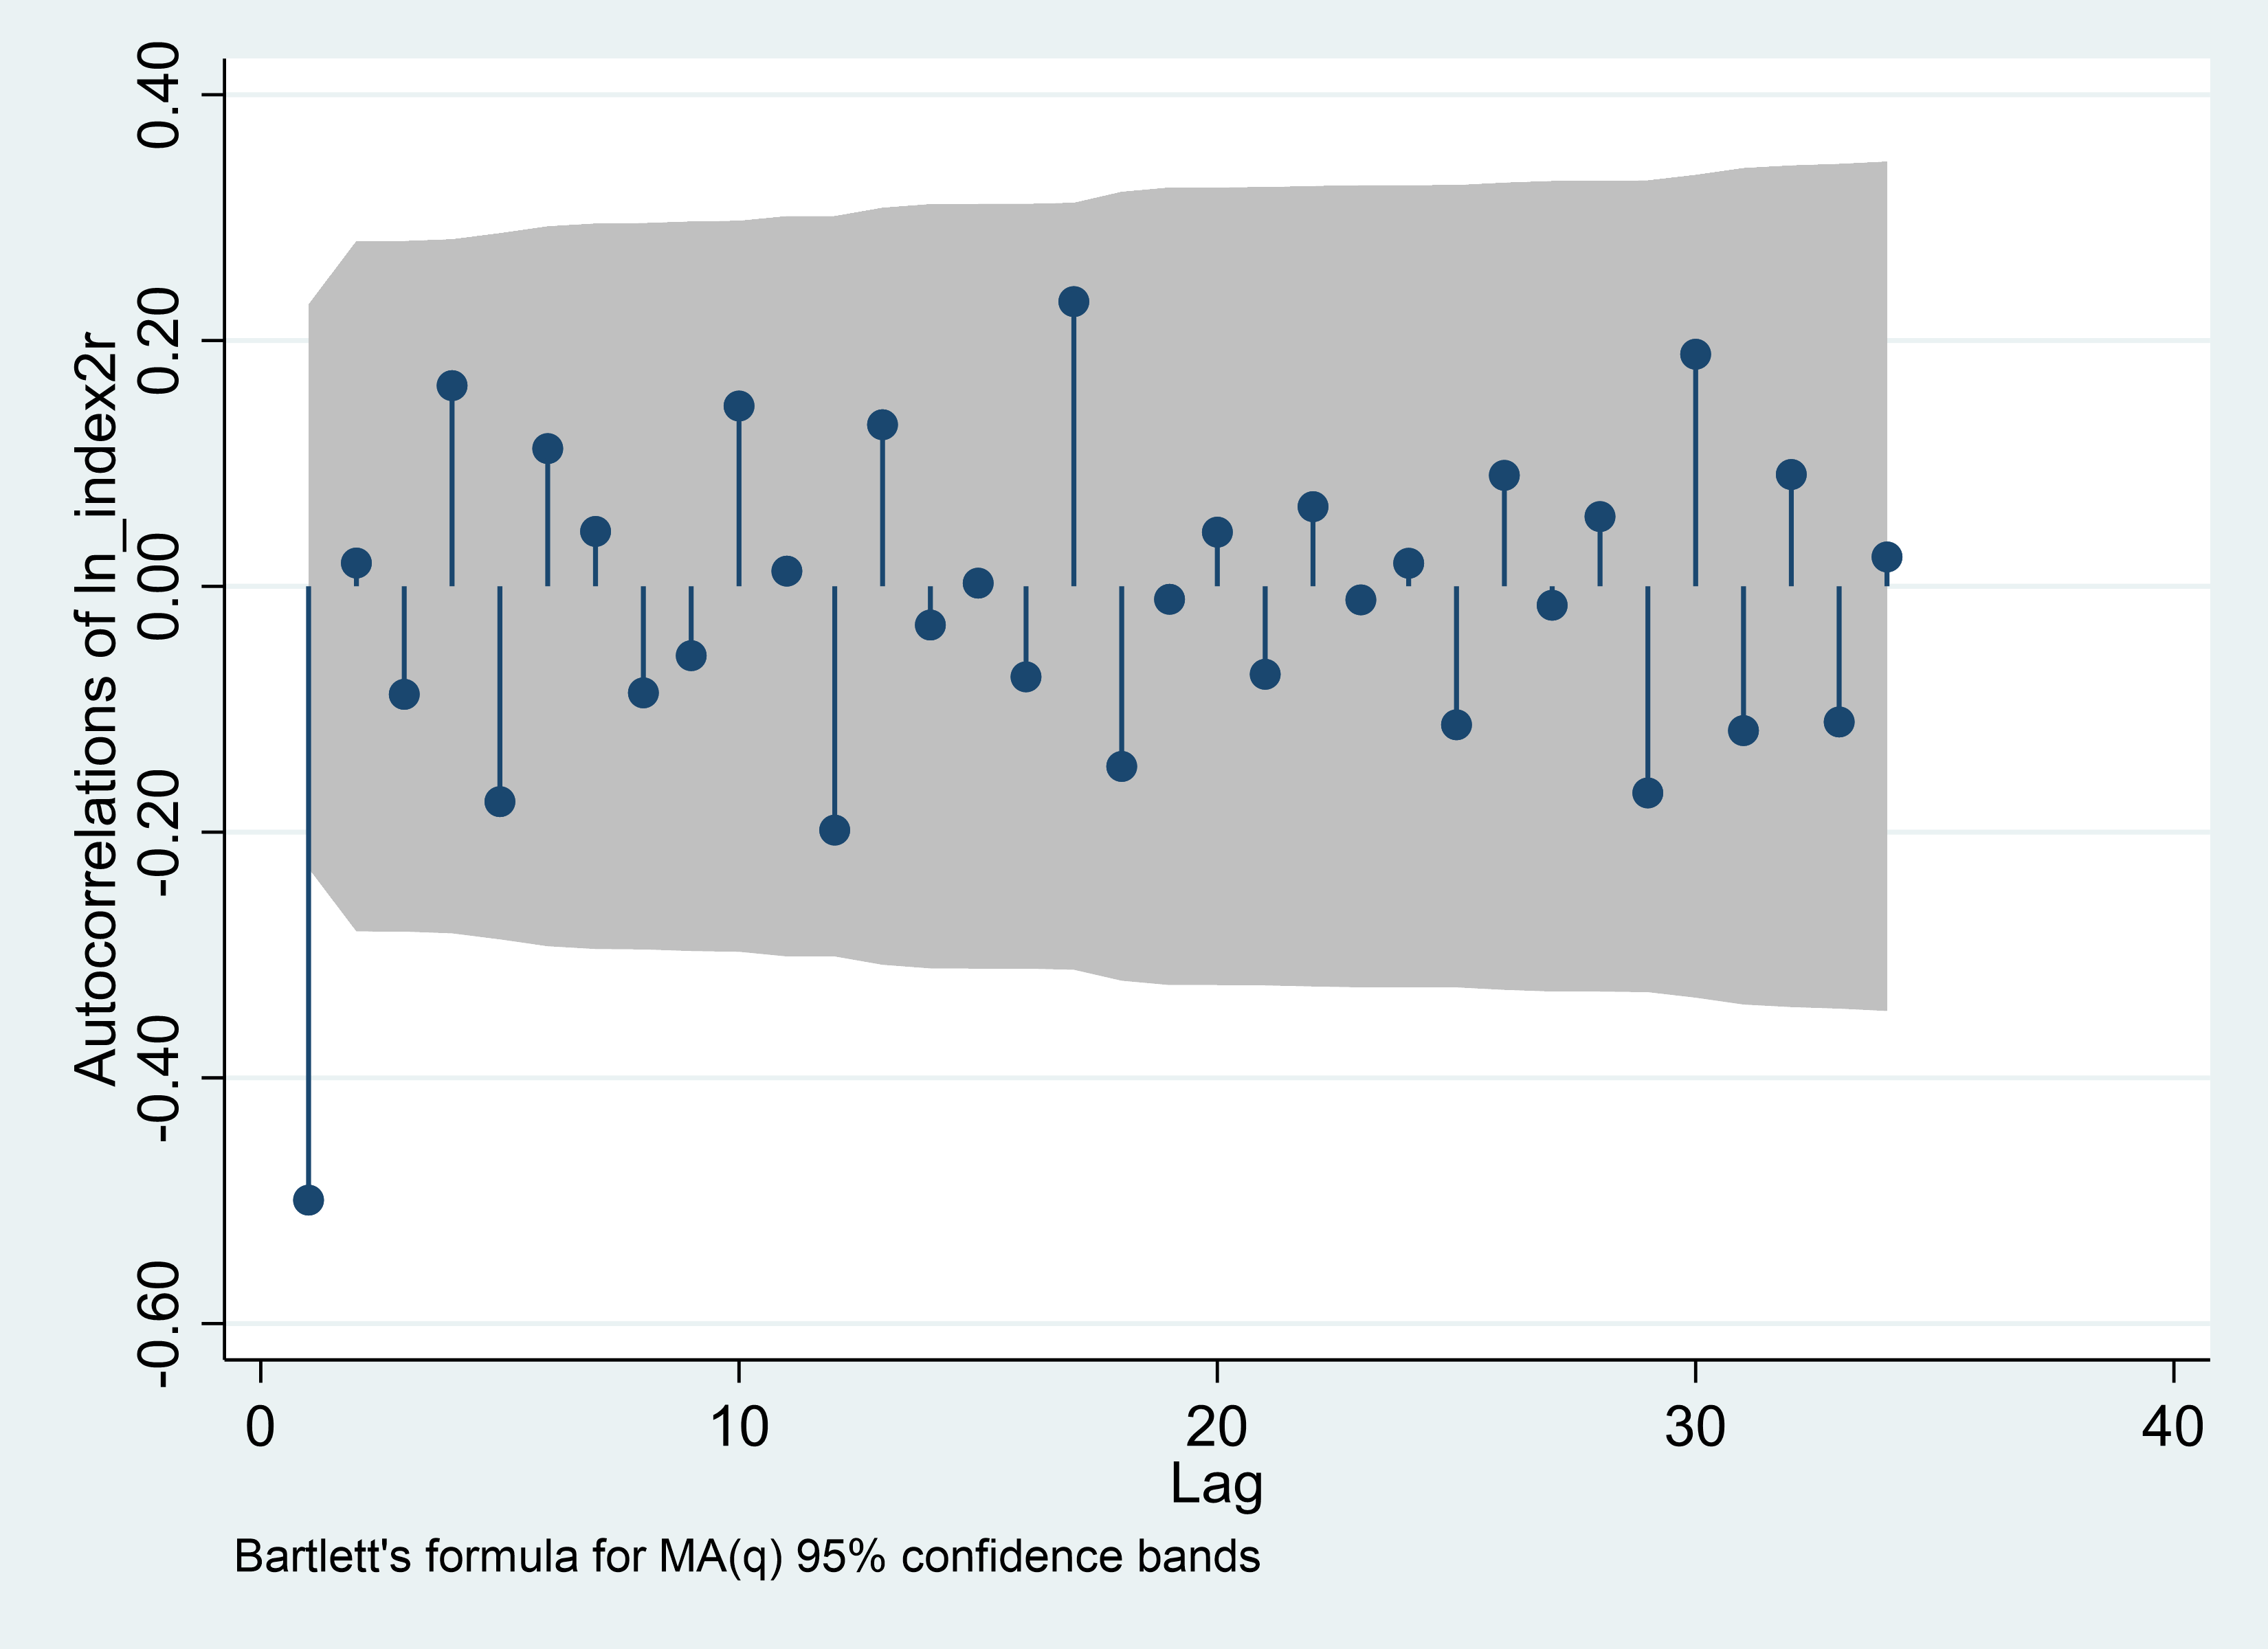
ACF (Autocorrelation Function) and PACF (Partial Autocorrelation Function) plots are employed for the purpose of determining the order of an ARIMA (Autoregressive Integrated Moving Average) model. The ACF plot helps in identifying the appropriate order of the MA (Moving Average) term, whereas the PACF plot aids in determining the suitable order of the AR (Autoregressive) term [11].
PACF | ACF |
Daily | |
|
|
Weekly | |
|
|
Monthly | |
|
|
Figure 4: ARMA (p, q) identification, Nasdaq. | |
Photo credit: Original | |
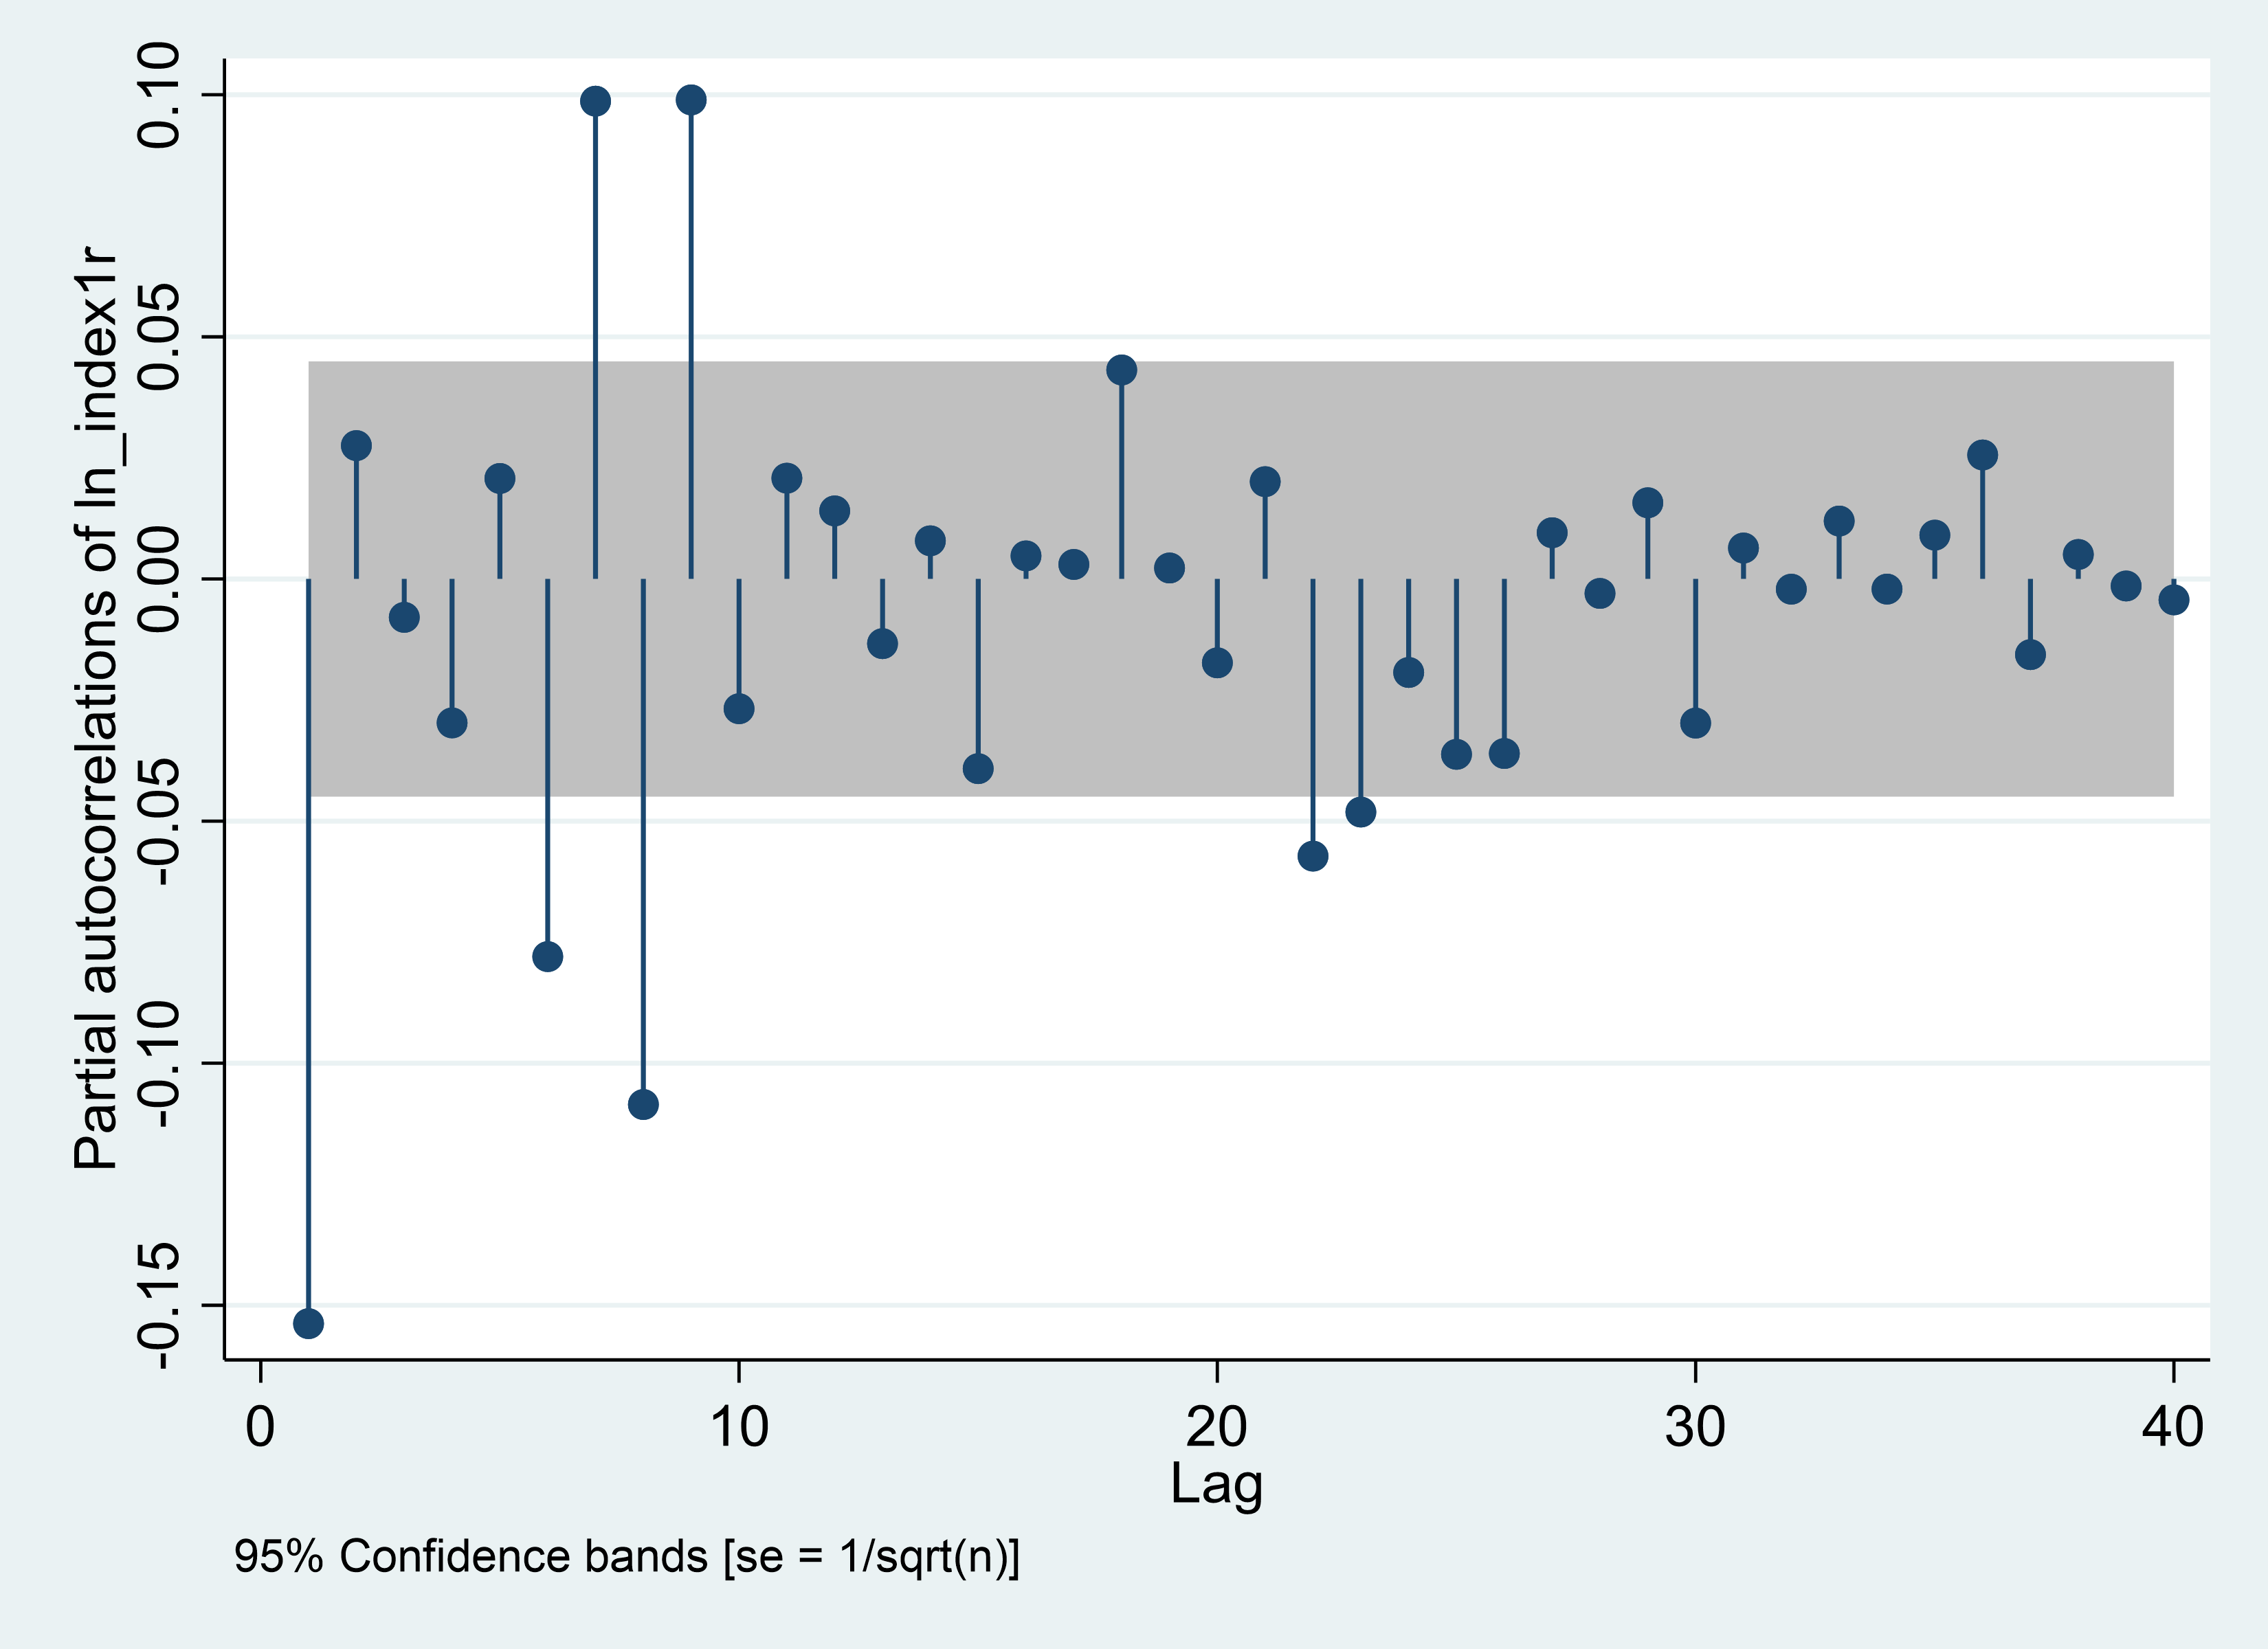
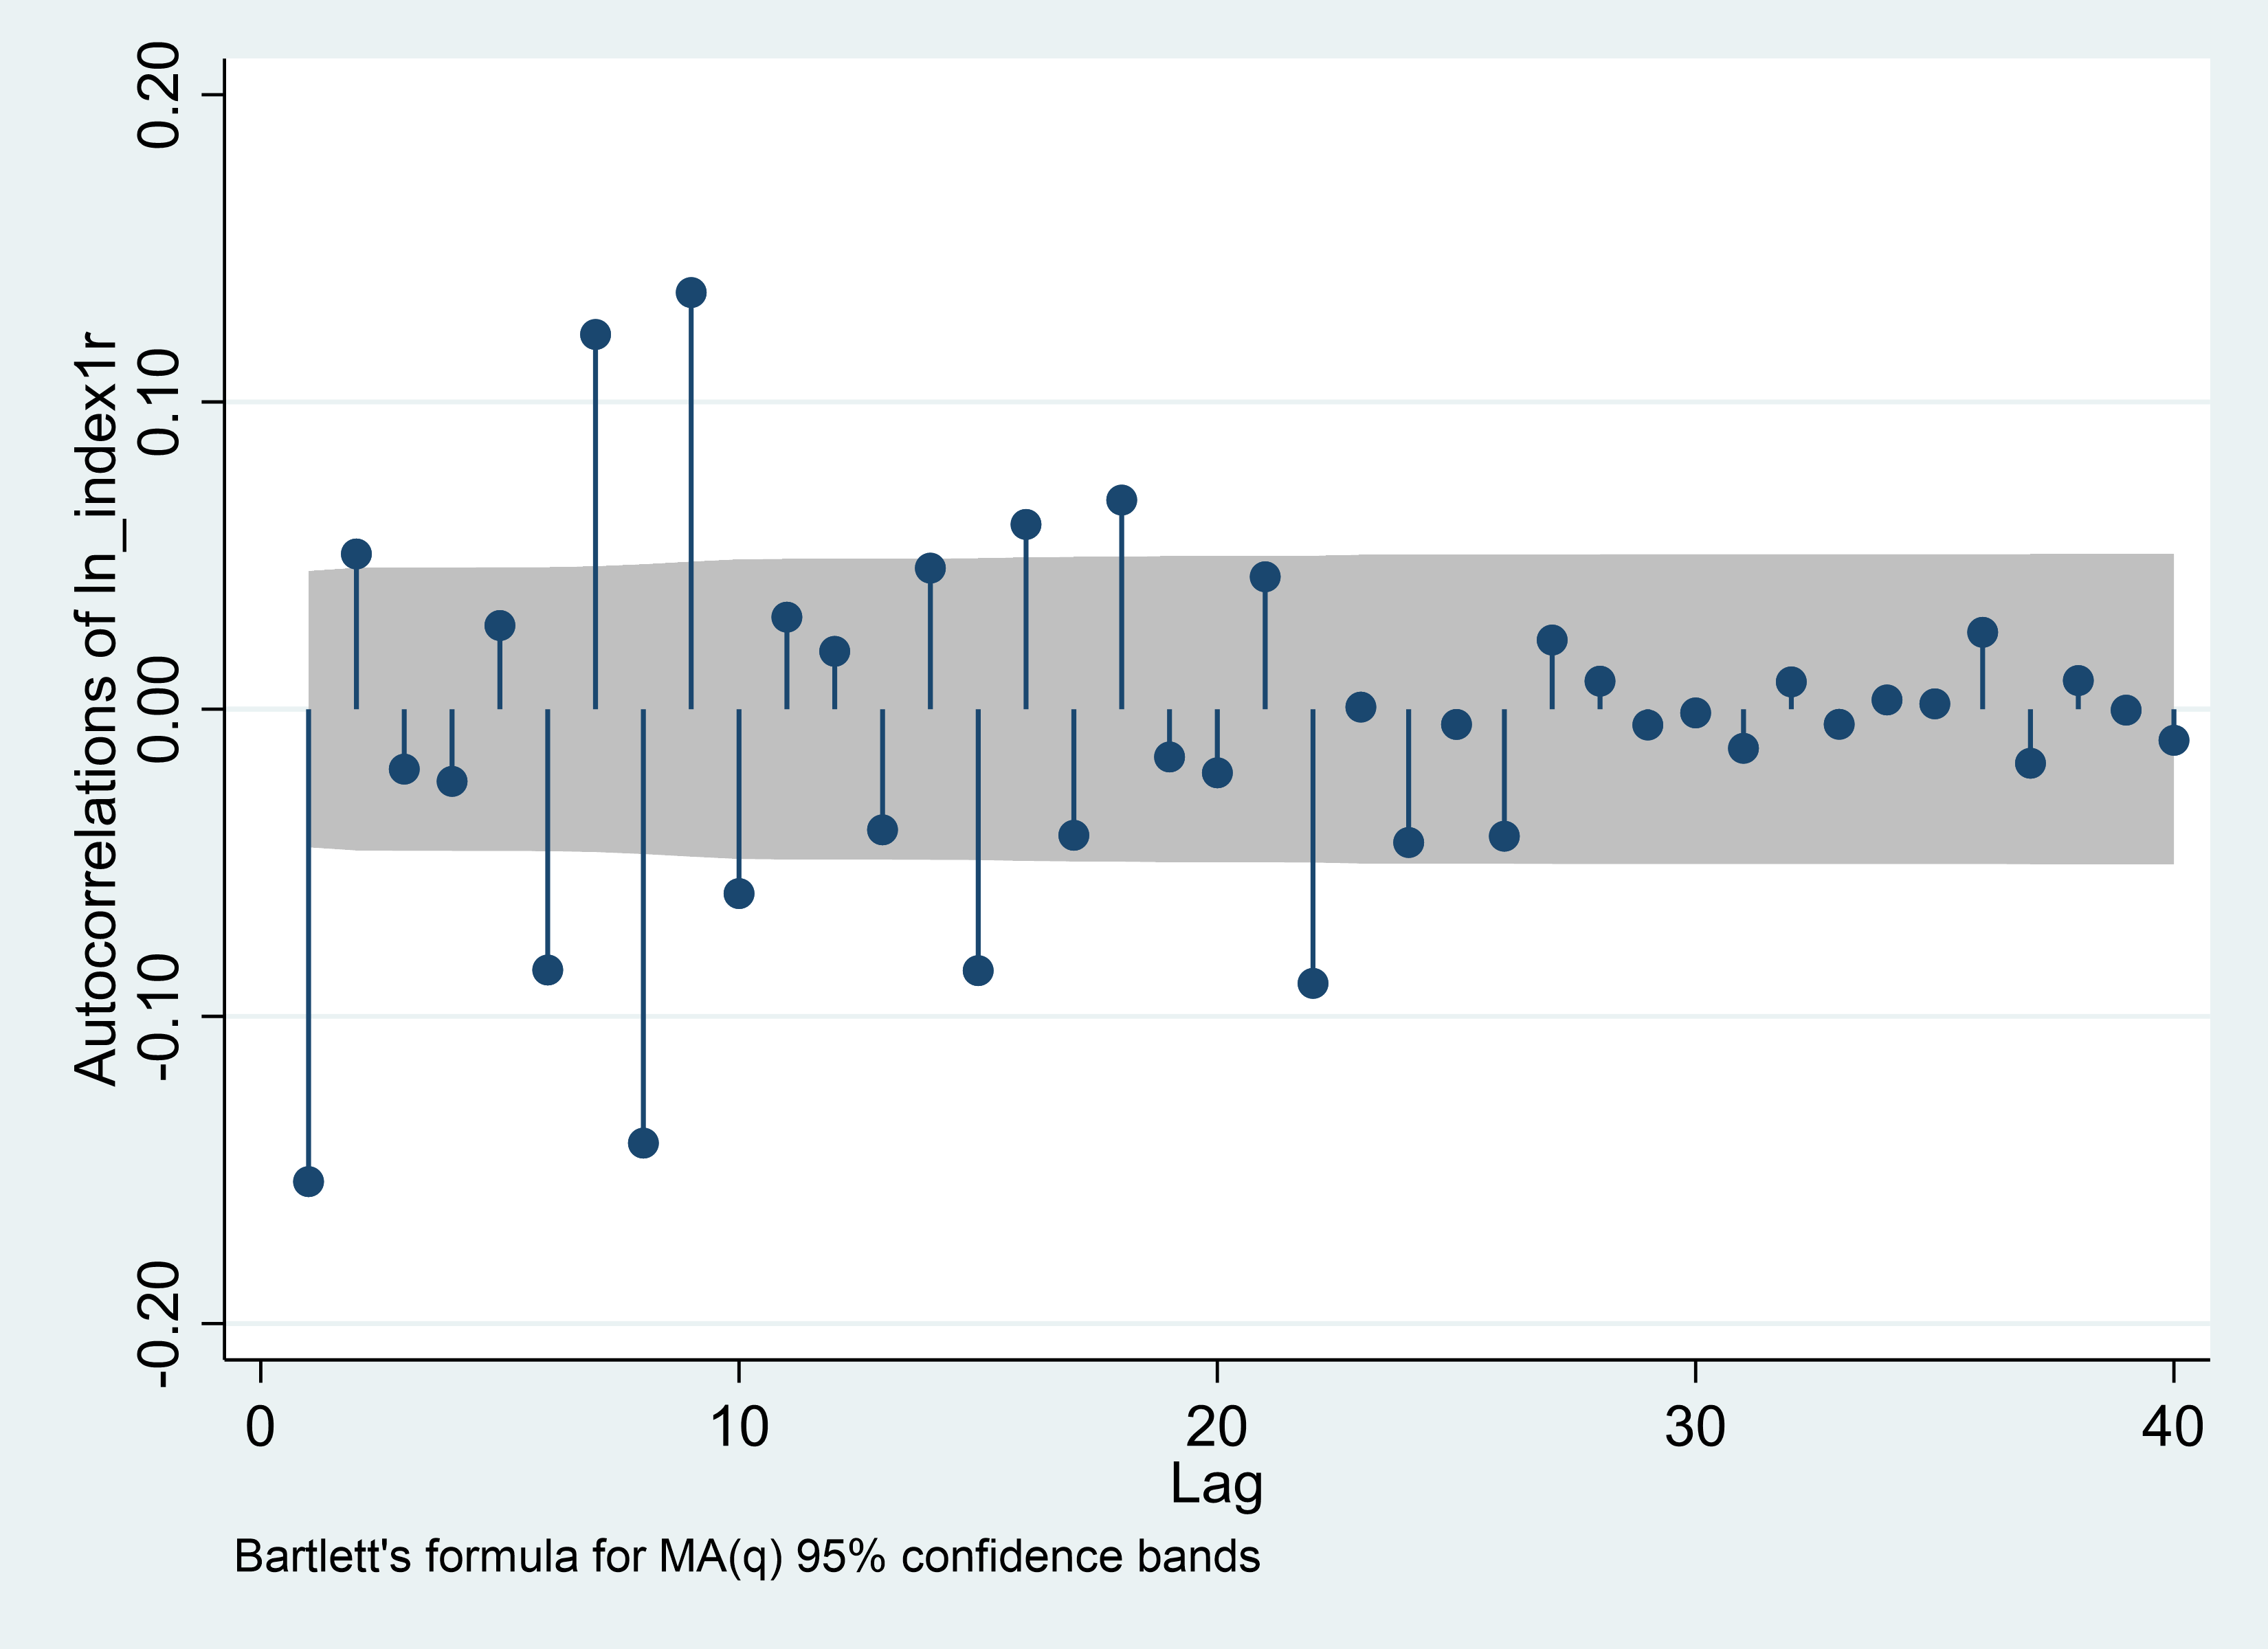
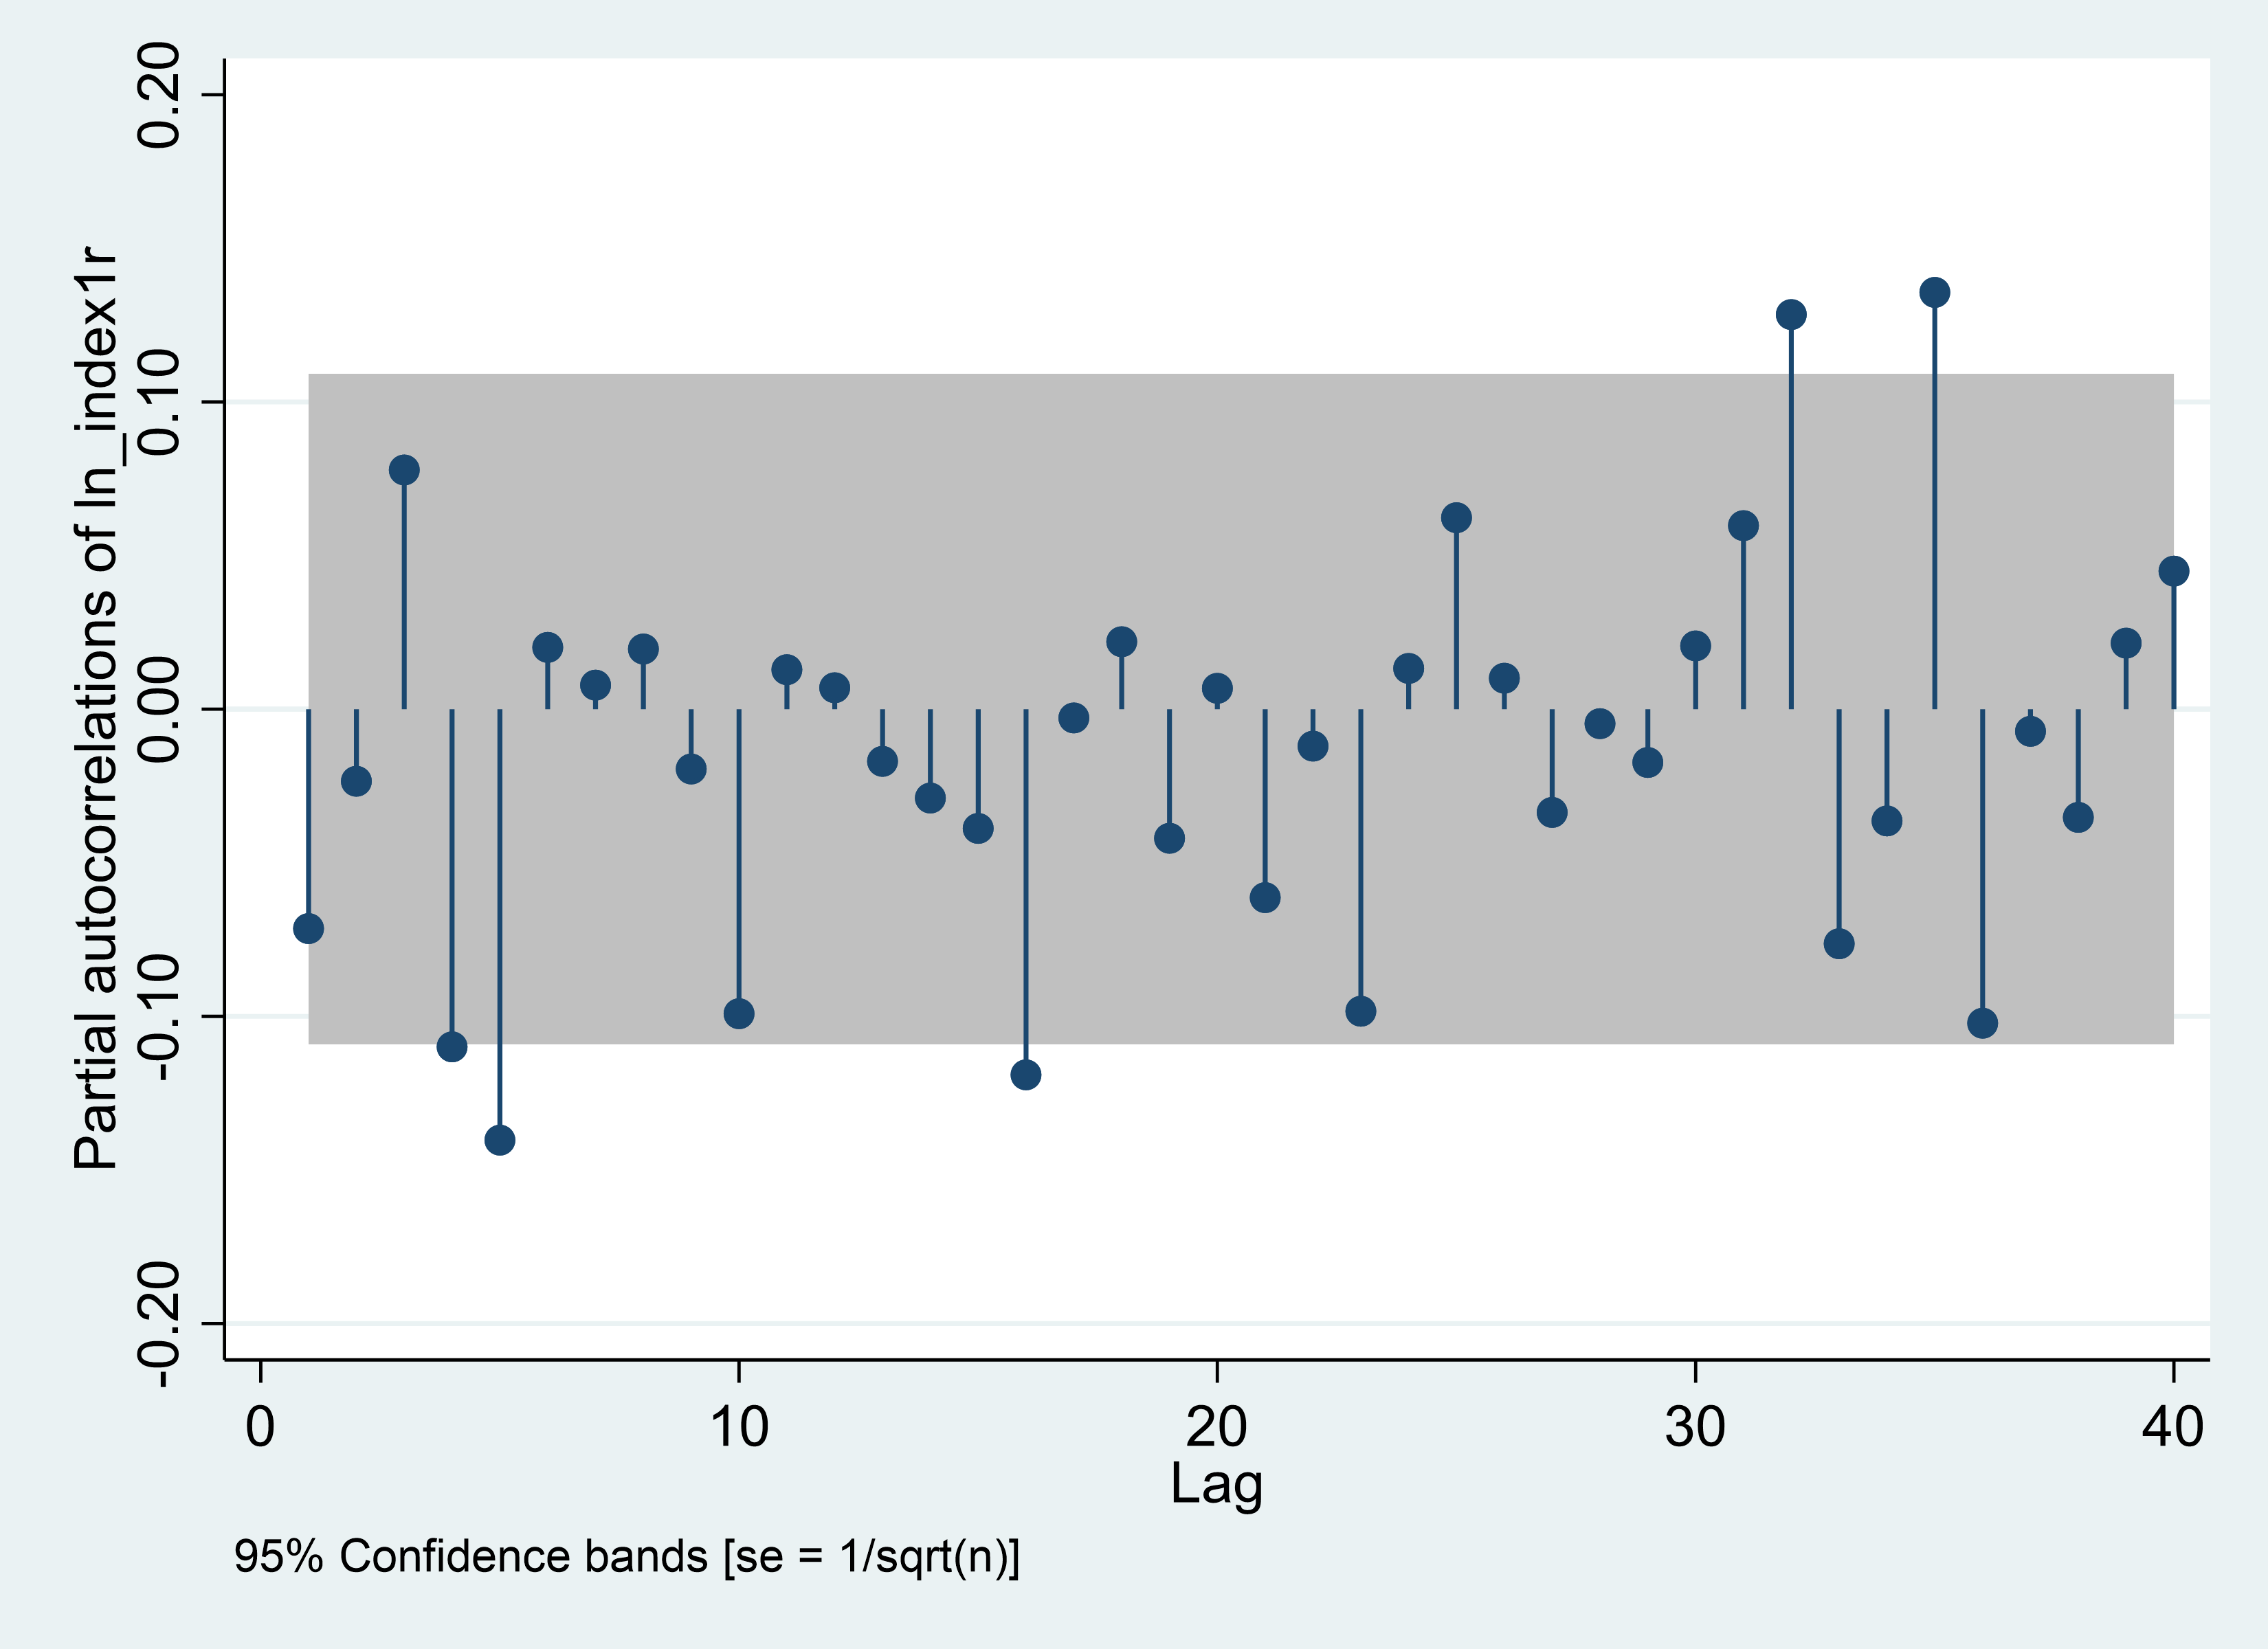
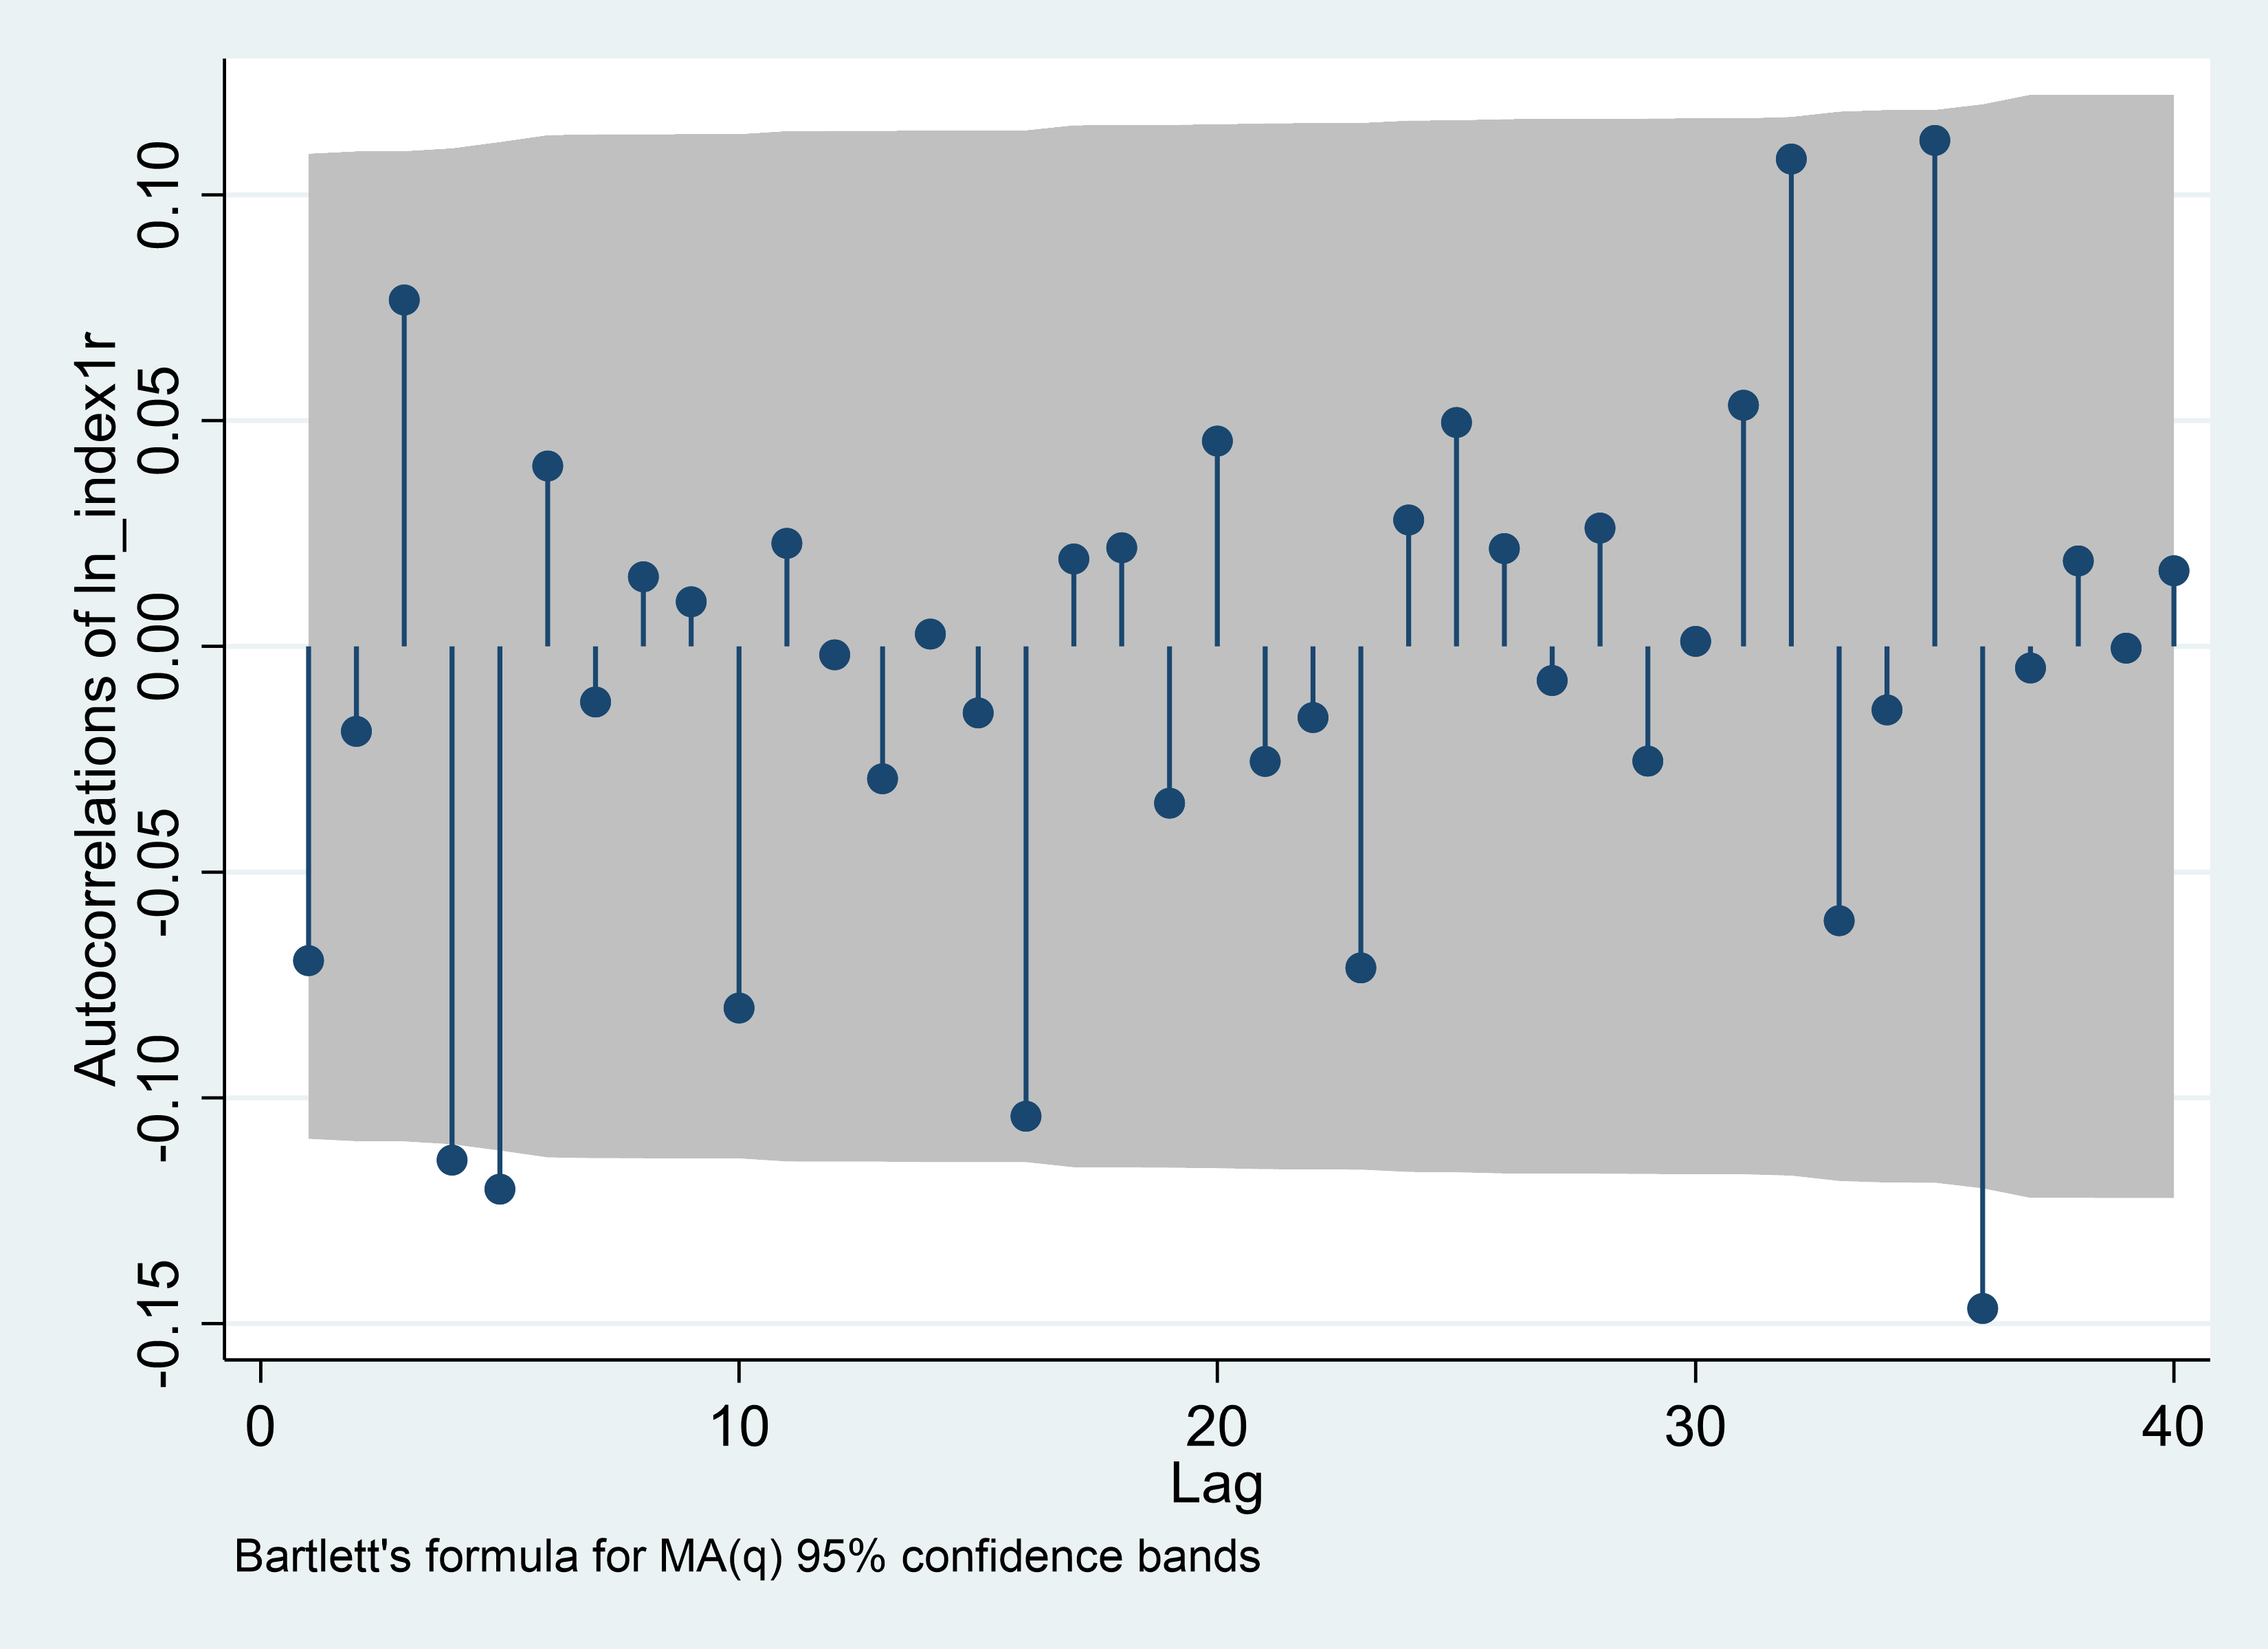
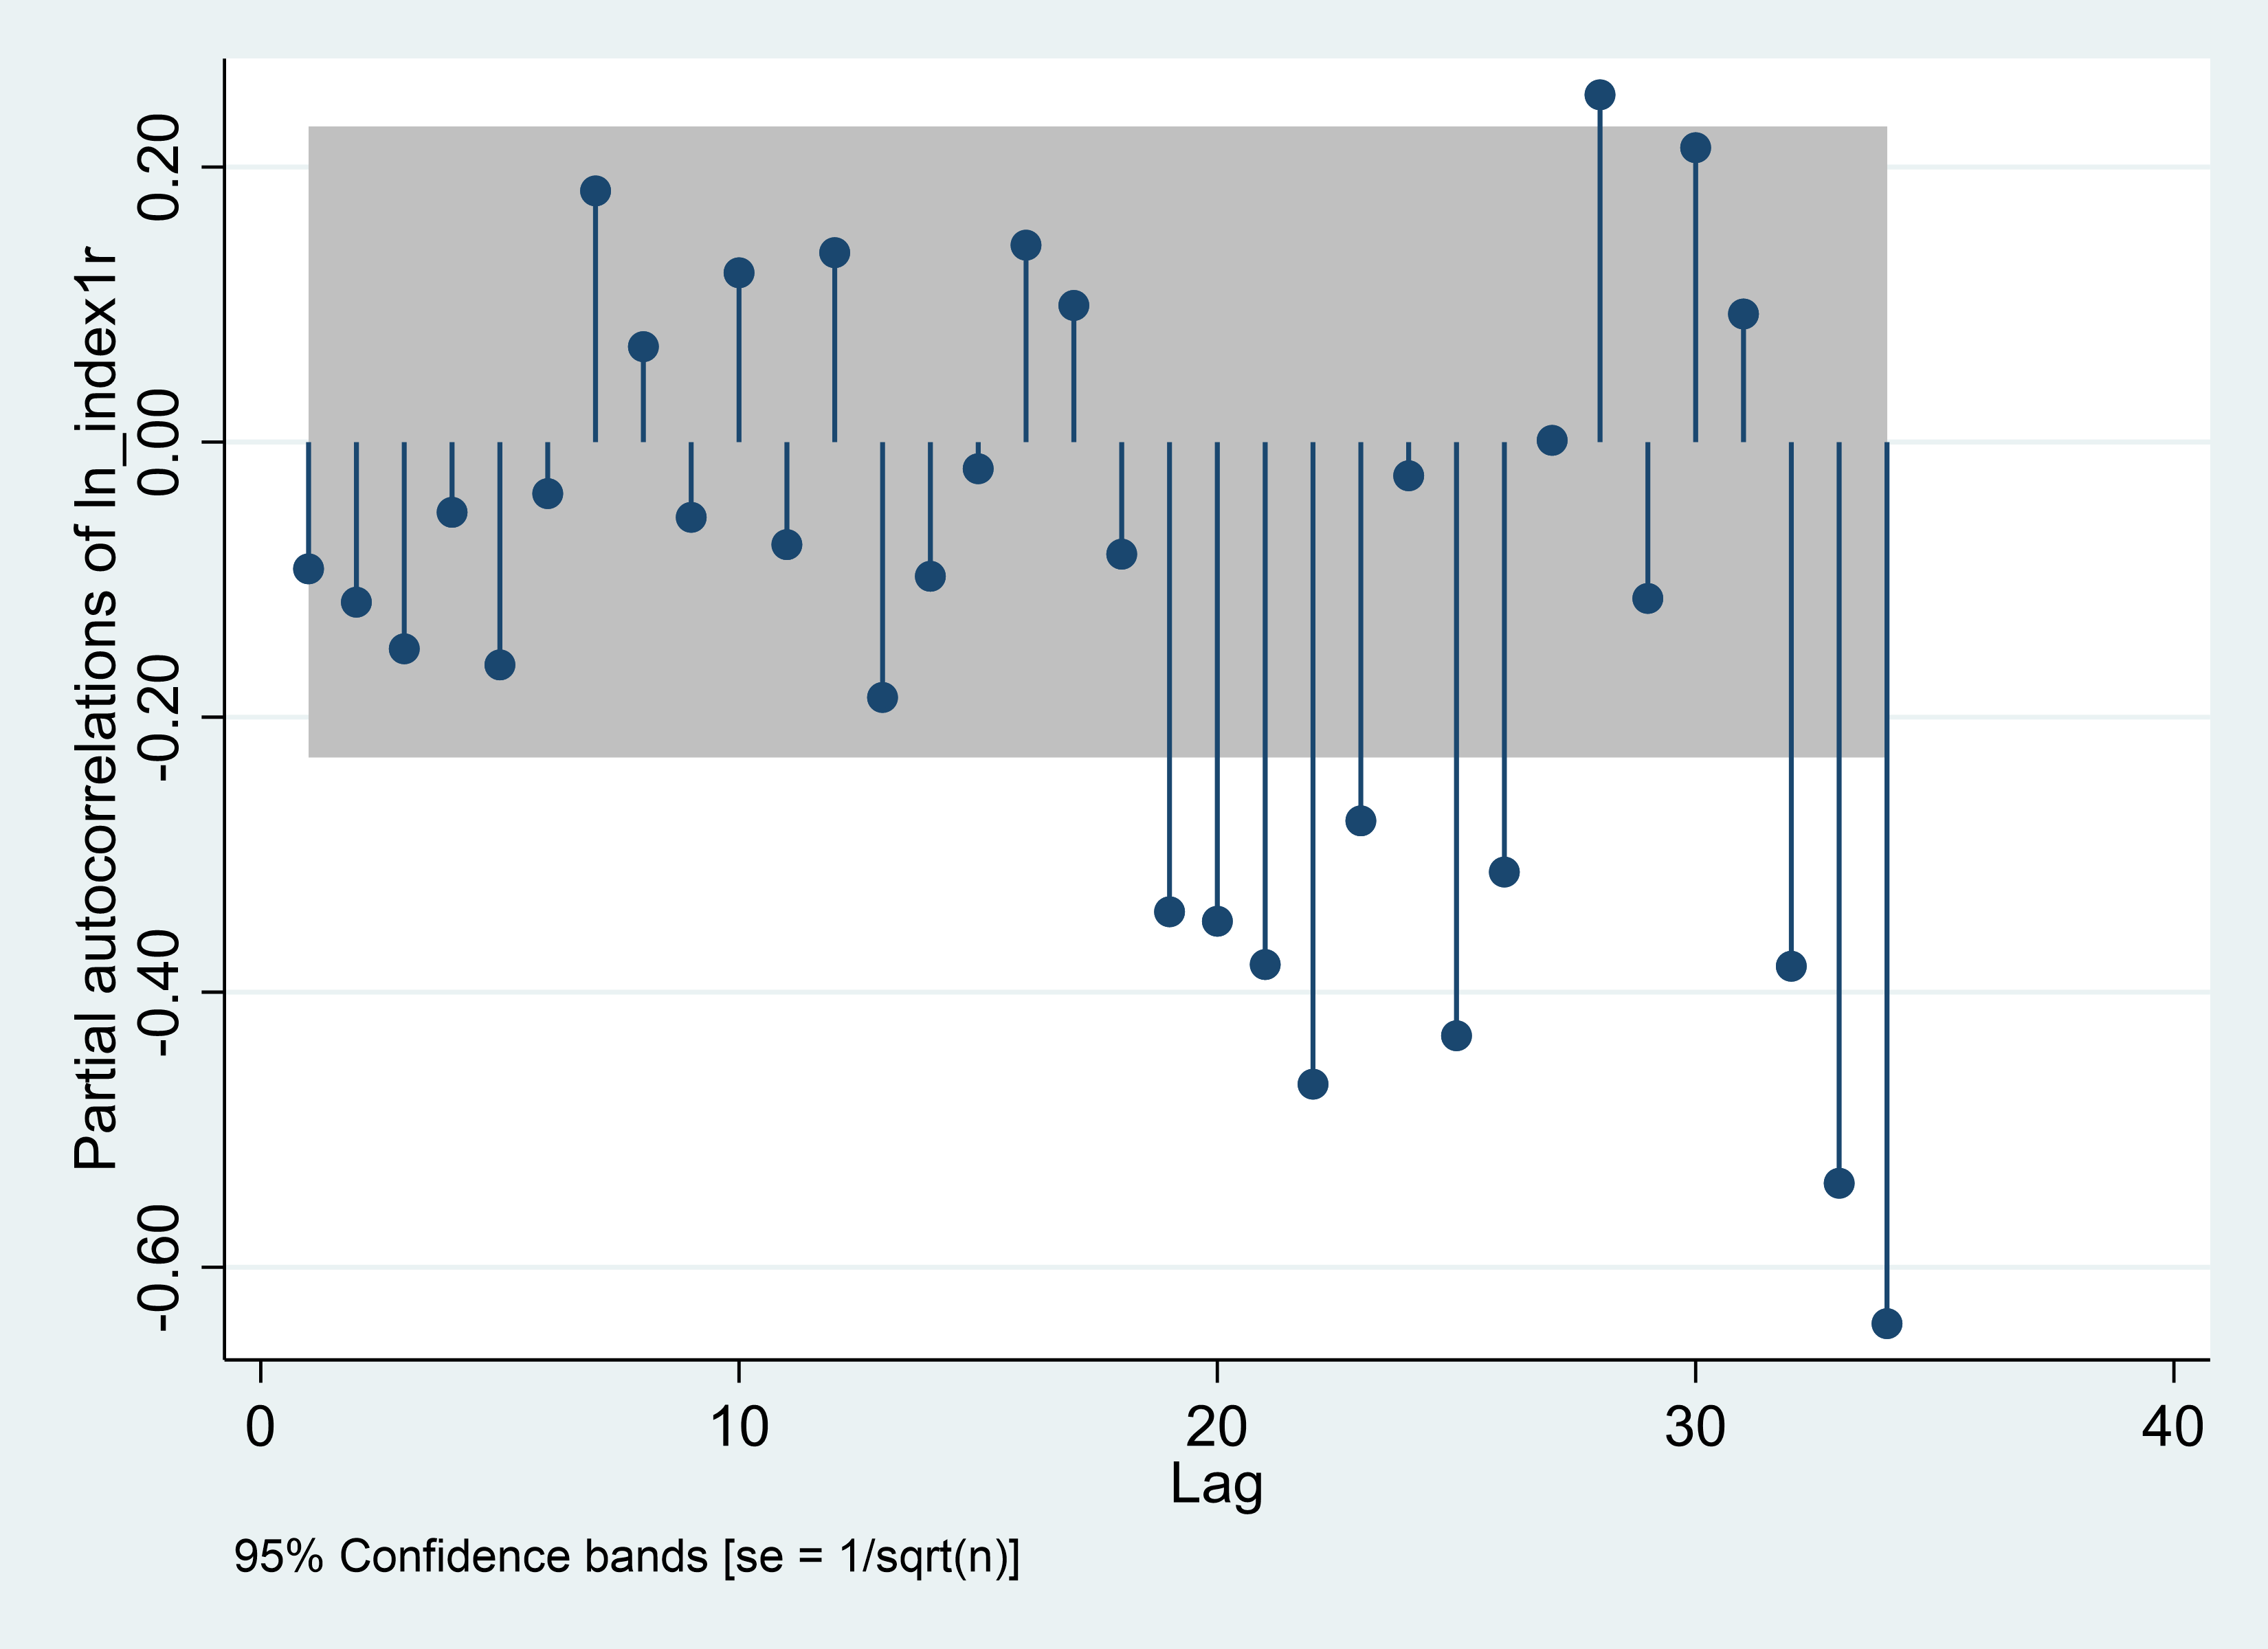
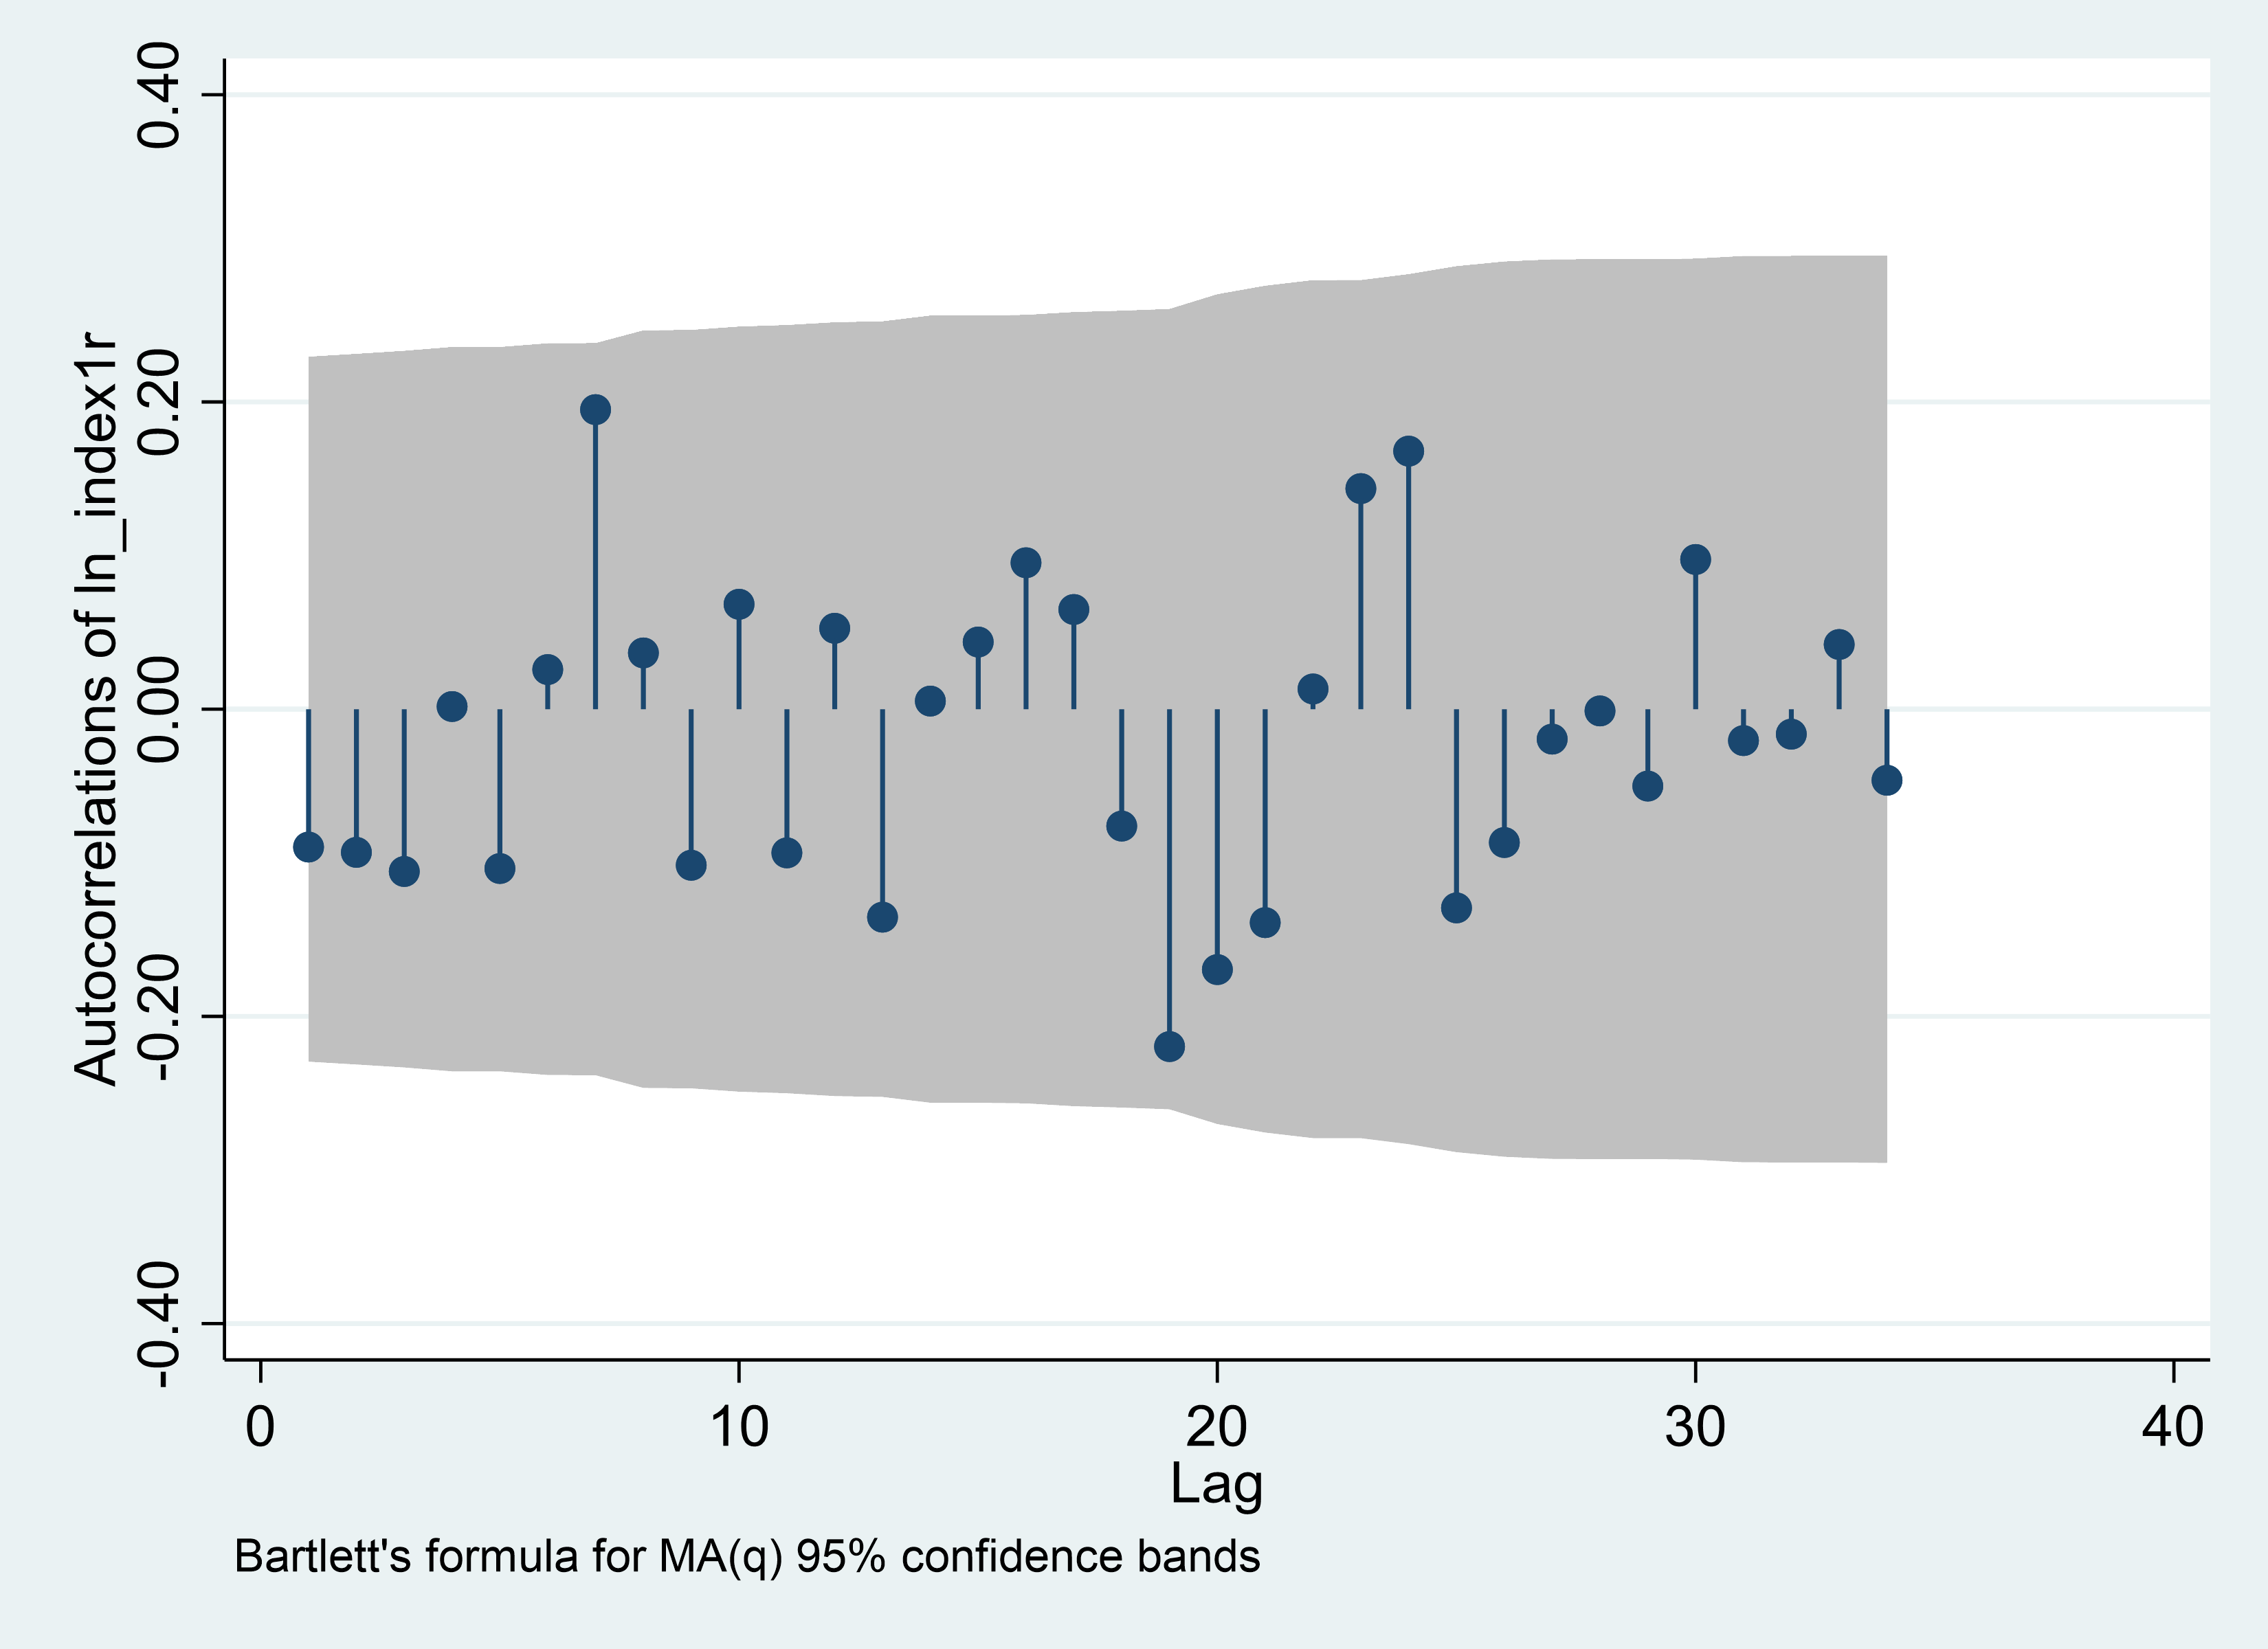
Figure 5 depicts the outcomes obtained from analyzing the initial log-return series using PACF and ACF pairs. From the data, It can be observed that the optimal values for the AR (Autoregressive) term, denoted as AR(p), and the MA (Moving Average) term, denoted as MA(q), are 9 and 10 respectively for the Nasdaq Daily series. Similarly, for the Nasdaq Weekly series, both AR(p) and MA(q) hold a value of 5.
PACF | ACF |
Monthly | |
|
|
Figure 5: ARMA (p, q) identification, Nasdaq. | |
Photo credit: Original | |
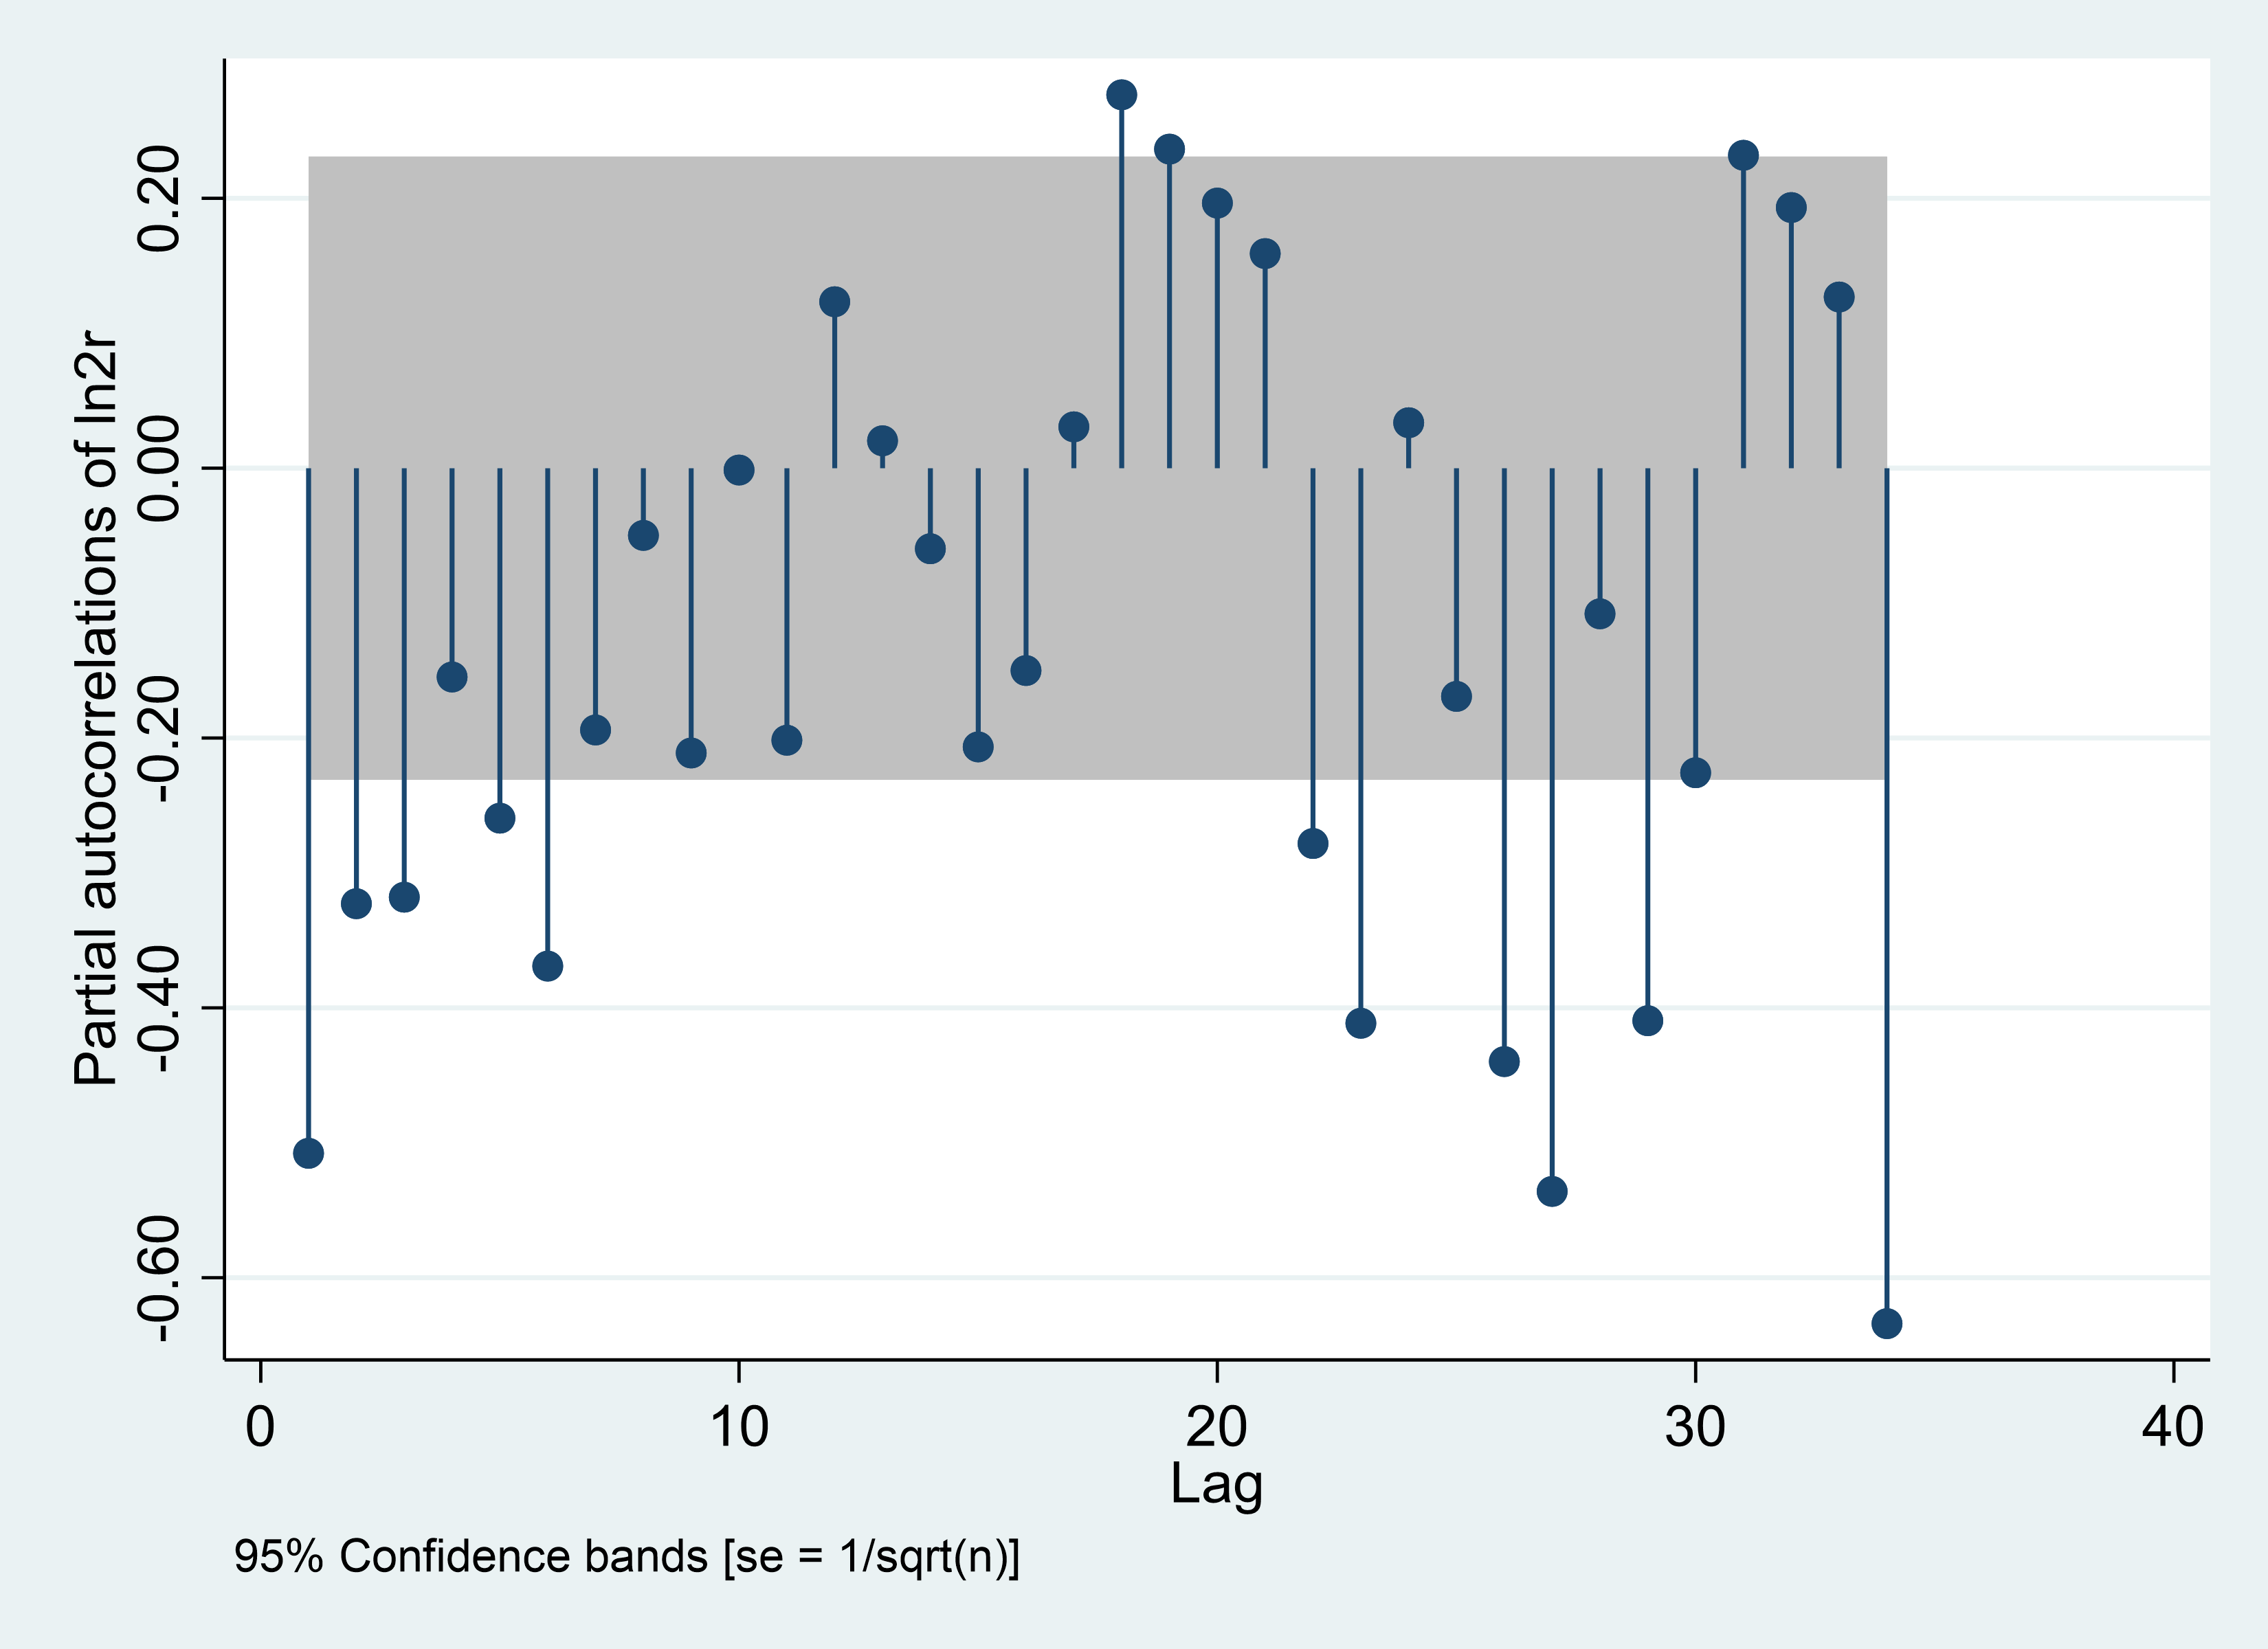
Nonetheless, when examining the Nasdaq Monthly series, it proves challenging to determine the values of AR(p) and MA(q) solely based on the first-order difference. Therefore, a second-order difference is performed, and the resulting findings, presented in Figure 6, indicate that the optimal values for p and q are 6 and 1 respectively.
PACF | ACF |
Daily | |
|
|
Weekly | |
|
|
Monthly | |
|
|
Figure 6: ARMA (p, q) identification, SSEC. | |
Photo credit: Original | |
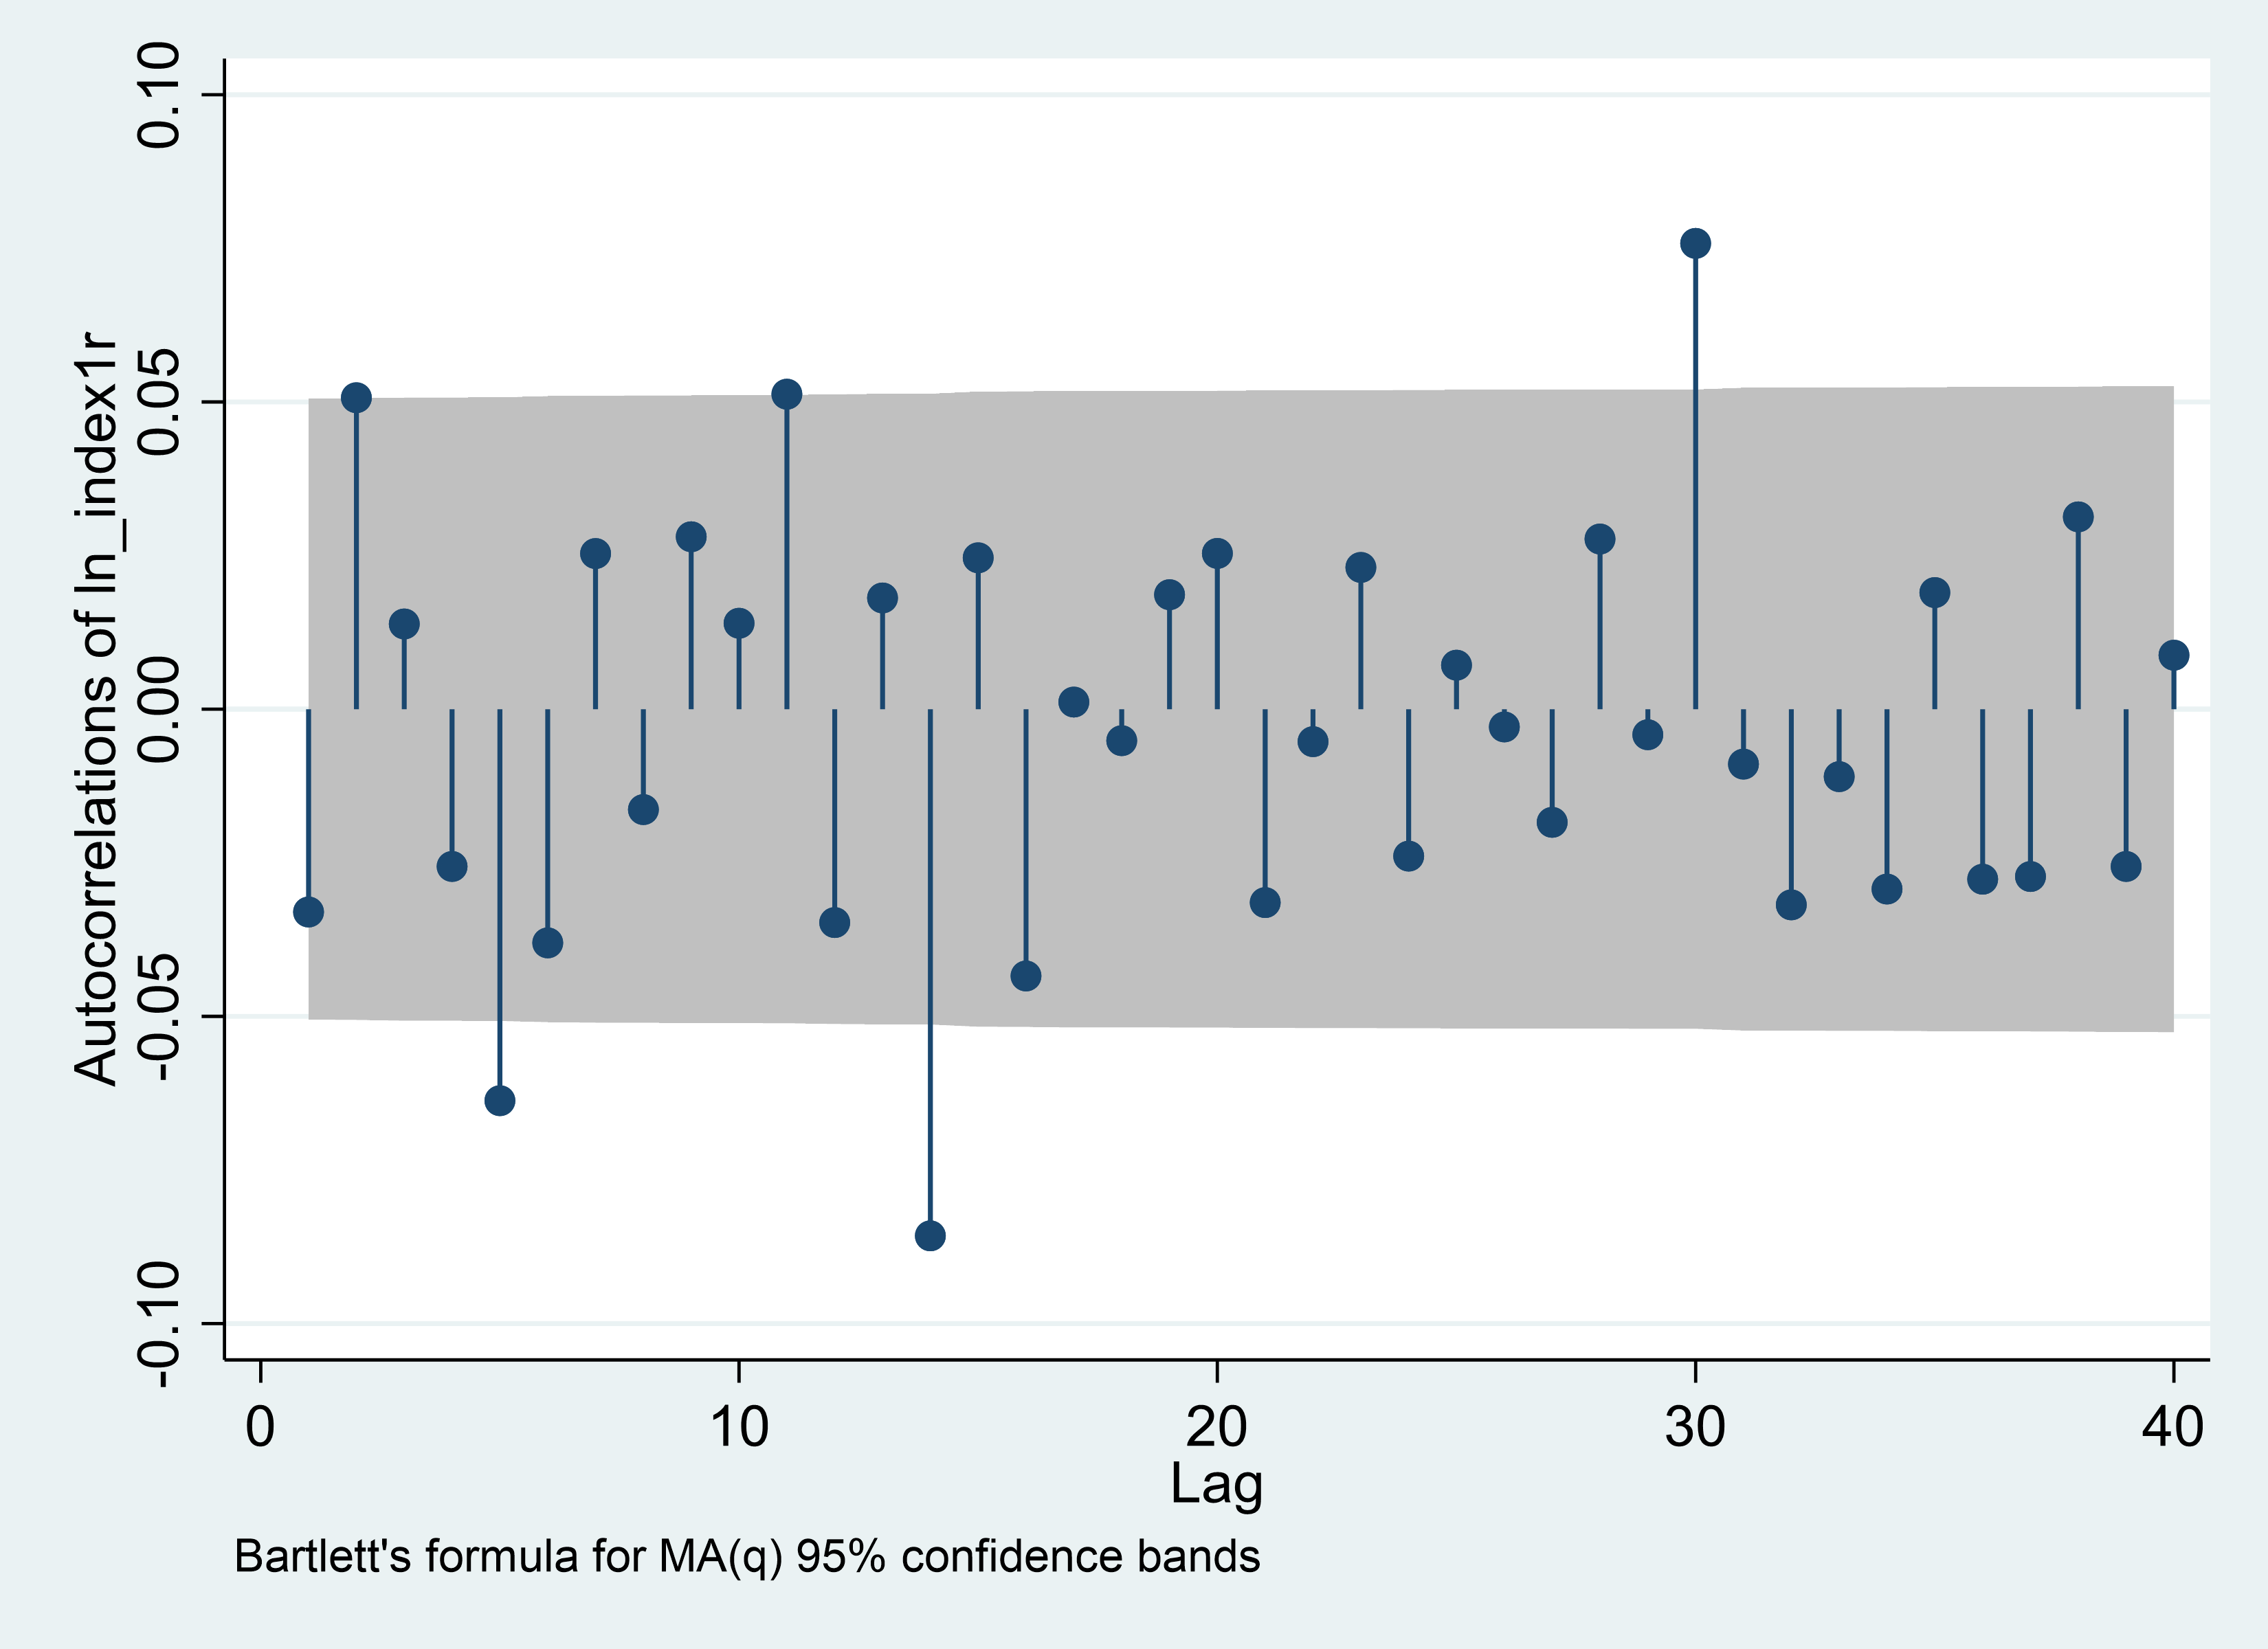
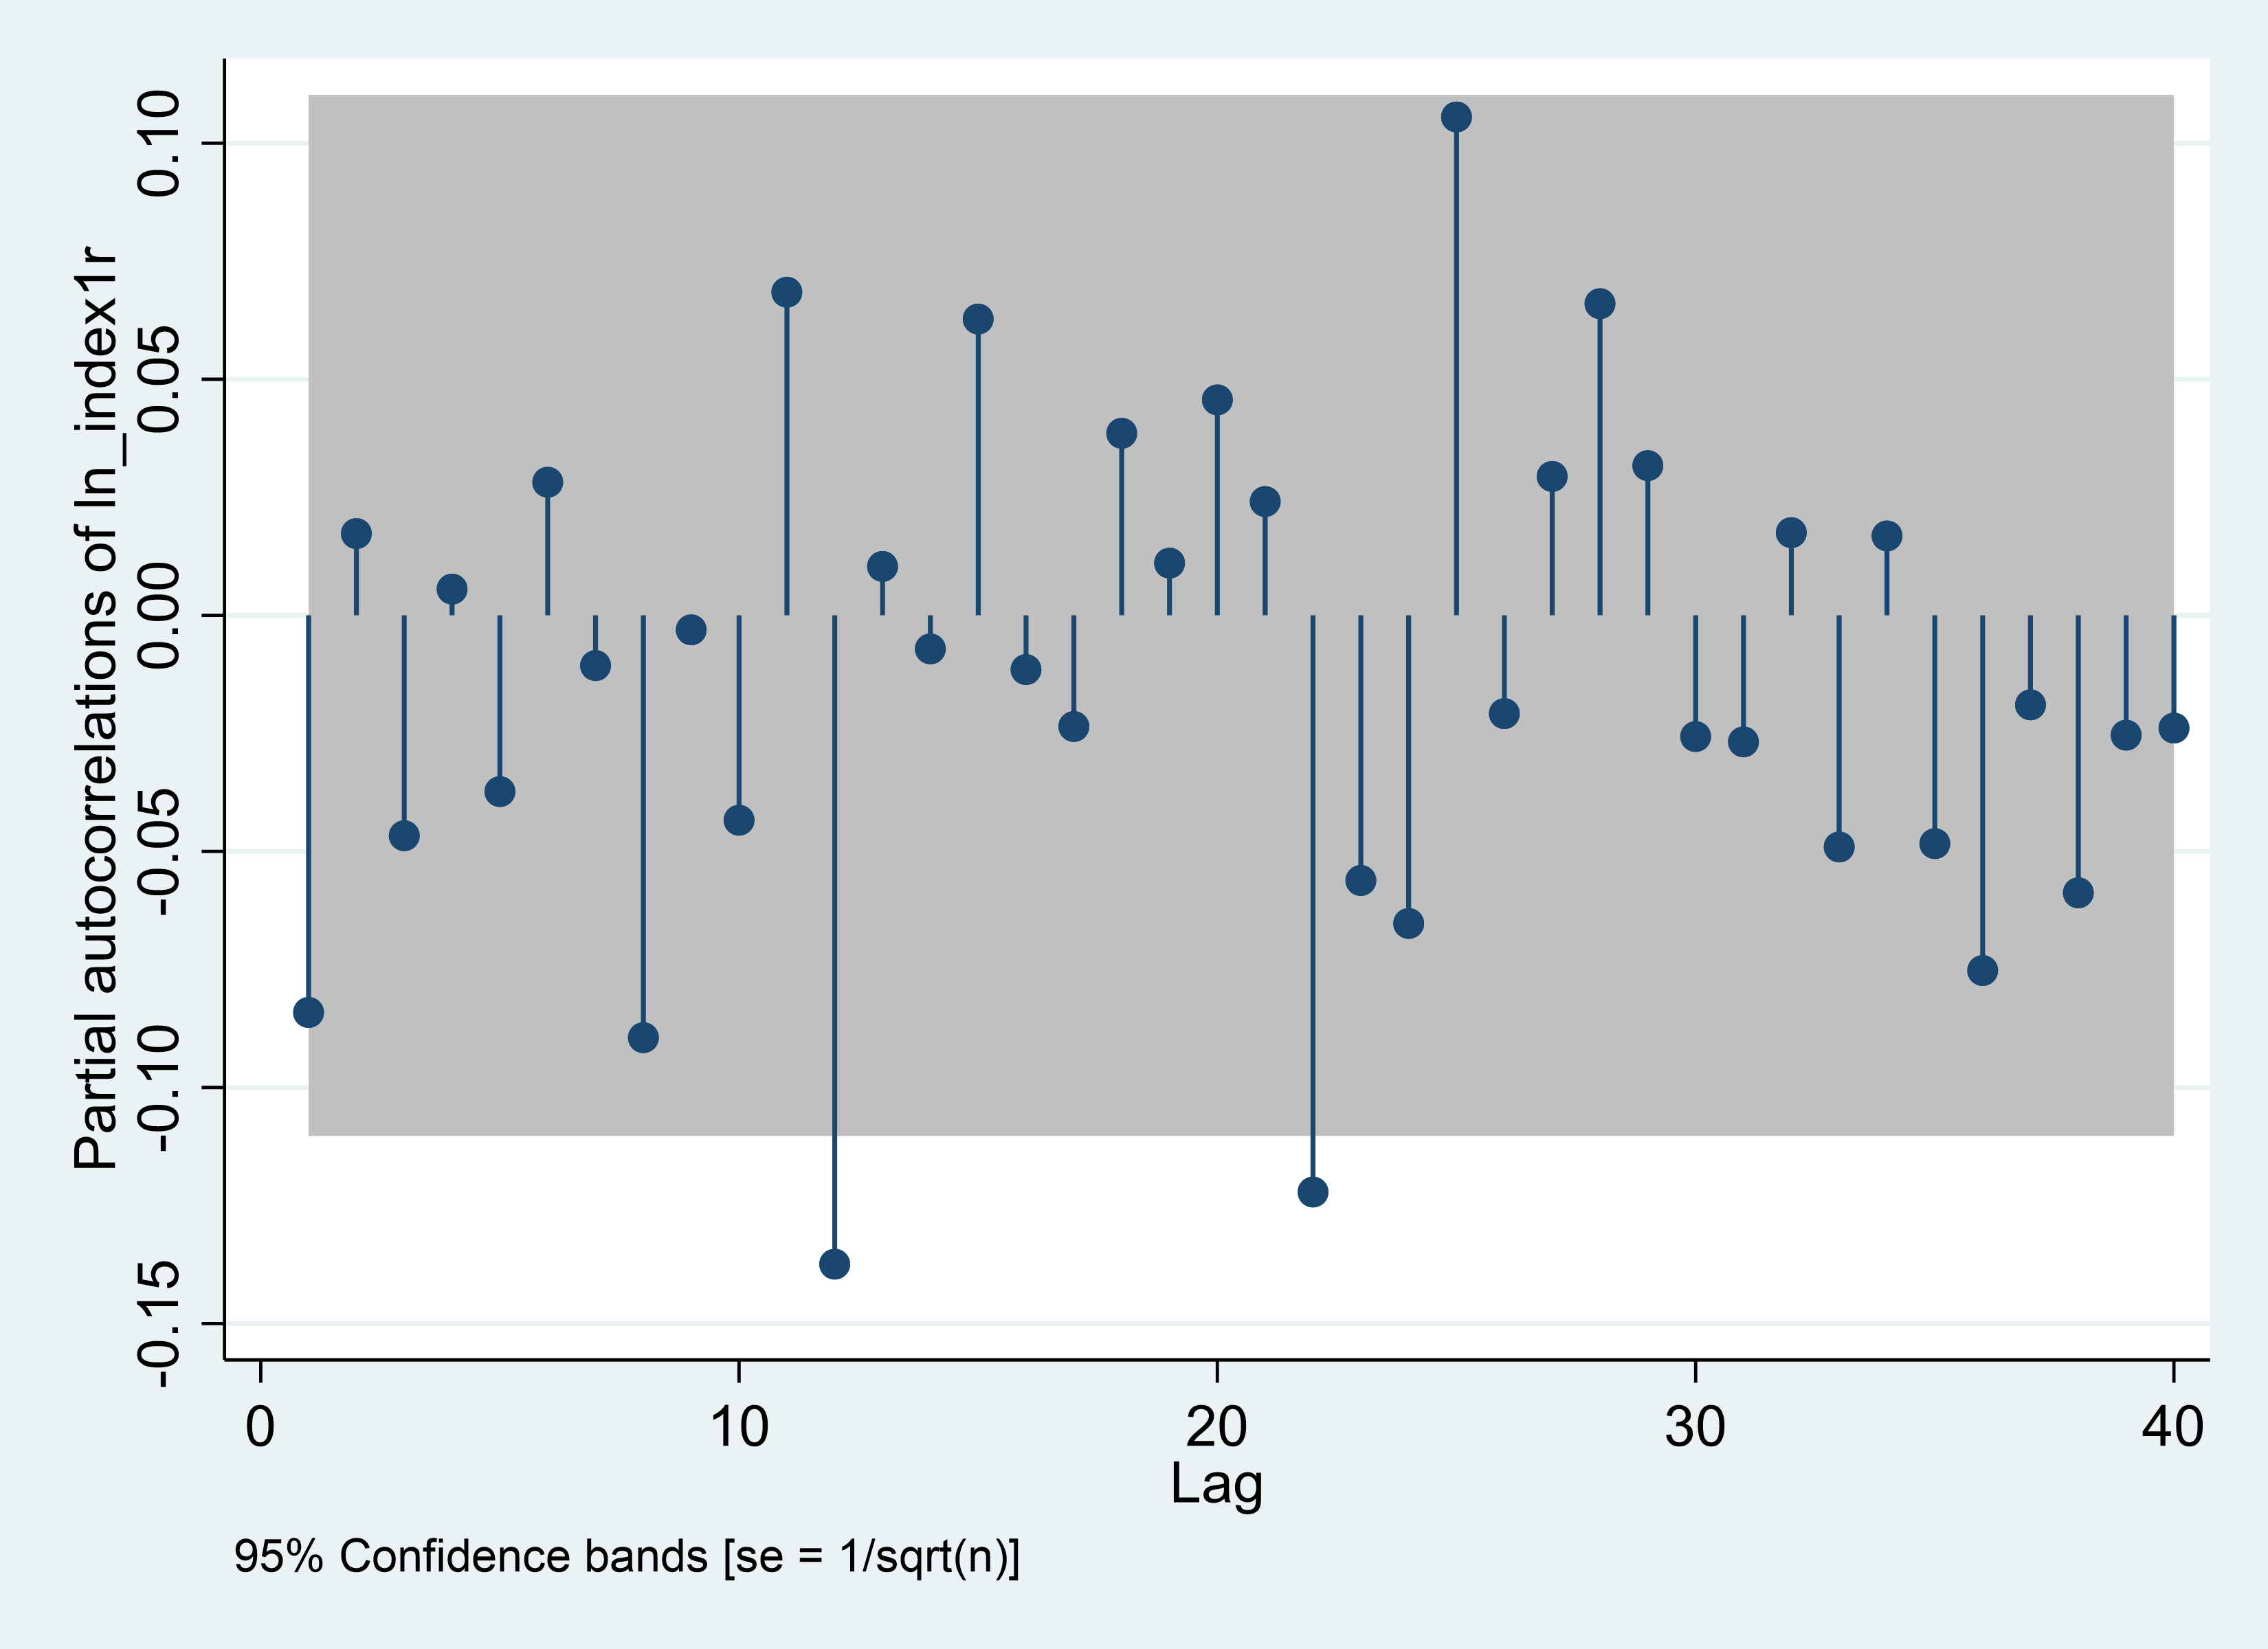
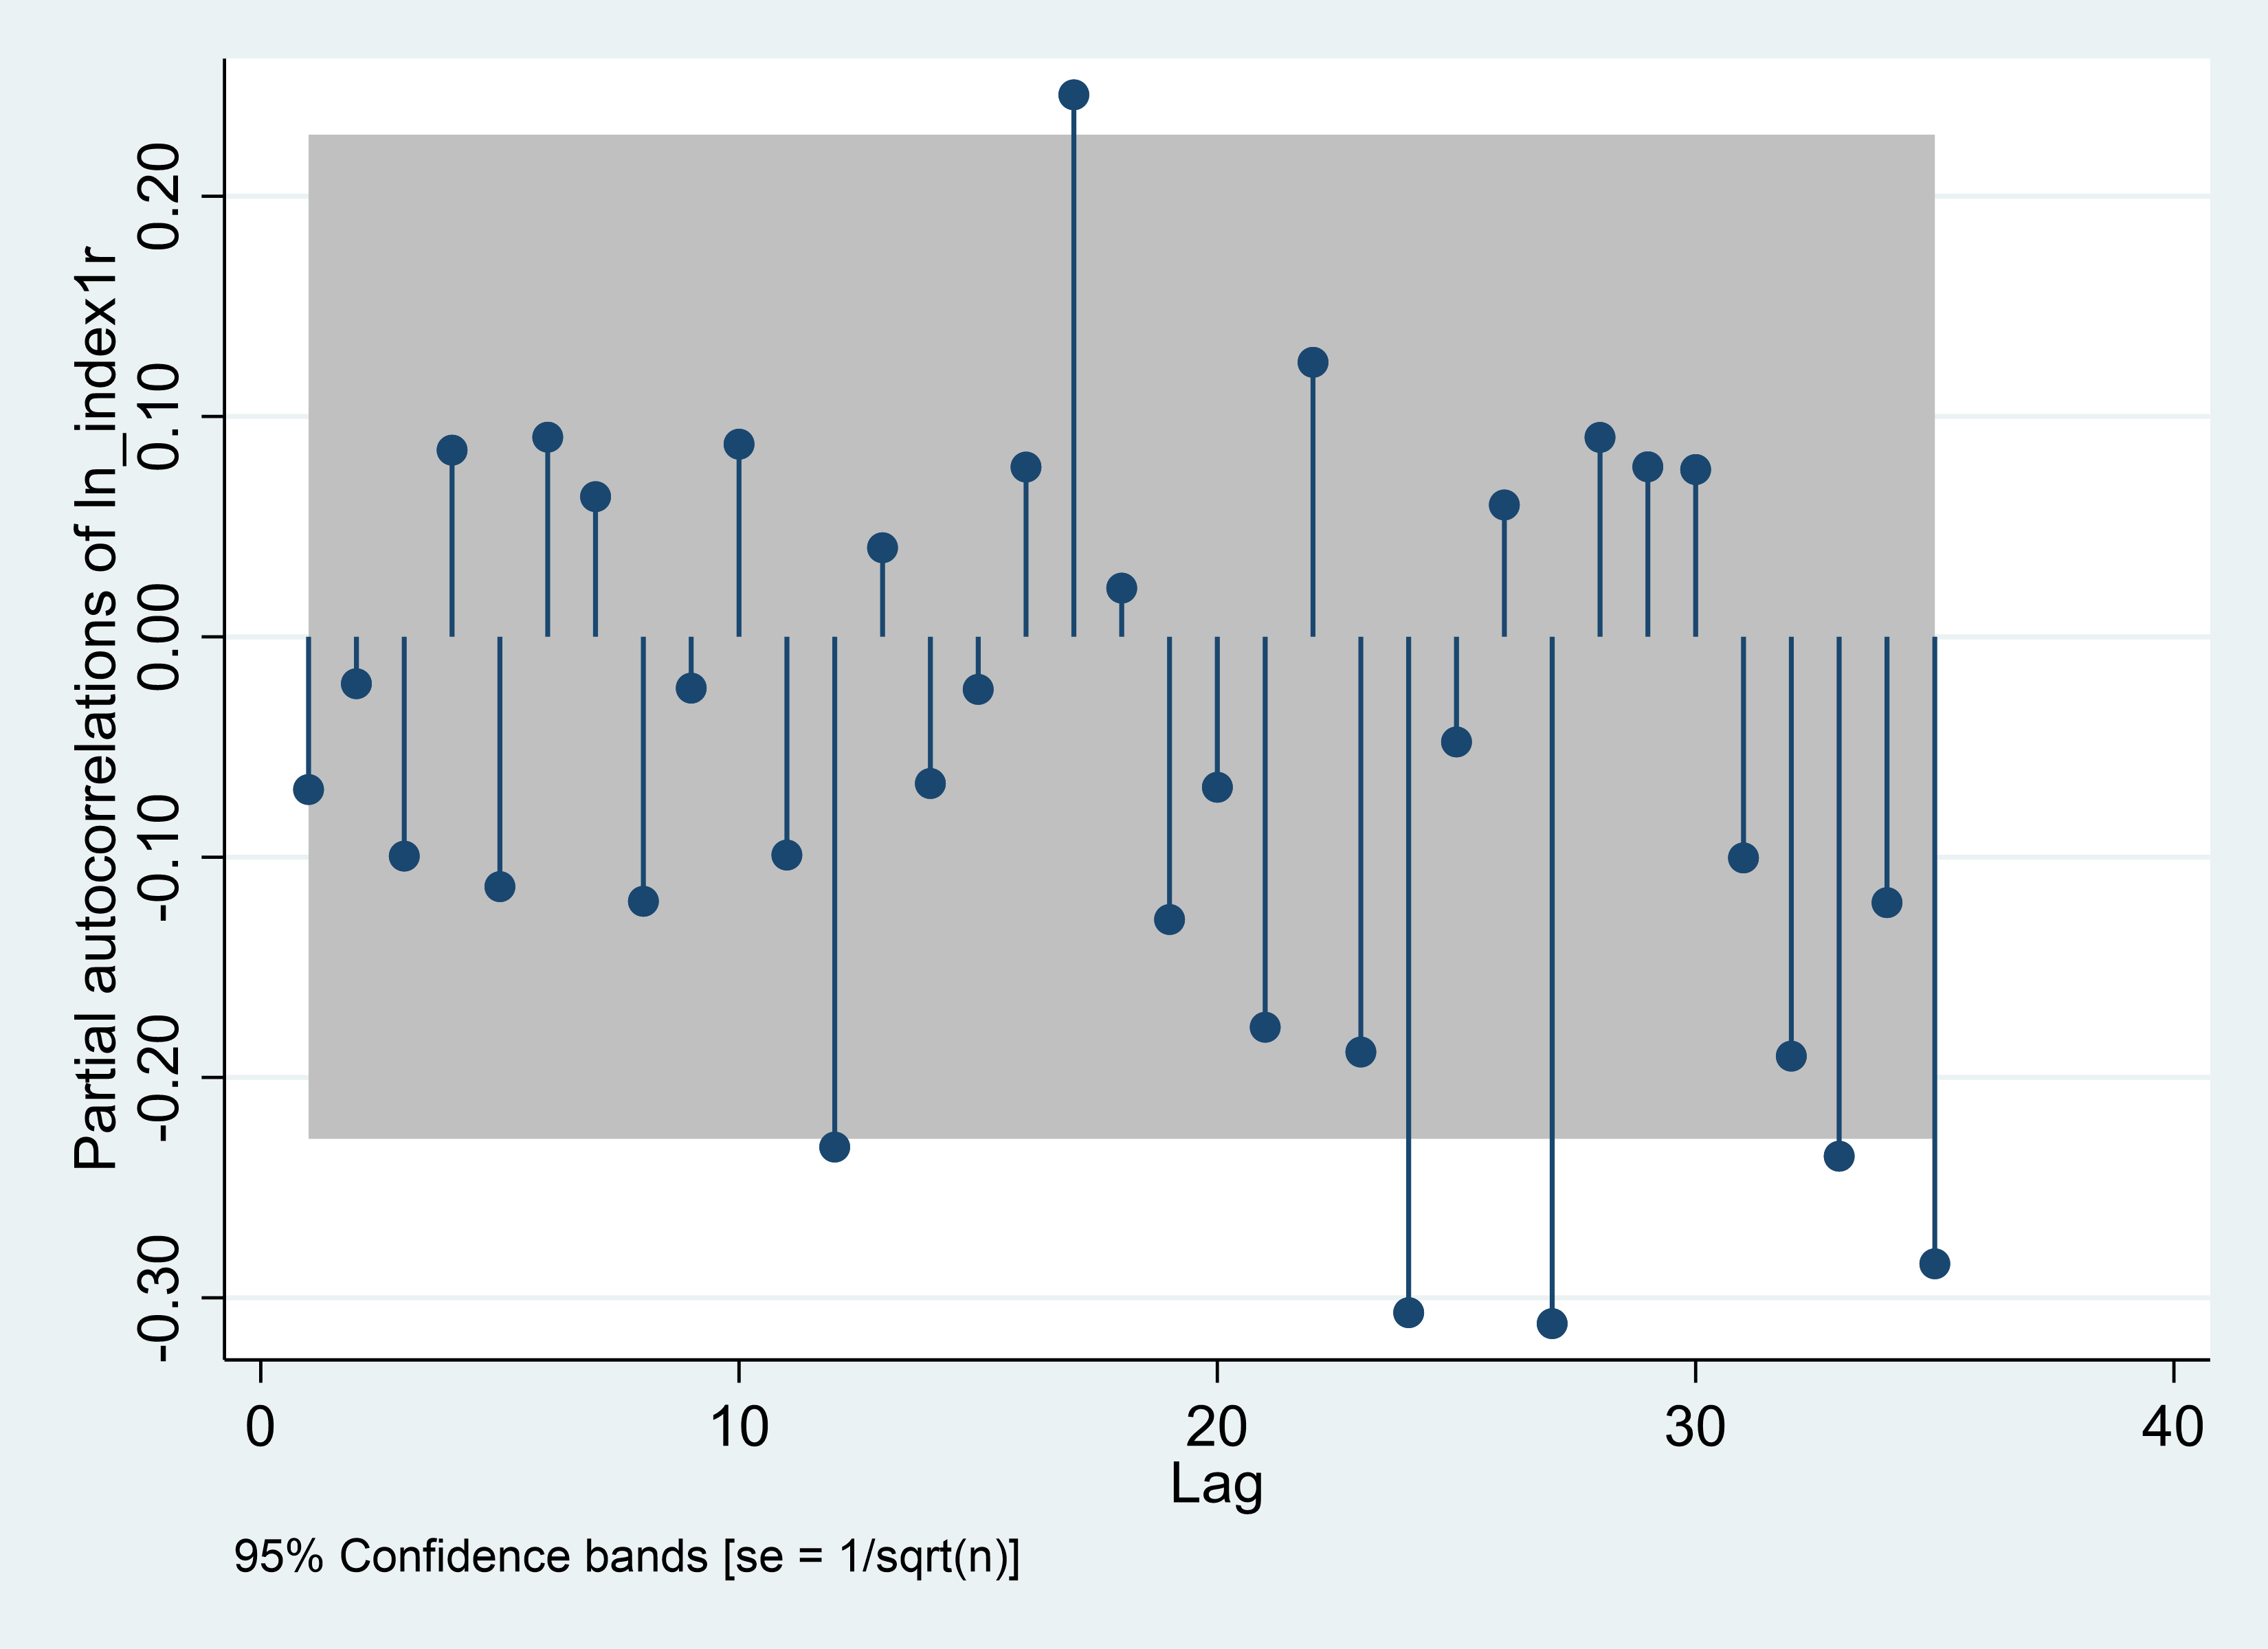
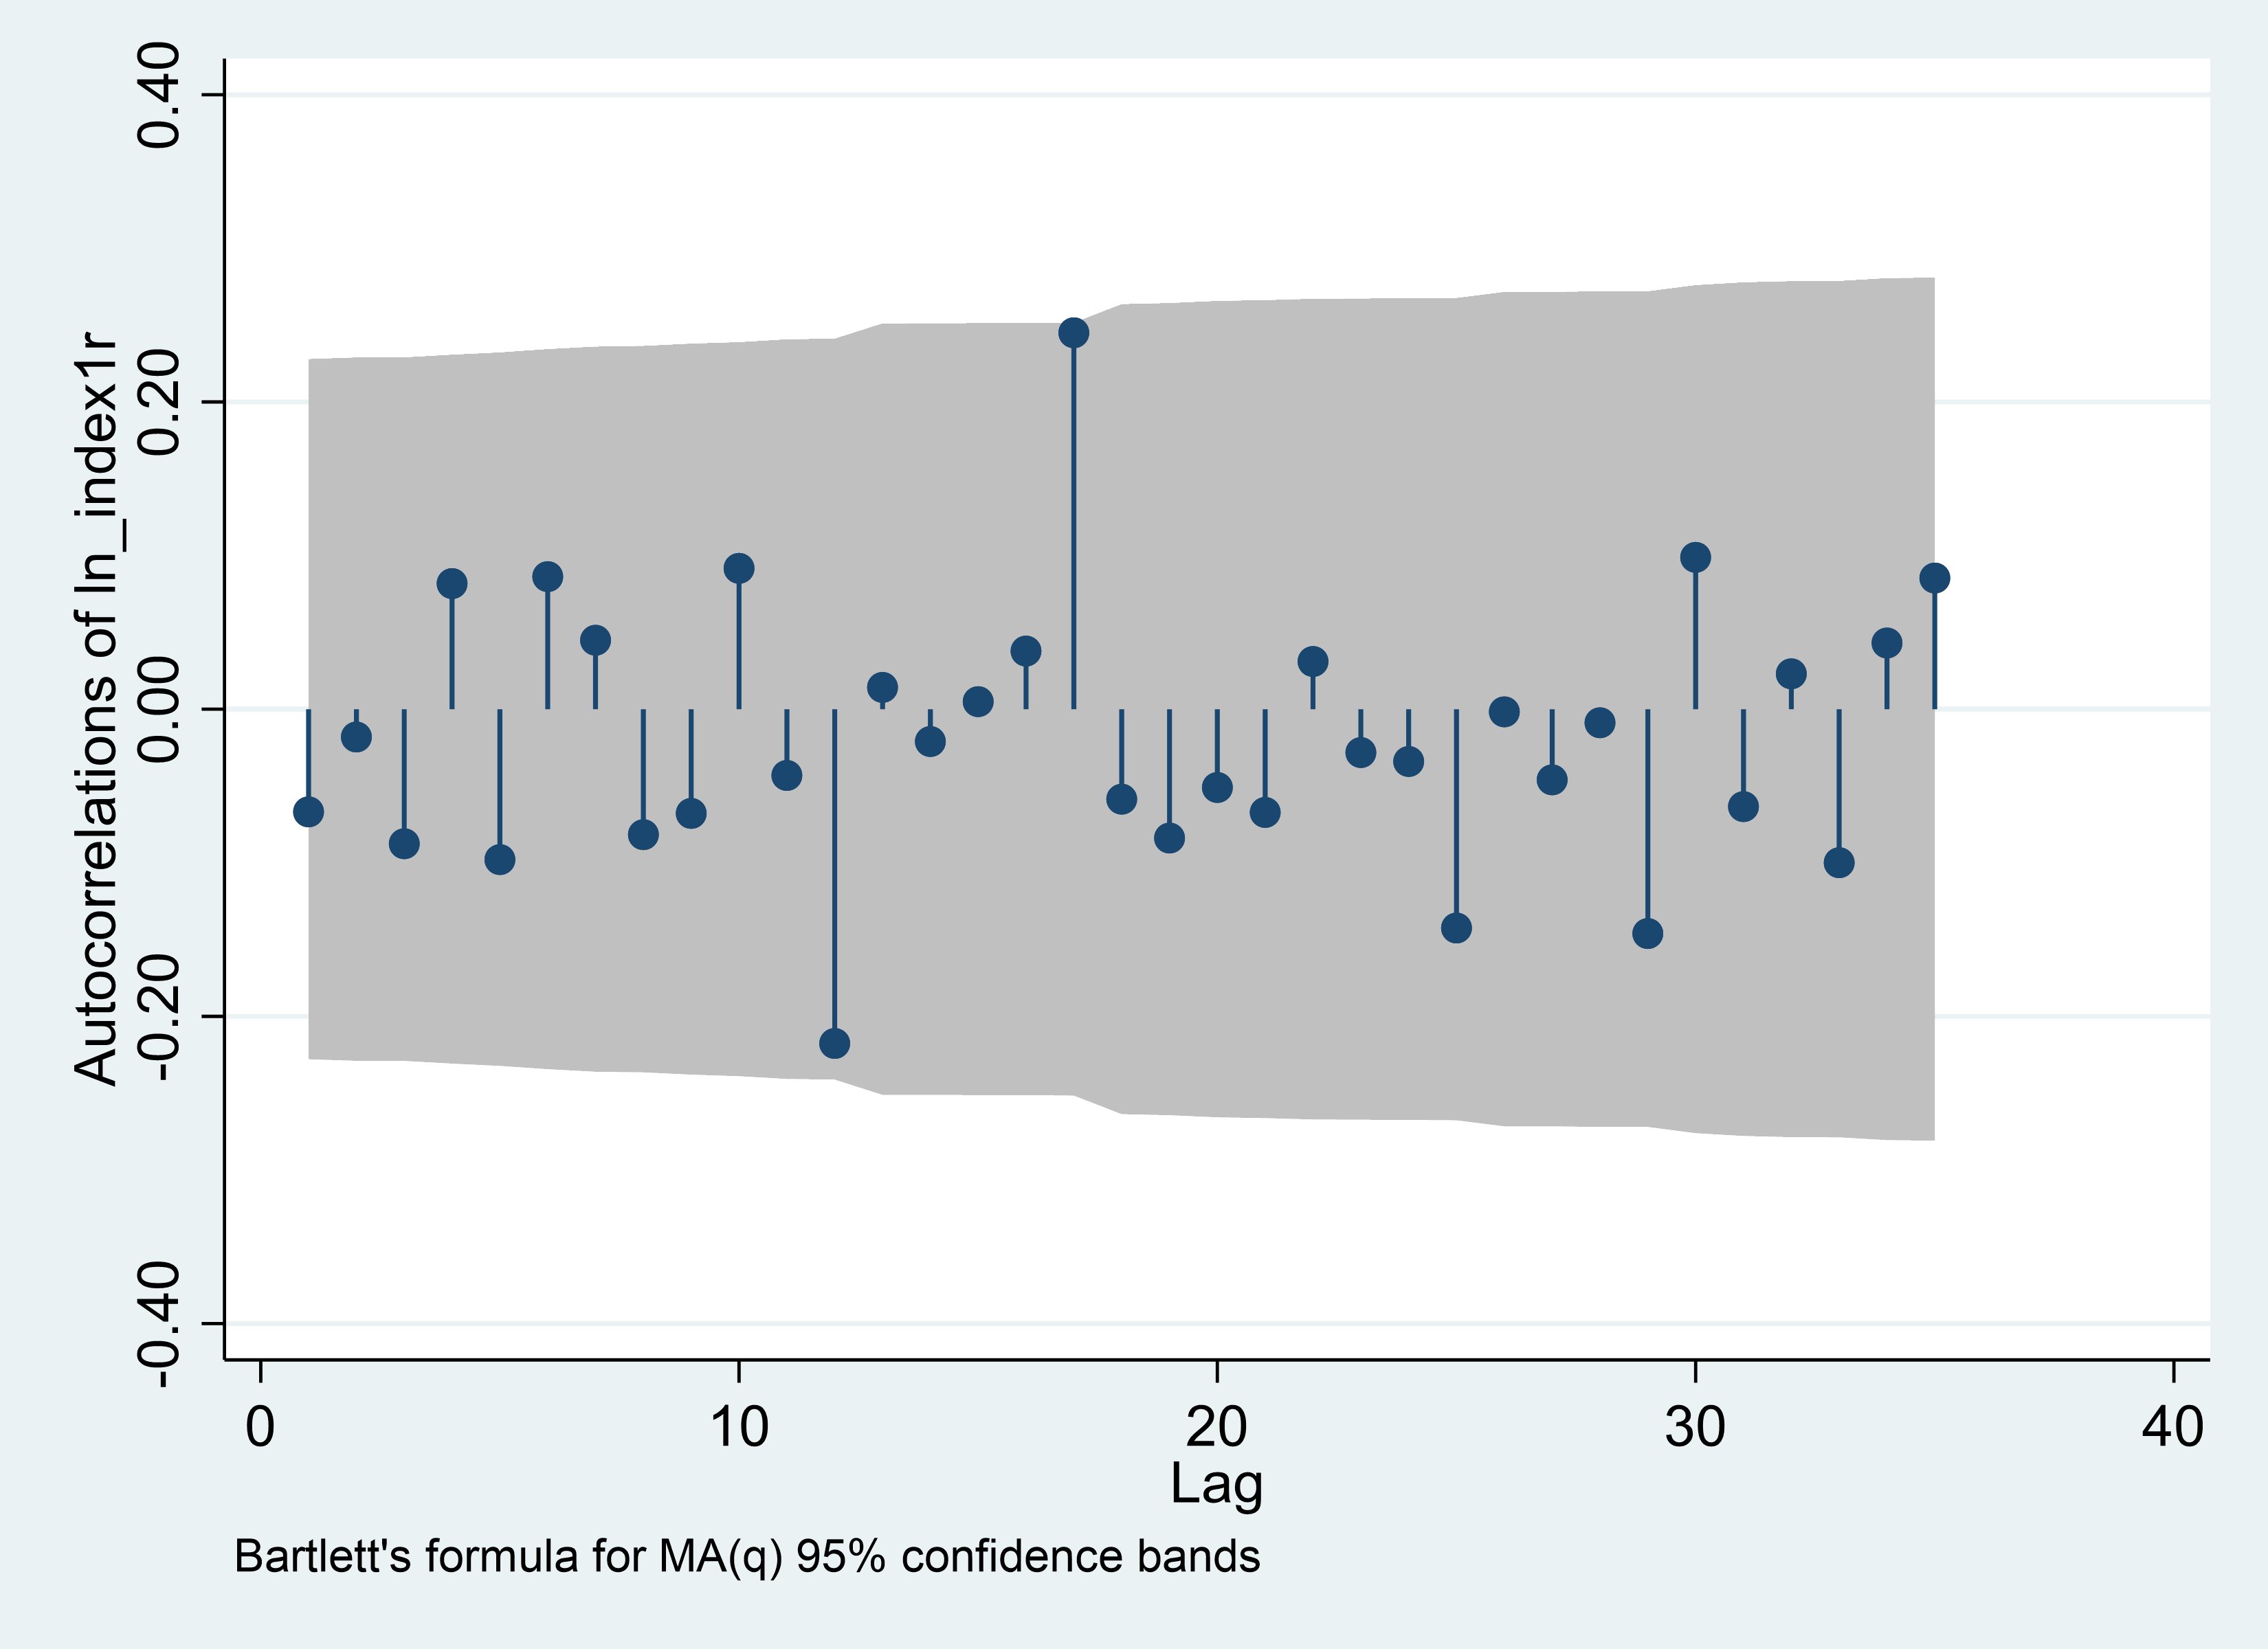
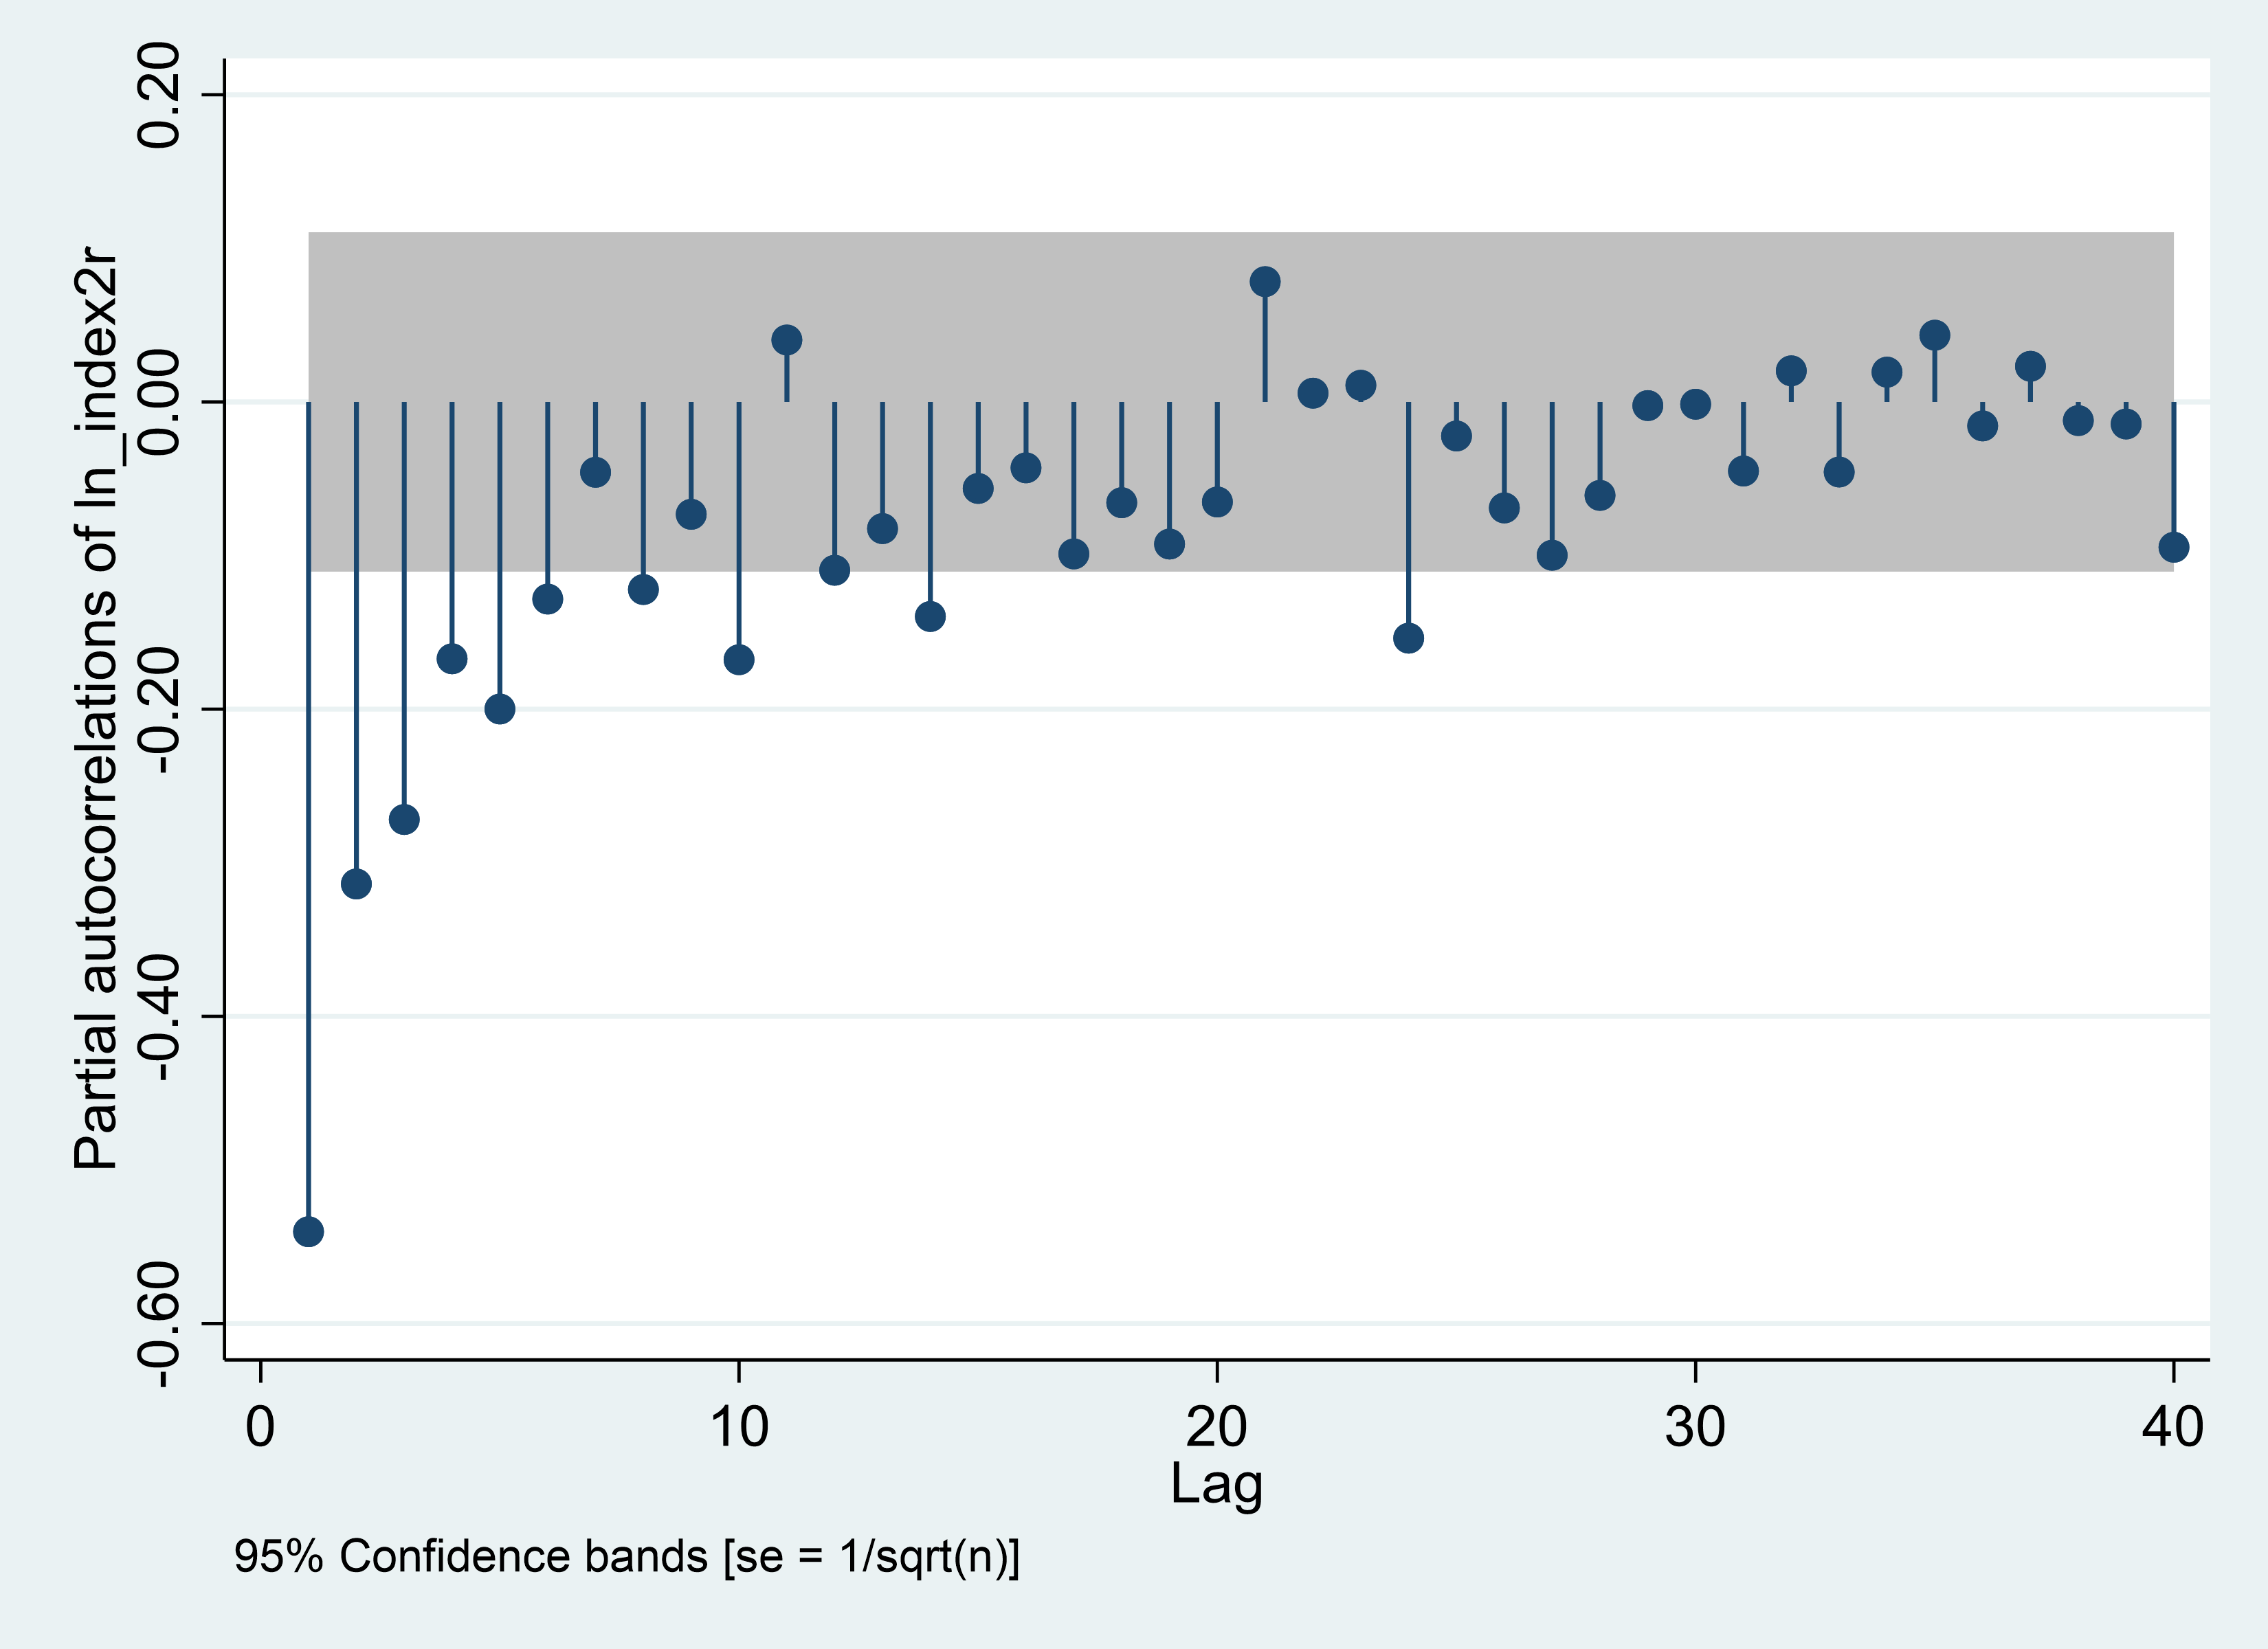
In Figure 7, it is evident that both the AR(p) and MA(q) terms for the SSEC Daily series have an order of 5. However, when applying the first-order difference to the SSEC Weekly and Monthly series, it proves inadequate for determining the appropriate order. Figure 8 displays the results obtained from employing the second-order difference. According to these findings, the optimal values for AR(p) and MA(q) for the SSEC Weekly series are 10 and 1 respectively, while for the SSEC Monthly series, they are 5 and 1 respectively.
PACF | ACF |
Weekly | |
|
|
Monthly | |
|
|
Figure 7: ARMA (p, q) identification, SSEC. | |
Photo credit: Original | |
3.2.2. Predicted Results and Interpretation
Table 2 exhibits the results of the residual test performed using STATA, aimed at evaluating the suitability of a linear regression model. This test involves defining residuals and assessing the corresponding residual plot graphs. Upon analyzing the test results, it is apparent that the p-values are predominantly greater than 0.05. This indicates that the observed p-values are not statistically significant, thereby failing to provide evidence to reject the null hypothesis that the coefficients should be 0.
Table 2: Residual test.
Panel A: Nasdaq | Portmanteau (Q) statistic | Prob > chi2 |
Daily-ARIMA(9,1,10) | 31.1212 | 0.8417 |
Weekly-ARIMA(5,1,5) | 38.5099 | 0.5374 |
Monthly-ARIMA(6,2,1) | 45.2851 | 0.2609 |
Panel B: SSEC | ||
Daily-ARIMA(5,1,5) | 61.3064 | 0.0167 |
Weekly-ARIMA(10,2,1) | 30.0392 | 0.8741 |
Monthly-ARIMA(6,2,1) | 28.1791 | 0.9198 |
Using ARIMA, we firstly forecasted trend of both Nasdaq and SSEC within a 10-day period, from 2022-3-16 to 2022-3-29. In theory, an increase in interest rates by the Federal Reserve would typically lead to a narrowing of the gap between stock market returns and government bond yields. Capital tends to flow from the stock market to the bond market, and depositors may opt to keep their funds in banks, indirectly causing a decrease in the available capital for stock market investments and subsequently leading to a decline in stock prices and indices. However, both the Nasdaq and SSEC have exhibited an upward trend (Figure 9), which could be attributed to market reactions that tend to have a delayed effect on policy changes.[12] It is also possible that the financial markets had already made valuation adjustments before the interest rate hike was announced. As a result, once the policy was implemented, the short-term uncertainty decreased, leading to a recovery in the indices [13].
Nasdaq | SSEC |
Figure 8: Actual value and fitted value, daily. | |
Photo credit: Original | |
Through Figure 6, we can clearly observe a significant downward trend in both the Nasdaq and SSEC indices. Interestingly, the predicted values depict a steady upward trajectory. This indicates that the market is beginning to react to the interest rate policy, and the synchronous changes in the Nasdaq and SSEC precisely reflect the spillover effect of the Federal Reserve's interest rate hike on the Chinese stock market.
Nasdaq | SSEC |
Figure 9: Actual value and fitted value, weekly. | |
Photo credit: Original | |
Looking further into the long-term forecast, over the next six months, the Nasdaq is projected to exhibit an overall downward trend, with a significant deviation from the predicted values. This can be attributed to the Federal Reserve's consecutive interest rate hikes of 25 basis points on May 4th, 50 basis points on June 15th, and 75 basis points on July 27th, which heavily impacted the U.S. stock market. On the other hand, the Shanghai Stock Exchange Composite Index (SSEC) displayed a pattern of initial decline, followed by an upward movement, and then another decline. In comparison to the predicted values, the SSEC demonstrated higher volatility, indicating a stronger market response.
Nasdaq | SSEC | |
Figure 10: Actual value and fitted value, monthly. | ||
Photo credit: Original | ||
4. Discussion
Compared to other articles, this paper primarily focuses on the impact of Federal Reserve interest rate hikes on the financial investment sector. It analyzes the stock returns of Nasdaq and SSEC to assess the influence of this prolonged U.S. interest rate cycle on the Chinese economy, particularly the performance of the stock market. In contrast, other articles analyze the effects from perspectives such as exchange rate fluctuations, the appreciation of the U.S. dollar, global trade, import and export figures, inflation, corporate financing, and financial risks. This paper also shares many similarities with other studies, as it employs methodologies or related transformations such as VAR model, ARMA model, and ARMA-GARCH model to predict future movements.
Through this article, we can observe that as the United States takes the lead as the world's largest economy and the US dollar remains the most widely circulated currency, adjustments in the monetary policy of the Federal Reserve will generate significant spillover effects, causing a "resonance" in financial markets worldwide. China, as a representative of emerging economies, has continuously opened its financial markets since the implementation of reforms and opening up, aligning with the international financial system, and inevitably being influenced by international capital flows.
Taking empirical research findings as a starting point, the study suggests that Chinese policymakers should enhance their tracking and analysis of the impact of US monetary policy changes on our stock market, while ensuring effective monitoring, assessment, and response measures. The central bank should fully consider the spillover effects of Federal Reserve's monetary policies and accurately grasp the timing of domestic policy adjustments to prevent exacerbated fluctuations in the financial market.
Investors, facing risks such as interest rate hikes by the Federal Reserve, should recognize that the monetary policy of the United States has spillover effects on not only the Chinese stock market but also global stock markets, intensifying market volatility. It is crucial to assess such risks, adjust investment portfolios reasonably based on market expectations, and reduce investment risks.
5. Conclusion
Since March 2022, the Federal Reserve has implemented eleven consecutive interest rate hikes, and as of now, Federal Reserve Chairman Powell has not ruled out the possibility of further increases. These actions have had profound effects on the global economy and financial order, causing significant spillover effects on countries in East Asia, such as South Korea and Japan. China, as a representative of emerging economies, is inevitably impacted by such international financial events.
The objective of this study is to examine the spillover effects of the Federal Reserve's monetary policy, particularly the aggressive interest rate hikes implemented since March 2022, on the Chinese stock market. Daily, weekly, and monthly data from January 1, 2016, to March 15, 2022, were utilized in this article. The study focused on two representative indicators, the returns of Nasdaq and SSEC, and employed the ARIMA model to predict the trend of these indices without the influence of the interest rate policy. A comparison was made between the predicted values and the actual observations.
The research derived the following conclusions: Firstly, there exists a significant spillover effect of the Federal Reserve's interest rate hikes on the Chinese stock market, resulting in short-term market volatility. This effect is mainly transmitted through the impact on foreign capital inflows, exchange rate fluctuations, and investor confidence and sentiment channels. Secondly, such spillover effects are not long-lasting, given the different economic cycles, diverse valuation positions, and varying policy and economic centers between China and the United States. Chinese financial markets will gradually absorb the negative impact of US monetary policy in the medium to long term. Thirdly, as economic globalization continues to evolve, policymakers and financial regulators in China will face increasingly complex and volatile international scenarios and the influence of global capital flows. Therefore, it is imperative to develop more robust and logically sound financial regulatory policies, particularly by abandoning the previous "one-size-fits-all" approach to strict regulation.
The econometric analysis in this study only takes into account the variations in the Nasdaq and SSEC indices, without considering factors such as exchange rates, TED spreads, US-China bond yield differentials, investor sentiment, and other safe-haven commodities like gold and oil. Additionally, alongside the interest rate hiking cycle in the United States, there has been a substantial reduction in the size of the balance sheet, which also impacts international markets and the Chinese financial market. In future research, it is important to incorporate more factors into consideration using a VAR model to obtain more accurate conclusions and provide recommendations that align with real-world scenarios.
References
[1]. Forbes. (2023). What Happens When the Fed Raises Interest Rates? Retrieved July 31, 2023, from https://www.forbes.com/advisor/investing/fed-raises-interest-rates/
[2]. Kim, J. (2023). Stock market reaction to US interest rate hike: evidence from an emerging market. Heliyon, 9(5).
[3]. Hoek, J., Yoldas, E., & Kamin, S. (2021). Are Rising US Interest Rates Destabilizing for Emerging Market Economies?.
[4]. U.S. Department of the Treasury. (2022, October 18). Treasury Sanctions Key Actors in the Illicit Oil Trade with Iran. Retrieved from https://home.treasury.gov/news/press-releases/jy1032
[5]. Chen, Xiaotun., & Zheng, Zhiwen. (2020). The internationalization of China’s stock market from the perspective of global stock market turbulence caused by the US stock market crash. Economic Affairs, 40(4), 38-44.
[6]. Shu, Xing. (2022). The spillover effect of the Fed’s interest rate hike on China’s stock market volatility: Based on DAG-SVAR and spillover index verification. Xinjiang Finance and Economics, (03), 16-29. https://doi.org/10.16716/j.cnki.65-1030/f.2022.03.002
[7]. Investopedia. (2022). Key Indicators for Following the Stock Market and Economy. Retrieved August 1, 2023, from https://www.investopedia.com/ask/answers/032415/what-are-most-common-market-indicators-follow-us-stock-market-and-economy.asp
[8]. Shanghai Stock Exchange. (2023). Overview of SSE Indices. Retrieved August 1, 2023, from http://www.sse.com.cn/market/sseindex/overview/
[9]. Investopedia. (2022). Autoregressive Integrated Moving Average (ARIMA) Prediction Model. Retrieved August 1, 2023, from https://www.investopedia.com/terms/a/autoregressive-integrated-moving-average-arima.asp
[10]. Capital One. (n.d.). Understanding ARIMA Models for Machine Learning. Retrieved August 1, 2023, from https://www.capitalone.com/tech/machine-learning/understanding-arima-models/
[11]. Baeldung. (n.d.). Choosing the best q and p from ACF and PACF plots in ARMA-type modeling. Retrieved August 1, 2023, from https://www.baeldung.com/cs/acf-pacf-plots-arma-modeling
[12]. Havranek, T. , & Rusnak, M. . (2012). Transmission lags of monetary policy: a meta-analysis. Working Papers IES.
[13]. Altavilla, C., Gürkaynak, R. S., Motto, R., & Ragusa, G. (2020). How do financial markets react to monetary policy signals? ECB Research Bulletin, 73. https://www.ecb.europa.eu/pub/economic-research/resbull/2020/html/ecb.rb200722~528ea64f0d.en.html
Cite this article
Ni,W. (2023). The Spillover Effect of the Federal Reserve’s Aggressive Interest Rate Hike on China’s Stock Market in the Post-pandemic Era. Advances in Economics, Management and Political Sciences,51,71-84.
Data availability
The datasets used and/or analyzed during the current study will be available from the authors upon reasonable request.
Disclaimer/Publisher's Note
The statements, opinions and data contained in all publications are solely those of the individual author(s) and contributor(s) and not of EWA Publishing and/or the editor(s). EWA Publishing and/or the editor(s) disclaim responsibility for any injury to people or property resulting from any ideas, methods, instructions or products referred to in the content.
About volume
Volume title: Proceedings of the 2nd International Conference on Financial Technology and Business Analysis
© 2024 by the author(s). Licensee EWA Publishing, Oxford, UK. This article is an open access article distributed under the terms and
conditions of the Creative Commons Attribution (CC BY) license. Authors who
publish this series agree to the following terms:
1. Authors retain copyright and grant the series right of first publication with the work simultaneously licensed under a Creative Commons
Attribution License that allows others to share the work with an acknowledgment of the work's authorship and initial publication in this
series.
2. Authors are able to enter into separate, additional contractual arrangements for the non-exclusive distribution of the series's published
version of the work (e.g., post it to an institutional repository or publish it in a book), with an acknowledgment of its initial
publication in this series.
3. Authors are permitted and encouraged to post their work online (e.g., in institutional repositories or on their website) prior to and
during the submission process, as it can lead to productive exchanges, as well as earlier and greater citation of published work (See
Open access policy for details).
References
[1]. Forbes. (2023). What Happens When the Fed Raises Interest Rates? Retrieved July 31, 2023, from https://www.forbes.com/advisor/investing/fed-raises-interest-rates/
[2]. Kim, J. (2023). Stock market reaction to US interest rate hike: evidence from an emerging market. Heliyon, 9(5).
[3]. Hoek, J., Yoldas, E., & Kamin, S. (2021). Are Rising US Interest Rates Destabilizing for Emerging Market Economies?.
[4]. U.S. Department of the Treasury. (2022, October 18). Treasury Sanctions Key Actors in the Illicit Oil Trade with Iran. Retrieved from https://home.treasury.gov/news/press-releases/jy1032
[5]. Chen, Xiaotun., & Zheng, Zhiwen. (2020). The internationalization of China’s stock market from the perspective of global stock market turbulence caused by the US stock market crash. Economic Affairs, 40(4), 38-44.
[6]. Shu, Xing. (2022). The spillover effect of the Fed’s interest rate hike on China’s stock market volatility: Based on DAG-SVAR and spillover index verification. Xinjiang Finance and Economics, (03), 16-29. https://doi.org/10.16716/j.cnki.65-1030/f.2022.03.002
[7]. Investopedia. (2022). Key Indicators for Following the Stock Market and Economy. Retrieved August 1, 2023, from https://www.investopedia.com/ask/answers/032415/what-are-most-common-market-indicators-follow-us-stock-market-and-economy.asp
[8]. Shanghai Stock Exchange. (2023). Overview of SSE Indices. Retrieved August 1, 2023, from http://www.sse.com.cn/market/sseindex/overview/
[9]. Investopedia. (2022). Autoregressive Integrated Moving Average (ARIMA) Prediction Model. Retrieved August 1, 2023, from https://www.investopedia.com/terms/a/autoregressive-integrated-moving-average-arima.asp
[10]. Capital One. (n.d.). Understanding ARIMA Models for Machine Learning. Retrieved August 1, 2023, from https://www.capitalone.com/tech/machine-learning/understanding-arima-models/
[11]. Baeldung. (n.d.). Choosing the best q and p from ACF and PACF plots in ARMA-type modeling. Retrieved August 1, 2023, from https://www.baeldung.com/cs/acf-pacf-plots-arma-modeling
[12]. Havranek, T. , & Rusnak, M. . (2012). Transmission lags of monetary policy: a meta-analysis. Working Papers IES.
[13]. Altavilla, C., Gürkaynak, R. S., Motto, R., & Ragusa, G. (2020). How do financial markets react to monetary policy signals? ECB Research Bulletin, 73. https://www.ecb.europa.eu/pub/economic-research/resbull/2020/html/ecb.rb200722~528ea64f0d.en.html