


1.Introduction
With the development of modern economy and finance, there are more and more investors willing to take part in investments of alternatives. Alternatives instruments also acquire massive growth at different levels. In recent years, currency as a special kind of alternative instrument has acquired increasing attention from investors. From Gold to Bitcoin, there are marvelous kinds of currency in the financial market. Each of them represents one type of unique alternative, which will help portfolios perform better in a nowadays turbulent market.
There is growing research subjected to cryptocurrency, which mainly focuses on market efficiency, price linkage effects, volatility spillover effects, and correlations between cryptocurrencies and other financial assets. For example, Cao and Xie utilize the MFDCCA method to study the multifractal characteristics between two cryptocurrencies during a full sample in different markets, providing effective frontiers for investment portfolios and comparing them with traditional investment portfolio models and offering an optimal investment performance [1]. Jin carry out his research on the portfolio investment strategy of cryptocurrency by Python, holding the view that including cryptocurrency in a portfolio can increase the expected return of investors [2]. The research carried out by Platanakis and Urquhart presents that adding Bitcoin to traditional stock and fund portfolios can continuously improve risk-adjusted returns [3]. Liu studied investment portfolios between 10 cryptocurrencies, and the results show that diversified investment portfolios between different cryptocurrencies can obviously improve the effectiveness of investment portfolios [4]. Scholars such as Guesmi have done research on investment portfolios between Bitcoin and gold, stocks, and crude oil, indicating that Bitcoin can effectively hedge the risks of investment portfolios and significantly improve the effectiveness of investment portfolios [5]. Tang and Zhu used DCCA and MFDCCA methods to construct single fractal and multifractal investment portfolio strategies and achieved good results in studying cross-market investment portfolios in the Shanghai and Hong Kong stock markets [6]. There are also some scholars who hold the view that adding currency, especially cryptocurrency to an investment portfolio may have no effect in diversifying risk. For example, scholars such as Klein showed that Bitcoin and gold have fundamentally different attributes, but did not find their stable hedging ability [7].
Many types of research have been promoted to discover a useful method to explore the underlying relationship between different types of assets in one portfolio. For example, Li, Gao, and Ming studied minimum variance investment portfolios based on high-frequency high-dimensional covariance matrix contraction estimation [8]. Jagannathan and Ma carried out their research on mean-variance efficient portfolios with nonnegative weights of assets, explaining why restricting portfolio weights to be positive can effectively reduce the risk of the portfolio [9]. Ledoit and Wolf create a unique shrinkage method to calculate and discover the underlying relationship behind assets [10]. They then did further research and optimized their method in 2004 [11].
This paper mainly analyses three types of currency: Gold, Bitcoin, and CHF, and investigate the portfolio establishment of currency and equity which uses Monte Carlo simulation to construct one million portfolios with different asset allocation. In our initial simulation, there are over 26.26% portfolios with a sharp ratio of over 29.44%, which is the sharp ratio of the S&P 500. And to increase the sharp ratio, investors can reduce the portion of S&P 500 and Gold futures in their portfolio, while increasing the weights of Bitcoin and CHF. In our additional analysis, we define two extra yields in a currency's expected return, which will provide investors with a guarantee of their return, significantly increasing the market share of currency as a useful alternative tool. The analysis of the two simulations shows that with extra yield, portfolios will have an average higher sharp ratio than the initial simulation which even exceeds the sharp ratio of the S&P 500, performing much better than a single equity.
The structure of this paper is organized as follows. Section 2 describes the data we used in our analysis. Section 3 presents the main variables we used and the process of our portfolio establishment. Section 4 presents our additional analysis with extra yield. The conclusion follows in Section 5.
2.Data
The data used in the analysis are monthly prices and returns of four assets: S&P 500, Gold Futures, CHF, and Bitcoin. The dataset covers the period from January 2016 to December 2022, having 84 trading prices and 61 trading returns in total. The data are available on yahoo finance.com.
We choose these assets in our portfolio to analyze how to construct a portfolio with currency and equity to help investors diversify risks and increase their return. Our unique portfolio structure is attributed to the different characteristics of the four assets. Firstly, we choose S&P 500 as the representative of equity. It can perfectly represent the basic standard of our portfolio because S&P 500 recorded a stock index of 500 listed companies in the United States. Then we choose CHF, Gold Futures, and Bitcoin to construct our portfolio's currency structure. These currencies separately represent world credit currency, gold, and cryptocurrency, showing the diversity of our portfolio’s currency structure.
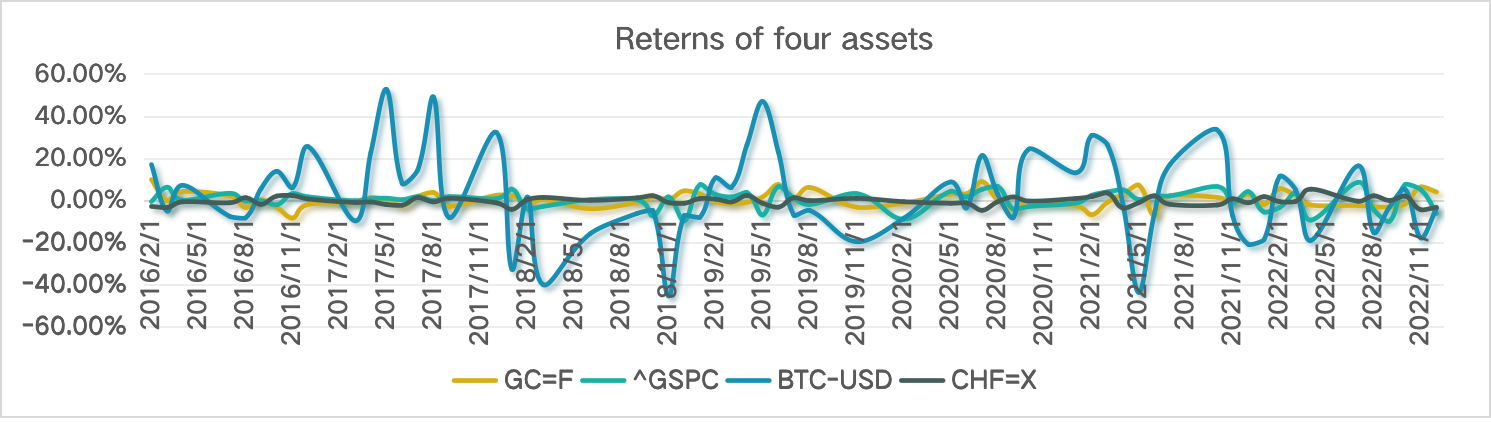
Figure 1: Returns of four assets.
3.Basic Portfolio Establishment
In this section, we use the data mentioned in section 2 to do Monte Carlo Simulation with Python. We then save the simulation’s results and continue our analysis with the use of Excel, drawing our preliminary conclusion.
3.1.Annualized Data Calculation
Before we construct our basic portfolio, we calculate the annualized return, annualized volatility, and the annualized sharp ratio of the four assets. The results are presented in Table 1.
Table 1: Annualized performance of four assets.
|
Statistics |
BTC-USD |
CHF=X |
GC=F |
^GSPC |
|
annualized return |
0.107856 |
-0.018959 |
0.068737 |
0.067059 |
|
annualized variance |
0.721476 |
0.070064 |
0.129989 |
0.156439 |
|
annualized sharp ratio |
0.092665 |
-0.866774 |
0.213383 |
0.166575 |
Firstly we use monthly returns of four assets to calculate annualized return and annualized volatility. We calculate the geometric mean of all returns and use them as the annualized return of four assets. Then we calculate the standard variance of four assets and use them as annualized volatility. Secondly, we use annualized variance and annualized volatility to calculate assets' annualized sharp ratio.
Among all of the sharp ratios of the four assets, we use the sharp ratio of the S&P 500 as the comparison criteria, which will help us evaluate the our portfolio’s performance and draw our final conclusion.
3.2.Covariance Matrix Between Assets
In this section, we use the Ledoit-Wolf shrinkage method to calculate the covariance matrix between the four assets. Compared with the sample covariance method, the Ledoit-Wolf shrinkage method can help us capture underlying intuition between all assets with fewer estimate errors. The ledoit-Wolf shrinkage method combines the sample covariance method with shrinkage target “ F ”, which is calculated in the below formula.
\( δF+(1-δ)S,0≤δ≤1 \)(1)
Then we use Python to help us calculate the covariance matrix between the four assets and draw the heat map. The result is presented in Table 2.
Table 2: Covariance matrix between assets.
|
Covariance |
BTC-USD |
CHF=X |
GC=F |
^GSPC |
|
BTC-USD |
0.670507 |
-0.001141 |
0.017639 |
0.037878 |
|
CHF=X |
-0.001141 |
0.004631 |
-0.003899 |
-0.002293 |
|
GC=F |
0.017639 |
-0.003899 |
0.01649 |
0.003891 |
|
^GSPC |
0.037878 |
-0.002293 |
0.003891 |
0.026269 |
As recorded in Table 2, the covariance between all assets is relatively small, around zero. This means that our portfolio's currency structure does well in diversifying risks and reducing the volatility of our portfolio.
3.3.Monte Carlo Simulation
In this section, we use Monte Carlo Simulation to undergo almost 1 million establishments of the portfolio including the four assets. The simulation's result is presented in Figure.2.
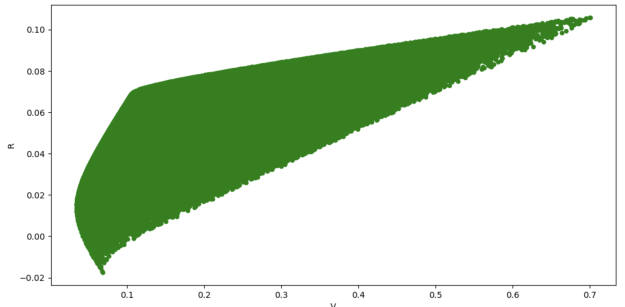
Figure 2: Basic monte Carlo simulation.
Compared with the normal simulation's result, our simulation's result has a strangle angle when the return increases from 6% to 8%. It shows that as the volatility and return increase, the sharp ratio is large initially, but decreased abruptly. We then analyze the asset allocation of these portfolios to figure out the appearance of the strange angle.
3.4.Basic Portfolio Analysis
We then continue analysis based on the sharp ratio. Among portfolios in our simulation, there are over 26.26% of portfolios in this simulation that have a sharp ratio higher than 29.44%, which is the sharp ratio of the S&P 500 (Figure 3).
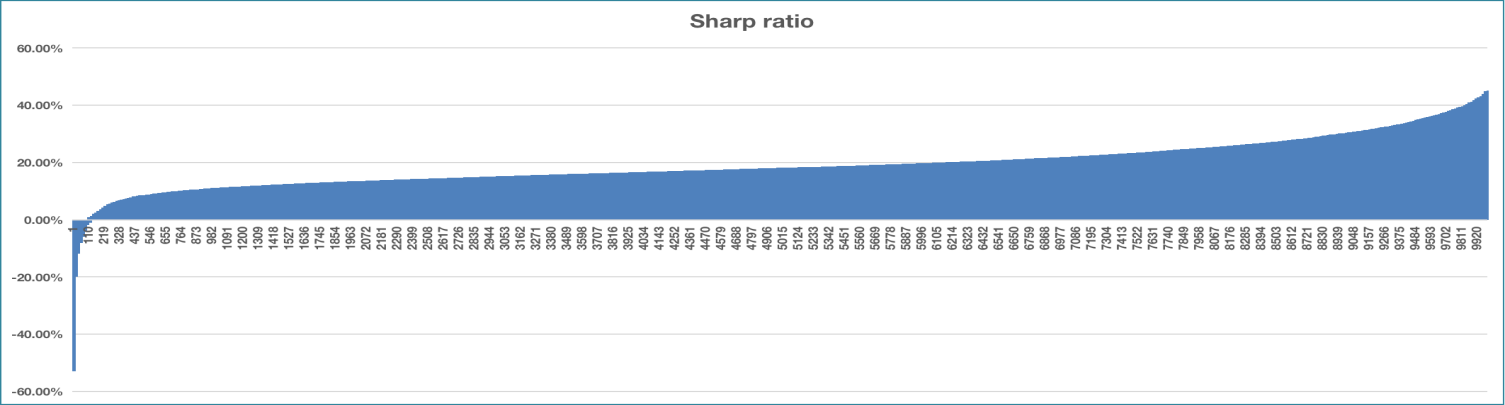
Figure 3: Sharp ratio of portfolios.
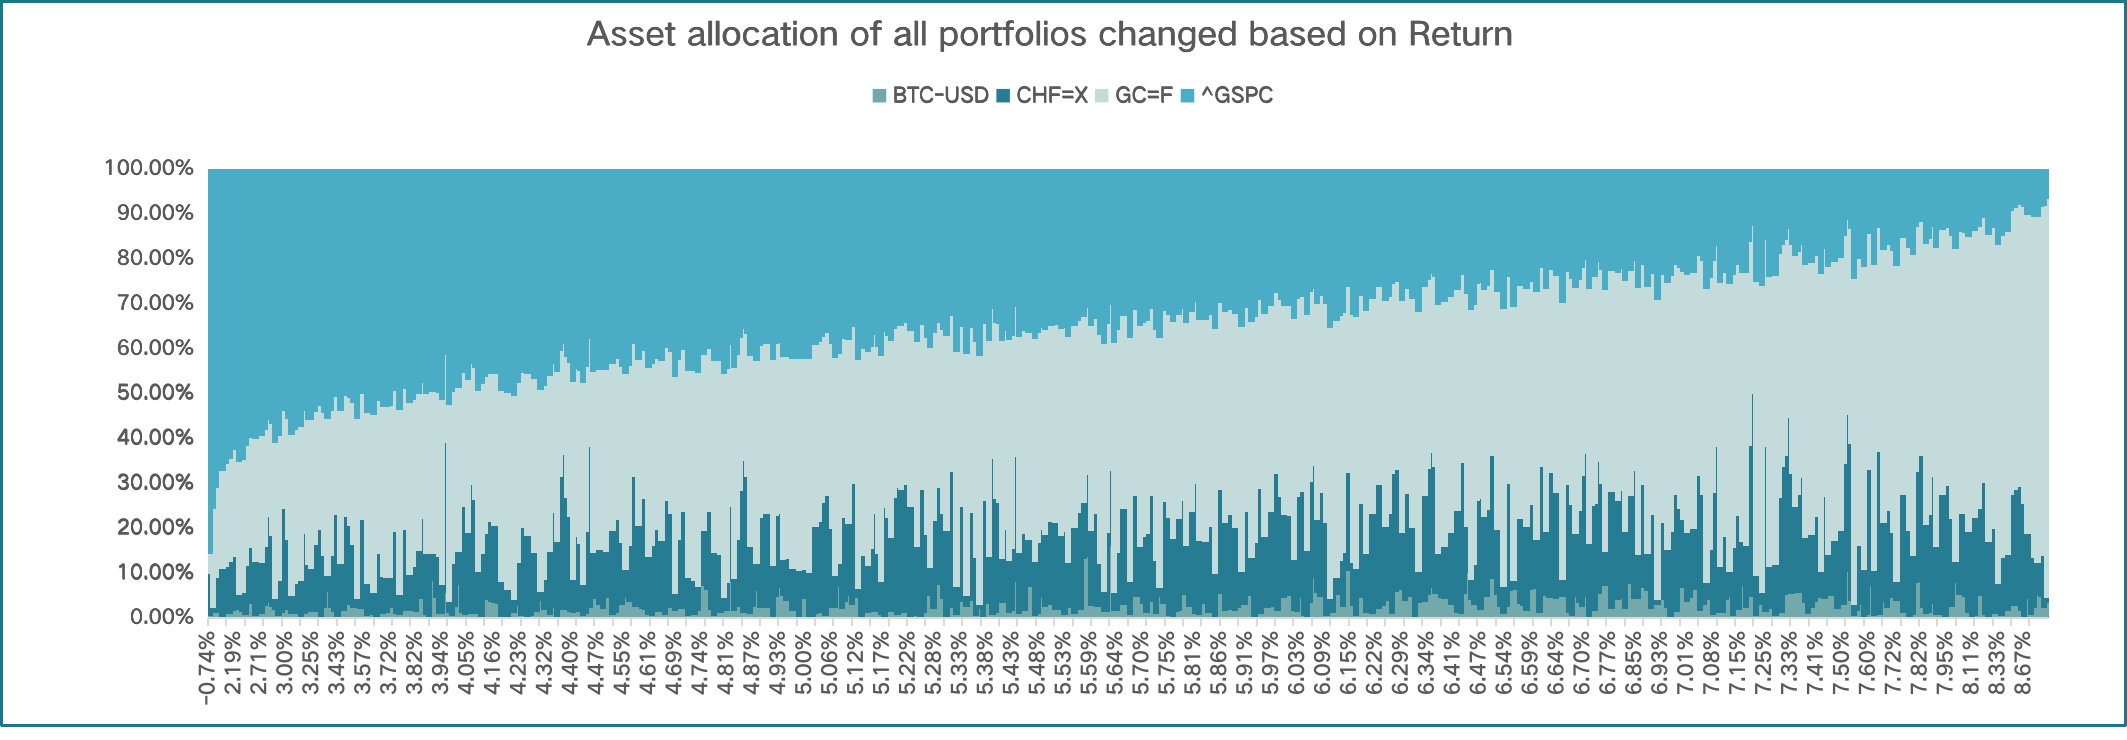
Figure 4: Asset allocation based on return.
We calculate the sharp ratio of all the portfolios in the simulation. As recorded in Figure.3, there are some portfolios with a negative sharp ratio. We then analyze the asset allocation of these portfolios and find that each of these portfolios has a large portion of the S&P 500 in its structure. Once we obtain this regulation, we further investigate the asset allocation of all the portfolios in the simulation and analyze it based on a sharp ratio. The allocation is presented in Figure.4 to Figure 6.
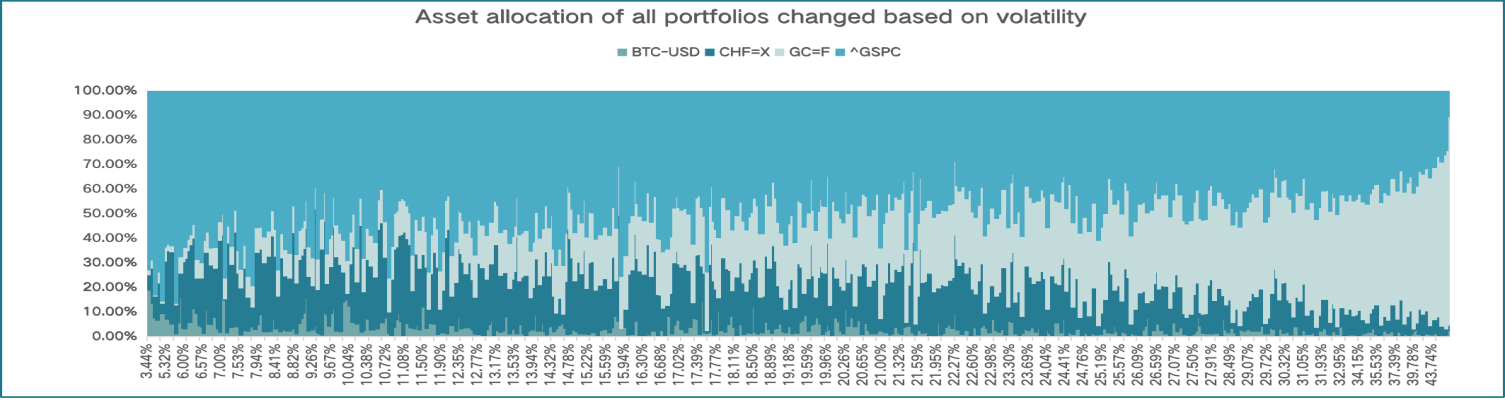
Figure 5: Asset allocation based on volatility.
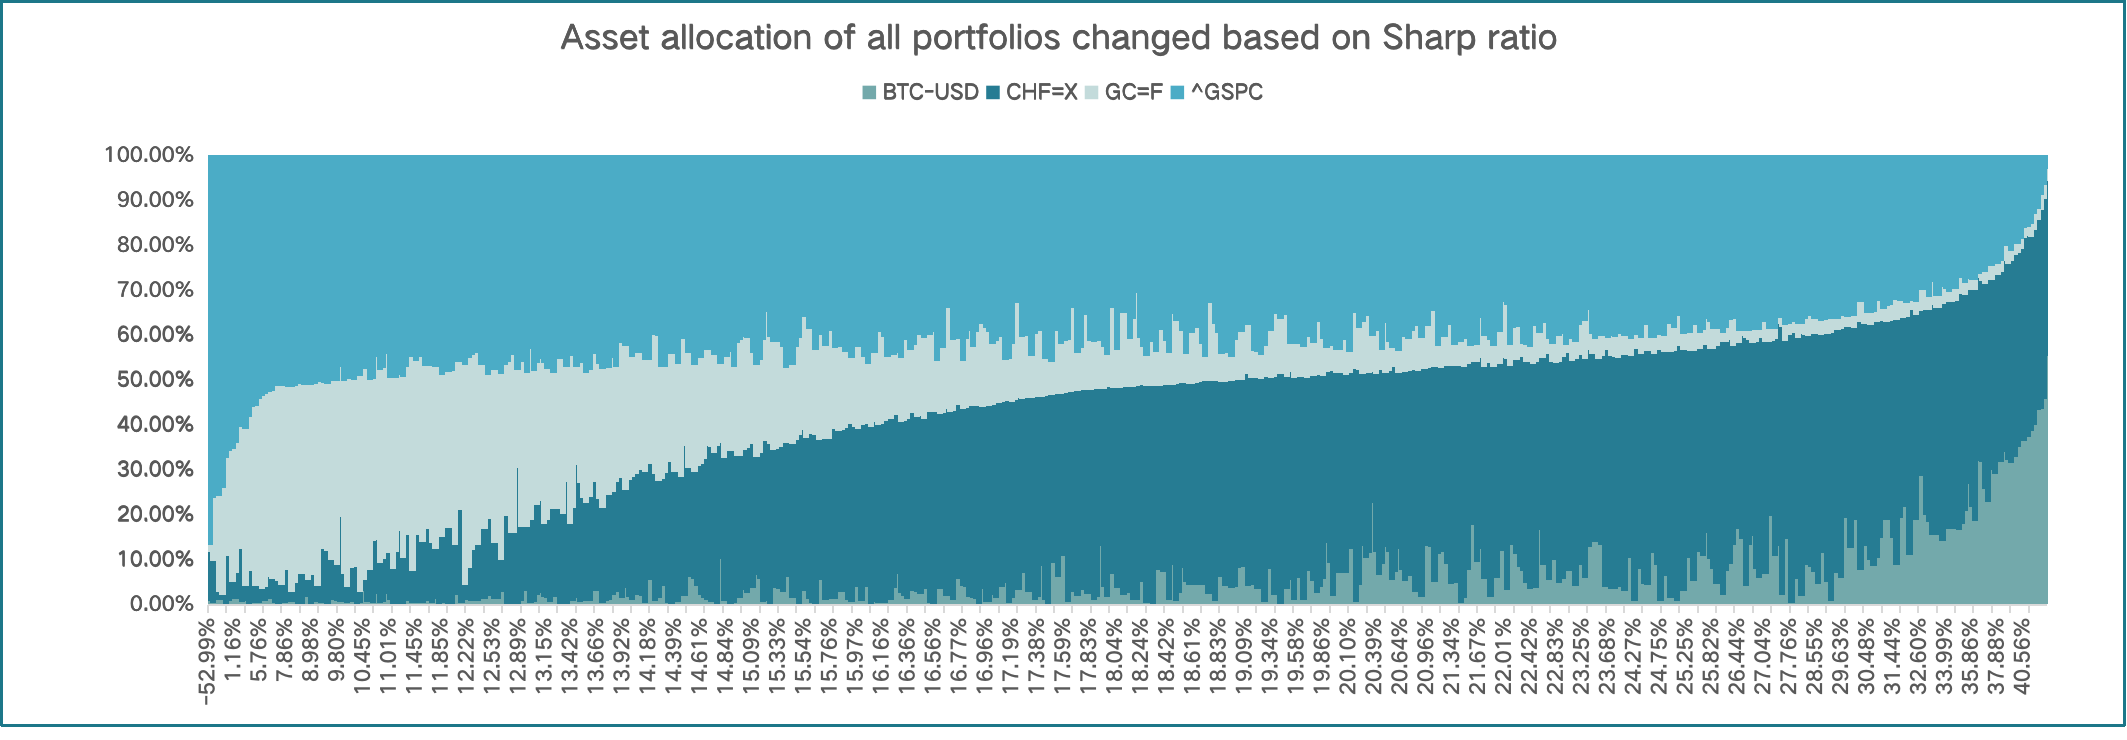
Figure 6: Asset allocation based on sharp ratio.
From the bar chart of the asset allocation, we figure out the regular pattern of the portfolio: as the sharp ratio increases, the weights of S&P 500 and Gold futures decrease, with the portion of CHF and Bitcoin increasing. We then analyze the asset allocation of all the portfolios separately based on returns and volatility. From the analysis of these two asset allocations, we find the reason for the regular pattern. As the return increases, the weight of the S&P 500 decreases and the weight of Gold futures obviously increases. However, as the volatility increases, the weight of Gold futures obviously increases, and the weights of CHF and Bitcoin decrease. The reason for the regular pattern is attributed to the smaller portion of S&P 500 and Gold futures accompanied by lower volatility of the portfolio, which clearly increases the sharp ratio of the portfolio.
3.5.The Appearance of the Strange Angle
Based on the analysis above, we attributed the appearance of the strange angle to the asset allocation of different portfolios. We analyze the asset allocation and sharp ratio of portfolios with returns ranging from 6% to 8%. From the asset allocation of all portfolios, we find that as the return of the portfolio increases, the portion of the S&P 500 decreases, which reduces the sharp ratio of the overall portfolio, resulting in the appearance of the strange angle (Figure 7).
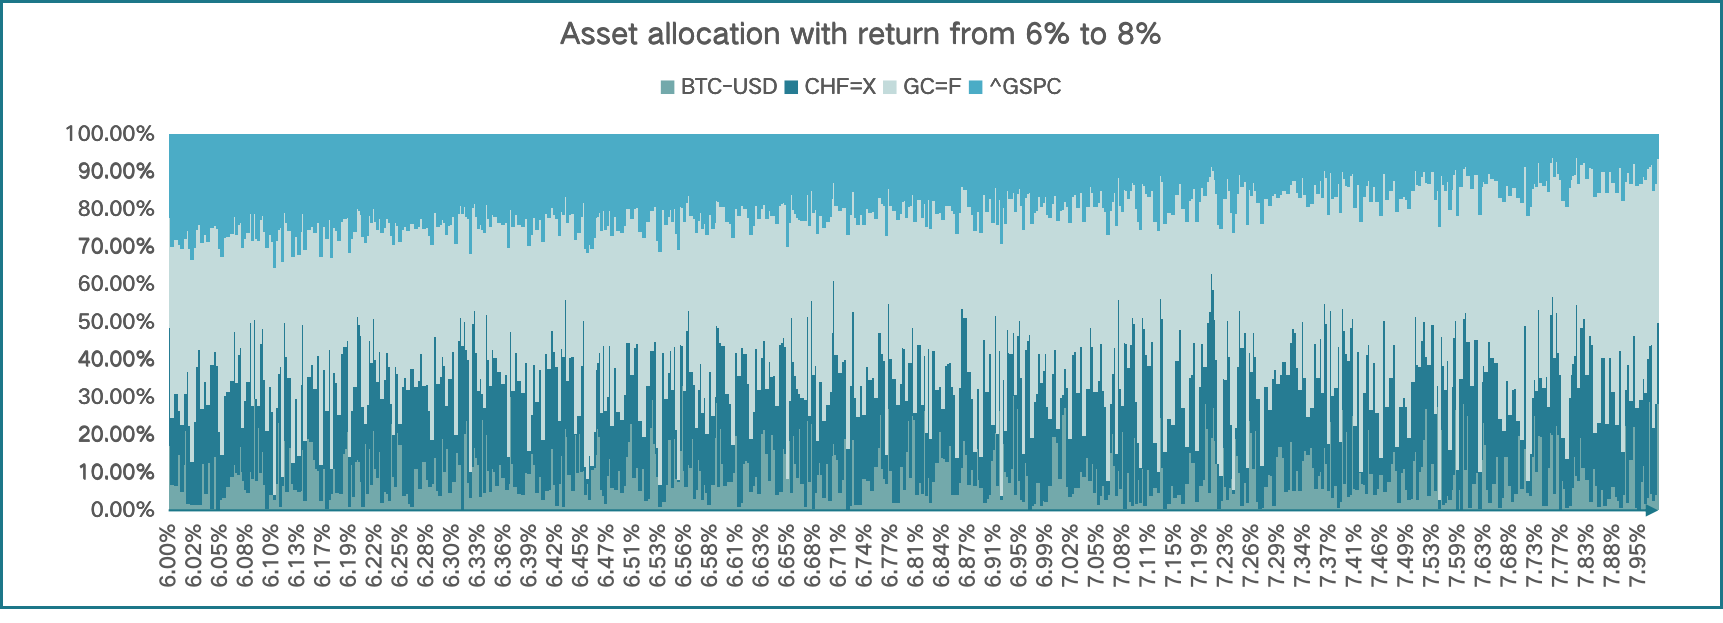
Figure 7: Analysis of strange angle.
4.Additional Analysis
In section 4, we further our investigation with the definition of extra yield. With the understanding of the importance of extra yield, we use two fixed extra yields to do our additional analysis. We use the same data used in the initial analysis, adding extra yield to annualized return, and do the Monte Carlo Simulation again. By doing the comparison of two new simulations and the initial one, we arrive at our final conclusion.
4.1.The Importance of Extra Yield
As is known to all, equity is a normal asset that investors frequently choose and include in their portfolio structure. However, compared with equity, currency often has a smaller market share because of its high volatility. As the price of equity changes based on the development of the corporation, which seems to be a guarantee of investors’ profit, helping investors estimate prices of equity. But the price of currency shifts without any accordance. Take Bitcoin as an example, Bitcoin is one kind of cryptocurrency, which is generated from network nodes' calculation. Compared with normal currency, Bitcoin doesn't have a clear issuer and the volatility of its price is so large that only a few investors are willing to invest it for speculation.
The reason why investors don’t treat currency like equity is the high risk behind the currency. To increase the market share of currency, one solution is to give a guarantee of return to investors. As a result, we advocate adding an extra yield to the expected return of currency, which means that the return of the currency increases without an increase in risk of the currency. With the extra yield, investors will trust currency more.
4.2.Additional Portfolio Analysis with Extra Yield
We define two kinds of extra yield, adding them to the currency's annualized return, and then do Monte Carlo Simulation.
The first extra yield we defined equals risk-free rate. As we calculate the sharp ratio before, we fixed our risk-free rate, making it equal to 2.1%. We then add it to the initial annualized return, the modified annual rate of return is presented in Table 3.
The second extra yield we defined equals to an annual rate of return of currency. We add it to the initial annualized return, the modified annual rate of return is also presented in Table 3.
Table 3: Performances of two simulations.
|
Extra Yield |
BTC-USD |
CHF=X |
GC=F |
^GSPC |
Average Sharp Ratio |
Average Return |
|
Risk-free rate |
0.128856 |
0.002041 |
0.089737 |
0.067059 |
29.1% |
7.17% |
|
Annual rate of return |
0.515423 |
0 |
0.179475 |
0.067059 |
47.3% |
10.46% |
We then do the two simulations and continue our analysis on their sharp ratio and asset allocation. Both of the two simulations have a higher portion of portfolios with a sharp ratio higher than 29.44%.
After adding extra yield, both of the new simulations have fewer portfolios with negative sharp ratios than the initial simulation. And the average sharp ratios of the two simulations are larger than the sharp ratio of the initial simulation.
From the bar chart of the two simulations, we find that as the sharp ratio increases, the weight of the S&P 500 doesn't change following the same regular pattern found in the initial simulation. The weight of the S&P 500 in both two simulations is large, almost half of the portion of portfolios, which have fewer changes as sharp ratio shifts. And as the risk of the portfolio increases, the portion of Gold futures increases (Figure 8-9).
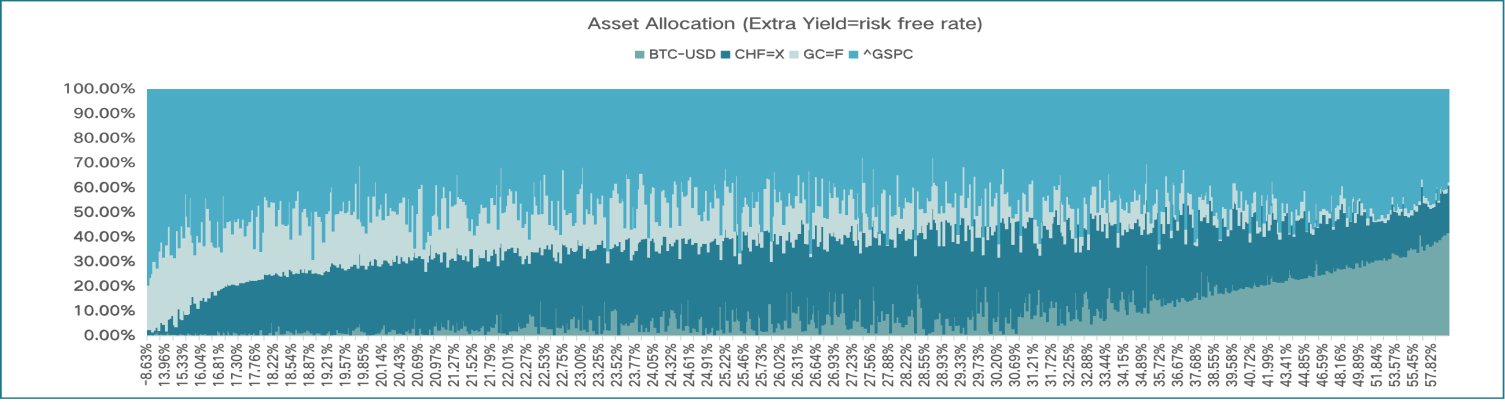
Figure 8: Asset allocation with risk-free rate.
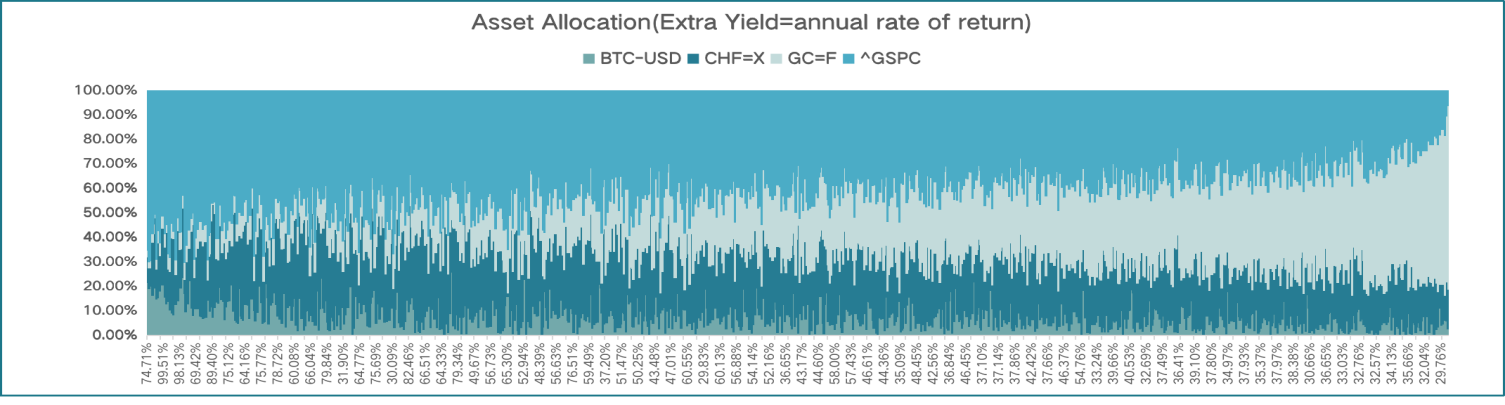
Figur.9: Asset allocation with an annualized return.
Based on two extra yields, we find two portfolios with the same return to S&P 500, their asset allocations and performances are presented in Table 6. Compared with the performance of the S&P 500, these two portfolios have lower risk and higher sharp ratios.
5.Conclusion
Nowadays, alternative investment instruments have obtained marvelous developments. With higher average returns and lower correlations with financial assets and themselves, currency represents one splendid type of alternative, which can help investors reduce volatility and increase the average return in their portfolios.
This paper investigates the possibility of investors diversifying investment risk and increasing investment return by including different types of currency in their portfolios. During our investigation, we make advantage of Python and Excel to help us do Monte Carlo Simulation and some calculations.
Our empirical results suggest Ledoit-Wolf shrinkage method is a better approach to exploring underlying relationships between currencies. We also show that there are some regular patterns in basic portfolio construction, such as reducing the portion of the equity in a portfolio to increase the portfolio's sharp ratio and decreasing the portion of Gold futures to reduce the portfolio's risk. Moreover, we find that there are actually some advantages when we add extra yield to the currency's average return. Taken together, our results show that adding extra yield to the currency's average return is a good method to increase the currency's market shares, as it can increase the portfolio's average sharp ratio and return, without increasing its risk. And including currency in portfolios with a rational asset allocation can make portfolios perform better.
A significant shortage remains: there are lots of assumptions in our analysis, which are quite different from reality. We set the extra yield by ourselves, wholly investigating currency from the perspective of investors, regardless of issuers. There is still lot of research that we need to continue to define a more reasonable extra yield of currency, to increase its attractiveness both to investors and issuers.
References
[1]. Guangxi C, Wenhao X. Cryptocurrency Investment Portfolio from a Fractal Perspective: Comparison of Bull and Bear Market Effects[J].Management Review,2023,35(03):39-48.DOI:10.14120/j.cnki.cn11-5057/f.2023.03.007.
[2]. Jiaming J. Research on Digital Currency Investment Portfolio Strategy Based on Machine Learning [D]. Dongbei University of Finance and Economics,2021.DOI:10.27006/d.cnki.gdbcu.2021.000697.
[3]. Platanakis E,Urquhart A. Should investors include Bitcoin in their portfolios? A portfolio theory approach[J]. The British Accounting Review,2020,52(4).
[4]. Liu W. Portfolio diversification across cryptocurrencies[J]. Finance Research Letters,2019,29(C).
[5]. Guesmi K,Saadi S,Abid I, et al. Portfolio diversification with virtual currency: Evidence from bitcoin[J]. International Review of Financial Analysis,2019,63(C).
[6]. Yong T, Pengfei Z. Investment Portfolio Strategy for Shanghai and Hong Kong Stock Markets from a Fractal Perspective [J]. System Engineering Theory and Practice,2018,38(09):2188-2201.
[7]. Klein T,Thu P H,Walther T. Bitcoin is not the New Gold – A comparison of volatility, correlation, and portfolio performance[J]. International Review of Financial Analysis,2018,59.
[8]. Yu L, Min X, Ruixing M. Minimum variance investment portfolio based on high-frequency high-dimensional covariance matrix contraction estimation [J]. Business Economics and Management,2023(03):94-108.DOI:10.14134/j.cnki.cn33-1336/f.2023.03.007.
[9]. Ledoit O,Wolf M. Honey, I Shrunk the Sample Covariance Matrix[J]. Journal of portfolio management,2004,30(4).
[10]. Jagannathan R,Ma T. Risk Reduction in Large Portfolios: Why Imposing the Wrong Constraints Helps[J]. The Journal of Finance,2003,58(4).
[11]. Ledoit O,Wolf M. Improved estimation of the covariance matrix of stock returns with an application to portfolio selection[J]. Journal of Empirical Finance,2003,10(5).
Cite this article
Shi,H. (2023). Portfolio Analysis of Various Financial Assets. Advances in Economics, Management and Political Sciences,53,1-8.
Data availability
The datasets used and/or analyzed during the current study will be available from the authors upon reasonable request.
Disclaimer/Publisher's Note
The statements, opinions and data contained in all publications are solely those of the individual author(s) and contributor(s) and not of EWA Publishing and/or the editor(s). EWA Publishing and/or the editor(s) disclaim responsibility for any injury to people or property resulting from any ideas, methods, instructions or products referred to in the content.
About volume
Volume title: Proceedings of the 2nd International Conference on Financial Technology and Business Analysis
© 2024 by the author(s). Licensee EWA Publishing, Oxford, UK. This article is an open access article distributed under the terms and
conditions of the Creative Commons Attribution (CC BY) license. Authors who
publish this series agree to the following terms:
1. Authors retain copyright and grant the series right of first publication with the work simultaneously licensed under a Creative Commons
Attribution License that allows others to share the work with an acknowledgment of the work's authorship and initial publication in this
series.
2. Authors are able to enter into separate, additional contractual arrangements for the non-exclusive distribution of the series's published
version of the work (e.g., post it to an institutional repository or publish it in a book), with an acknowledgment of its initial
publication in this series.
3. Authors are permitted and encouraged to post their work online (e.g., in institutional repositories or on their website) prior to and
during the submission process, as it can lead to productive exchanges, as well as earlier and greater citation of published work (See
Open access policy for details).
References
[1]. Guangxi C, Wenhao X. Cryptocurrency Investment Portfolio from a Fractal Perspective: Comparison of Bull and Bear Market Effects[J].Management Review,2023,35(03):39-48.DOI:10.14120/j.cnki.cn11-5057/f.2023.03.007.
[2]. Jiaming J. Research on Digital Currency Investment Portfolio Strategy Based on Machine Learning [D]. Dongbei University of Finance and Economics,2021.DOI:10.27006/d.cnki.gdbcu.2021.000697.
[3]. Platanakis E,Urquhart A. Should investors include Bitcoin in their portfolios? A portfolio theory approach[J]. The British Accounting Review,2020,52(4).
[4]. Liu W. Portfolio diversification across cryptocurrencies[J]. Finance Research Letters,2019,29(C).
[5]. Guesmi K,Saadi S,Abid I, et al. Portfolio diversification with virtual currency: Evidence from bitcoin[J]. International Review of Financial Analysis,2019,63(C).
[6]. Yong T, Pengfei Z. Investment Portfolio Strategy for Shanghai and Hong Kong Stock Markets from a Fractal Perspective [J]. System Engineering Theory and Practice,2018,38(09):2188-2201.
[7]. Klein T,Thu P H,Walther T. Bitcoin is not the New Gold – A comparison of volatility, correlation, and portfolio performance[J]. International Review of Financial Analysis,2018,59.
[8]. Yu L, Min X, Ruixing M. Minimum variance investment portfolio based on high-frequency high-dimensional covariance matrix contraction estimation [J]. Business Economics and Management,2023(03):94-108.DOI:10.14134/j.cnki.cn33-1336/f.2023.03.007.
[9]. Ledoit O,Wolf M. Honey, I Shrunk the Sample Covariance Matrix[J]. Journal of portfolio management,2004,30(4).
[10]. Jagannathan R,Ma T. Risk Reduction in Large Portfolios: Why Imposing the Wrong Constraints Helps[J]. The Journal of Finance,2003,58(4).
[11]. Ledoit O,Wolf M. Improved estimation of the covariance matrix of stock returns with an application to portfolio selection[J]. Journal of Empirical Finance,2003,10(5).