


1.Introduction
Unemployment is an index that reflects the supply and demand of labor market. It is an important problem that affects the operation of market economy and the development of social economy. The information contained in this index is having a profound impact on the operation of market economy and the economic development of society. For a long time, governments of all countries have regarded the unemployment rate as an indicator to evaluate the macroeconomic operation and the prosperity of the labor market, which is why promoting employment and controlling the unemployment rate is one of the macroeconomic control goals and unavoidable responsibilities of governments of all countries [1].
Unemployment also has a variety of personal, social and economic consequences. According to existing studies, in addition to short-term macro impact, unemployment will also have long-term impact on micro subjects. The longer a person is unemployed, the greater the social exclusion, and the negative effects of early unemployment persist even after he or she finds a new job. There is no substantial difference between voluntary and involuntary unemployment, which means that the costs of unemployment clearly outweigh the benefits [2]. From a social perspective, unemployment increases the risk of poverty, exacerbates inequality, and has a series of devastating social effects on the unemployed themselves, their families, and the communities in which they live [3]. From an economic perspective, high unemployment leads to less consumer spending, less government tax revenue, and slower overall economic growth.
According to World Bank estimates, one billion young people will try to enter the job market in the next decade [4]. Worryingly, however, less than half of them are able to find formal employment. This trend is likely to push the majority of people in the labor market into unemployment or working poverty. As a college student, the writer is at a critical time in his life like most of his peers. One of the most pressing global problems is high unemployment, especially among youth. Therefore, "they may face unemployment after graduation" has become a frequent warning to them, which continues to deepen their anxiety and worry.
This research project has great implications for the labor market as a whole. This paper hopes to avoid being marginalized by the society by choosing unemployment rate as the research topic. That is why this article has decided to delve deeper into this issue to provide more understanding and inspiration for people who are being affected by today's social environment. Through this research, this paper also hopes to help people find a sense of status and belonging, and better understand the possible future employment situation. This research project is not only to obtain academic conclusions, but also to better cope with future challenges. This article hopes to provide insight into the Canadian job market through an in-depth study of the unemployment rate. In this way, people can be more prepared for the upcoming life stage and make informed decisions about their future.
In recent years, due to the instability of the global economy and many black swan events (such as the subprime mortgage crisis, the COVID-19 pandemic), the problem of crisis-induced unemployment has attracted attention. These factors have contributed to stunting the global economy and disrupting Labour markets. Especially since the end of 2019, when the COVID-19 pandemic began, Canada's economic development has been hindered. Employment fell by nearly 20 per cent, taking a huge toll on Canada's Labour market, leading to the trough in employment. Job losses and layoffs due to the crisis are on the rise, despite some companies offering work-from-home options to comply with strict public health measures. Due to the lockdown measures caused by the epidemic, some enterprises have stopped operations or even been permanently eliminated, resulting in a shortage of jobs, and the number of unemployed people caused by the crisis has reached a record high.
In this environment, which groups of people will lose employment as a result of COVID-19? The rise of some service industries after the epidemic, such as the food delivery industry, has shown a strong recovery momentum and sufficient resilience. In this case, are different occupations affected differently, and do different levels of educational background have different consequences than the stereotype?
This paper delved into multiple topics related to the unemployment rate and made a time series forecast of the future unemployment rate in Canada using the ARIMA model. Through a deeper understanding of the unemployment rate as an economic indicator, society can create a more inclusive and resilient labor market amid the complexity and uncertainty of the economic environment, helping governments make economic policies and companies make business decisions, while promoting economic stability, social well-being optimization, and opportunity for all. At the same time, educational attainment plays an important role in boosting the employment prospects of the workforce. In order to have a deeper understanding of the factors that may affect unemployment, this paper selects the factors that affect the unemployment rate based on education level, aiming to reveal the potential change of education level on the unemployment rate. At the same time, analyze and compare the unemployment rate of the labor force under different education levels to explore, and then provide guidance for the future development direction of individuals in the labor market. Accordingly, as a part of the world, each individual is inevitably affected. The purpose of this analysis and discussion is also to help provide each individual in society with a sense of status and belonging.
The rest of the paper is made up of the following. First, the literature review provides the progress of scholars' exploration of relevant topics today, and then the body part of the topic of this discussion. It mainly includes analysis of unemployment rates in Canada before, during and after the pandemic and projections based on the ARIMA model. Second, there is the analysis of the Canadian unemployment rate based on education level and the ARIMA model projections.
2.Literature Review
Shrestha et al (2020) analyzed the impact of COVID-19 on mobility, trade, and travel in many countries in the context of the potential impact of COVID-19 on globalization and global health. And the long-term consequences for mobility, the economy, and the health system are only just beginning to be felt. They conclude that even developed countries with good infrastructure face difficulties in controlling the outbreak [5]. Due to the implementation of public health restrictions, the 2020 Statistics Canada report showed two months of historic job losses, with the unemployment rate hitting a 40-year high of 13.7% [6]. The book "Unemployment: Macroeconomic Performance and the Labor Market"(2005) combines macroeconomics with detailed microanalysis of the labor market to draw causal relationships between unemployment and inflation, wage bargaining, and unemployment insurance systems through the author's model analysis [7]. The problem with recessions, even short ones, is that it takes time to make up for lost output. It will take years to catch up with the pre-pandemic growth path. Fortunately, recovery is expected to be rapid. The COVID-19 outbreak in December has shown that accurately depicting the labor market requires not only traditional indicators such as employment and unemployment, but also measures of employment quality [8]. The results of the co-integration analysis of data from January 1975 to December 2019 showed that the worker effect increased for men and decreased for women [9]. In 2020, David L. et al.(2020) analyzed from the perspective of psychologists that individuals with unstable employment may experience long-term stress and unpredictability, and these negative factors will exacerbate and expose the impact of COVID-19 crisis [10]. Janko Z. and Gurleen P.(2015) uses Canadian national and regional data to analyze the relationship between economic activity and crime as reflected by the unemployment rate. The results showed no long-term relationship between crime and unemployment. But under a specific crime type, property crime, there is evidence of a significant short-term negative relationship between crime and unemployment [11]. Claudiu Ionut Popirlan et al.(2023) analyzed the unemployment rate and energy poverty level in selected EU countries through the mixed model ARIMA-ARNN, and the results showed that the two elements had comparable trends and they were closely related. Secondly, the prediction results of the forecasting model show that government policies will also have an impact on the correlation between the two relationships [12].
3.Canada Unemployment Rate Before, During and after Pandemic
The plot of Canada's unemployment rate from 1990 to 2022 shows that every time there is a crisis, unemployment tends to rise. For example, in the 1990s, economic challenges caused by factors such as high interest rates and the recession caused Canada's unemployment rate to rise to 11.3%, and the North American Free Trade Agreement (NAFTA), signed in 1994, boosted economic growth and caused unemployment to fall. During the global financial crisis caused by the subprime mortgage crisis in 2008, Canada's unemployment rate reached about 8.3%. The government took stimulus measures to counter the effects of the crisis, which eventually helped the economy recover.
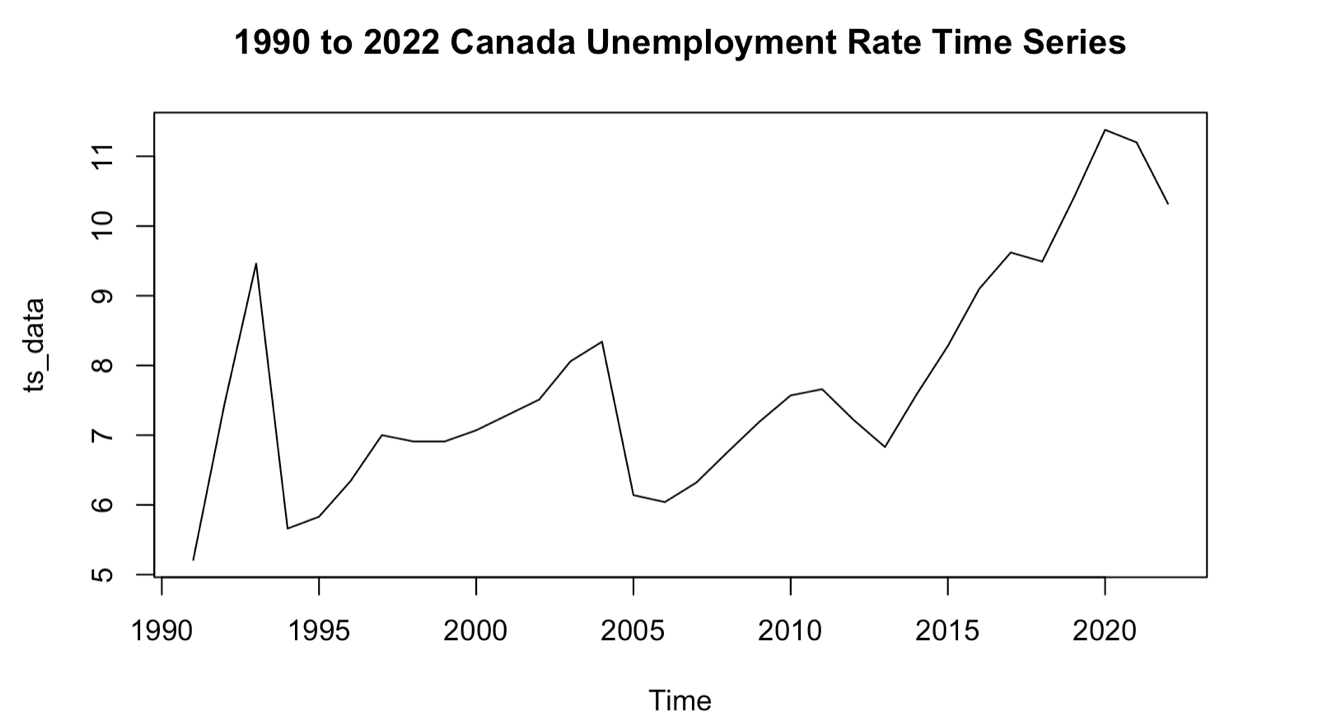
Figure 1: 1990 to 2022 Canada Unemployment Statistics.
Especially since the end of 2019, the pandemic has had a significant impact on the global economy, including Canada's. Unemployment has soared as a result of the blockade and economic disruption, and many people have left the Labour market. The economic downturn caused by the coronavirus pandemic pushed Canada's unemployment rate to an unprecedented peak in nearly two decades in 2020, soaring to 13.0%. That's the highest unemployment rate since the early 1990s.
After 2020, with the lifting of restrictions and the implementation of economic recovery efforts, the unemployment rate began to fall. Canada's Labour market will continue to recover from the recession caused by the COVID-19 pandemic in 2019. Both the number of unemployed and the unemployment rate fell throughout the year.
4.Data and Model
The unemployment rate data of Canada in this paper, including the unemployment rate data of the Canadian labor force with basic education and higher education, all come from the World Bank.
The prediction model used in this paper is ARIMA model. ARIMA is a predictive model that assumes that the future will repeat historical trends by looking for autocorrelations between historical data to predict the future.
Table 1: Basic Characteristics of the Three Sets of Data.
|
Min |
Max |
Mean |
Median |
|
|
Unemployment rate of CA |
5.21 |
11.38 |
7.75 |
7.38 |
|
Basic education unemployment rate of CA |
11.37 |
17.45 |
14.15 |
14.12 |
|
Advanced education unemployment rate of CA |
4.1 |
8.2 |
5.72 |
5.46 |
5.Forecast Using ARIMA Model
This paper uses the ARIMA model to forecast the Canadian unemployment rate over the next 10 years. ARIMA's forecasts may be more sensitive to historical autocorrelation patterns and long-term trends.
The step-by-step process of creating an ARIMA model for unemployment prediction consists of approximately the following steps:
First, this paper will use data provided by the World Bank on Canada's historical unemployment rate in years from 1990 to 2022 as the model forecast for the forecast.
Second, the data will be preprocessed. The purpose of converting the data into time series format is to clean up the data and process the missing data.
Then a line graph is drawn to check the trend and seasonality of the data to ensure the stability of the data. From the line chart drawn, it can be seen that the fluctuation amplitude of the curve varies greatly, that is, the data of Canadian unemployment rate fluctuates, and the data visualization is not stable. However, as reflected in the line chart, there is no trend and seasonality in the data. So the data needs to be differentiated to keep the time series data stable.
Third, the data will be evaluated. By drawing line charts, ACF charts and PACF charts to evaluate the relevant data of the Canadian unemployment rate.
Since in the second step, the line chart can only show whether the data is smooth or not, seasonality needs to be confirmed by ACF and PACF charts.
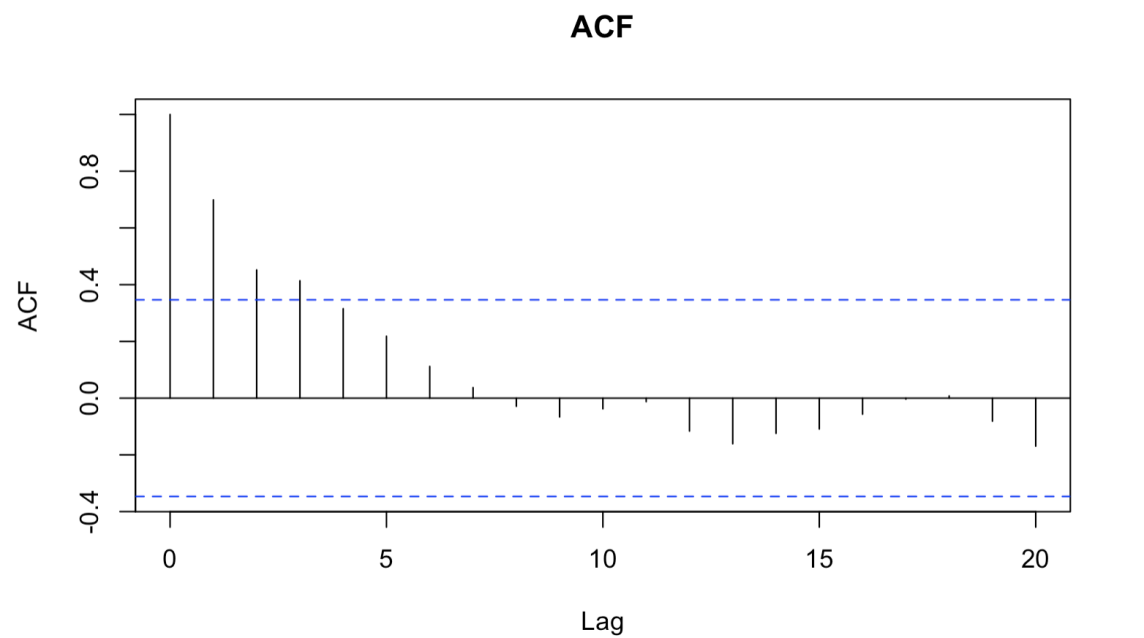
Figure 2: ACF Plot of Canada Unemployment Statistics.
By drawing the ACF graph, the lag of different time points in the graph gradually decreases and becomes smaller, which further indicates that the data needs a differential non-stationary series.
In the ACF diagram, lag 0 has obvious lag, and lag 1 to lag 3 also has a range beyond the specified critical value. A significant peak at lag 1 indicates a strong seasonal component in the Canadian unemployment rate data. This also suggests that the peak indicates a strong correlation with the previous time step, that the data may have an autoregressive component and that the current value of the time series is influenced by its past value.
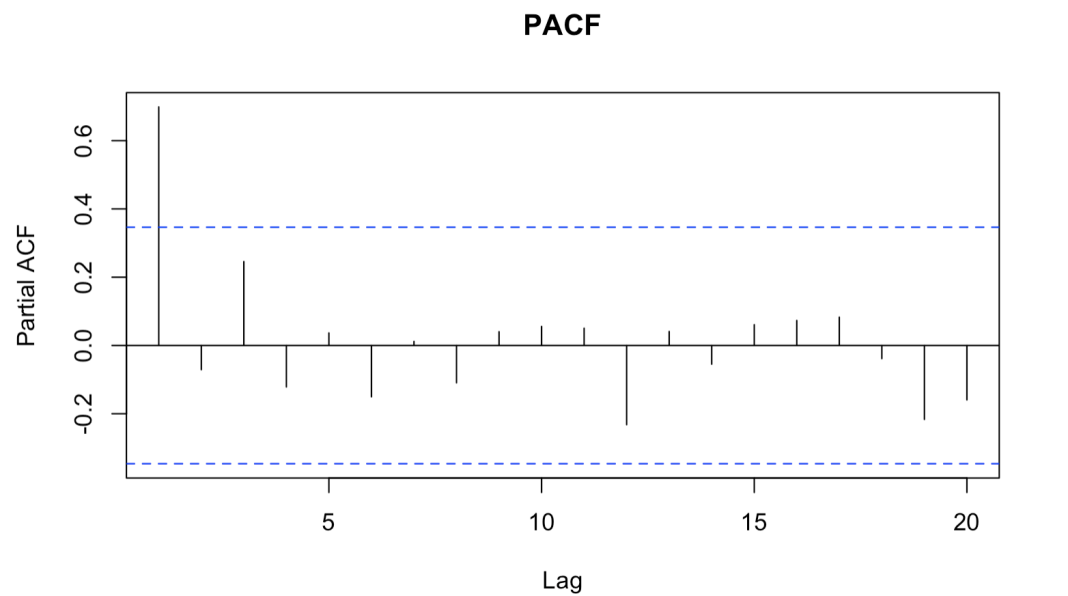
Figure 3: PACF Plot of Canada Unemployment Statistics.
In the PACF diagram, the same conclusion can be drawn as in the ACF diagram that the presence of data indicates the possible presence of an AR component. In addition, it can be seen from the PACF diagram that there is MA component in the data, because the sharp decline after a certain lag indicates the end of the correlation.
Based on the information from the above relevant data, AR order (p) and MA order (q) can be determined by ACF and PACF diagrams. Looking for significant spikes in the ACF plot, MR Order (p) is 1; Also look for significant spikes in the PACF plot, with an AR order (p) of 1.
Fourth, prepare the data predicted by the ARIMA model to meet the criteria. Use differences to eliminate trends and seasonality to ensure data stationarity.
Fifth, the three parameters (p, d, q) of the ARIMA model are determined.
When the data is differenced once, the stationary data can be used in the predictive analysis of the ARIMA model. That is, the three parameters (p, d, q) of the ARIMA model are (1,1,1).
The three parameters of the ARIMA model can also be determined by an automated method, that is, by referring to the values of AIC and BIC to evaluate the goodness of fit of the model and select the best combination of parameters. When the three parameters of the model are (1,1,1), AIC, AICc and BIC values are the lowest, and the model fitting effect is the best. In this state, the AIC is 962.8, the AICc is 962.87 and the BIC is 986.67.
Sixth, data prediction and visualization of the next ten years based on the fitted model.
5.1.Test Residuals
This article uses the residuals () function to calculate residuals for the ETS and ARIMA models. Then, a Ljung-Box test and a Box-Pierce test are performed on the residual.
It can be seen that the P-value results obtained by the two residual test methods are similar.
In the ARIMA model, according to the Ljung-Box test and Box-Pierce test, the null hypothesis cannot be rejected, and the residual is consistent with the white noise, because the P-value respectively are around 0.9958 and 0.9999, greater than 0.05.
5.2.Accuracy
The ARIMA model gives a relatively accurate forecast, finding that the model predicts that the future Canadian unemployment rate will have a relatively significant decline around 2023, but the unemployment rate will return to the highest level, continue to fluctuate and the unemployment rate will remain at the level affected by the current epidemic, and then stabilize. This reflects some weakness in Canada's Labour market.
However, it is important to note that both forecasts are based on historical data and current trends, and that future events affecting the economic situation, changes in Canadian government policy, or unforeseen crises may have different effects on the actual unemployment rate than the models predict.
Table 2: Accuracy of ARIMA Model Forecast Results.
|
ME |
RMSE |
MAE |
MPE |
MAPE |
MASE |
ACF1 |
|
|
Training Set |
0.003972 |
0.416355 |
0.166595 |
-0.144299 |
2.859132 |
0.182825 |
-0.010398 |
5.3.The Relationship Between Unemployment and Education Levels
Since this article analyzes the unemployment rate in Canada today from the perspective of young people, the potential unemployment problem after graduation becomes a problem. In order to solve this problem, this paper analyzes and predicts the unemployment rate of different education levels. This analysis aims to provide valuable insights and advice to both educated and uneducated people on whether to continue their studies or enter the workforce. The data used in this study covers unemployment rates in Canada from 1990 to 2022, categorized by their level of education: those with basic education and those with post-secondary education.
This paper identifies underlying trends by visualizing the average unemployment rate for each education level. Based on these calculated averages and the corresponding graphs, this paper presents hypotheses to better understand the results observed in this paper and predicted with the ARIMA model:
In Canada, as in many countries, there is often a correlation between education levels and unemployment rates. People with basic education, usually those with a high school degree or less, tend to have higher unemployment rates than those with higher education. Such people tend to be more vulnerable to crises brought about by economic fluctuations. People with higher education or specialized training generally have lower unemployment rates than those with basic education. Because higher education levels often lead to a wider range of job opportunities in industries that require specialized skills and expertise.
As can be seen from the graph, first of all, people with basic education have the same trend as people with higher education. However, the unemployment rate of people with higher education is statistically much lower than that of people with basic education. Secondly, the figure clearly shows that when faced with crisis factors that will affect the graduation rate, the unemployment rate of people with higher education fluctuates compared to that of people with basic education. Economic challenges caused by high interest rates and the recession caused Canada's unemployment rate to rise to 11.3% in the 1990s, until the North American Free Trade Agreement (NAFTA), signed in 1994, boosted economic growth and cushioned the crisis spike in unemployment, indirectly helping to bring it down. During the global financial crisis triggered by the subprime mortgage crisis in 2008, Canada's unemployment rate reached about 8.3%. The government adopted stimulus measures to offset the impact of the crisis, which eventually helped the economic recovery reduce Canada's unemployment rate.
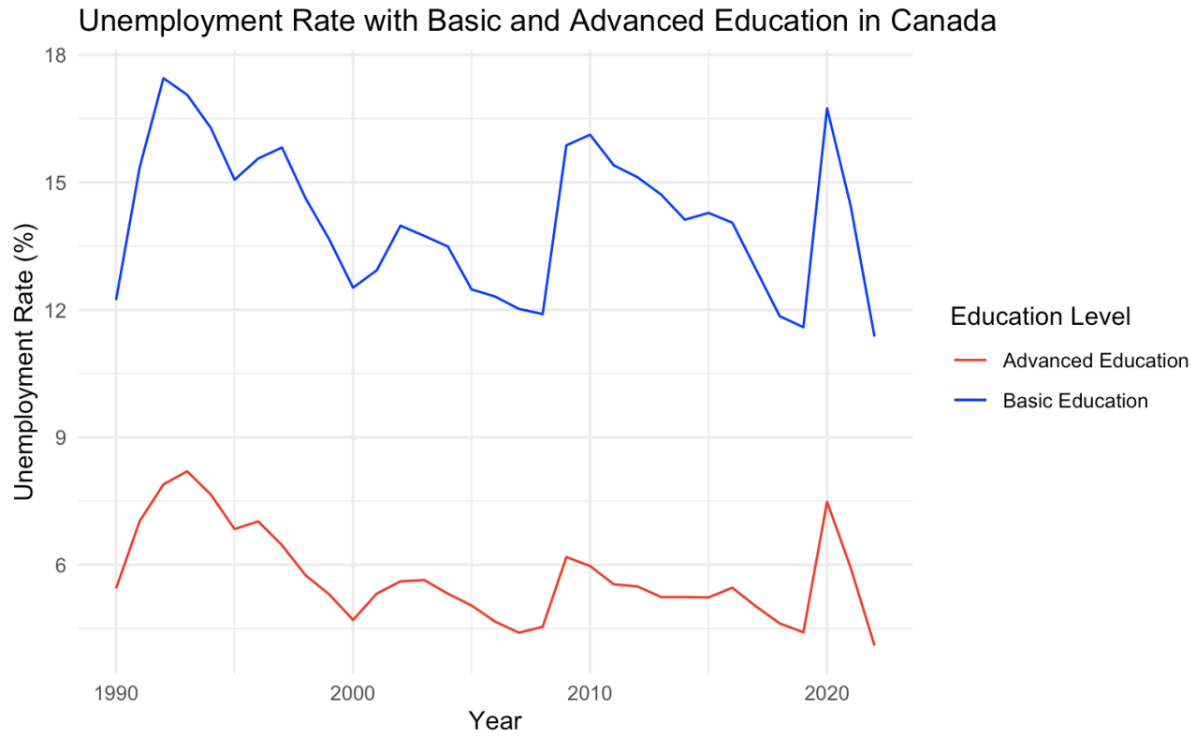
Figure 4: Unemployment Rate with Basic and Advanced Education in Canada.
Nowadays, Covid-19 has brought too much unpredictability, and unemployment has continued to spike and be far more volatile than anyone expected. Therefore, this paper will also use the ARIMA model to analyze and predict whether the unemployment rate of people with basic education and the unemployment rate of people with higher education will maintain the above two characteristics in the post-epidemic era. The purpose of this forecast is to identify the challenges and opportunities that both groups face in terms of economic recovery and market changes, as well as to provide information on the likely future direction of the unemployment rate for the labor market, and whether people in the labor market need to focus on improving their ability to adapt or focus on improving their ability to adapt to changing economic conditions. This helps policymakers, businesses and individuals make more informed decisions to better adapt to the future job market.
5.4.Forecast and Analysis of Unemployment Rate under Education Level
According to the results of forecast using ARIMA model and the plot generated based on the results, there seems to be a clear trend that the unemployment rate generally declines with higher education levels, which is consistent with the original assumption of this article.
Similarly, this paper uses the ARIMA method to forecast the entire labor market, and uses the historical Canadian unemployment rate data provided by the World Bank from 1990 to 2022 as the model forecast data to forecast the next ten years' data. Analyze and determine the parameters involved in the ARIMA model. As can be seen from the chart, the Canadian unemployment rate forecast related to educational attainment also uses the (1,1,1) parameter.
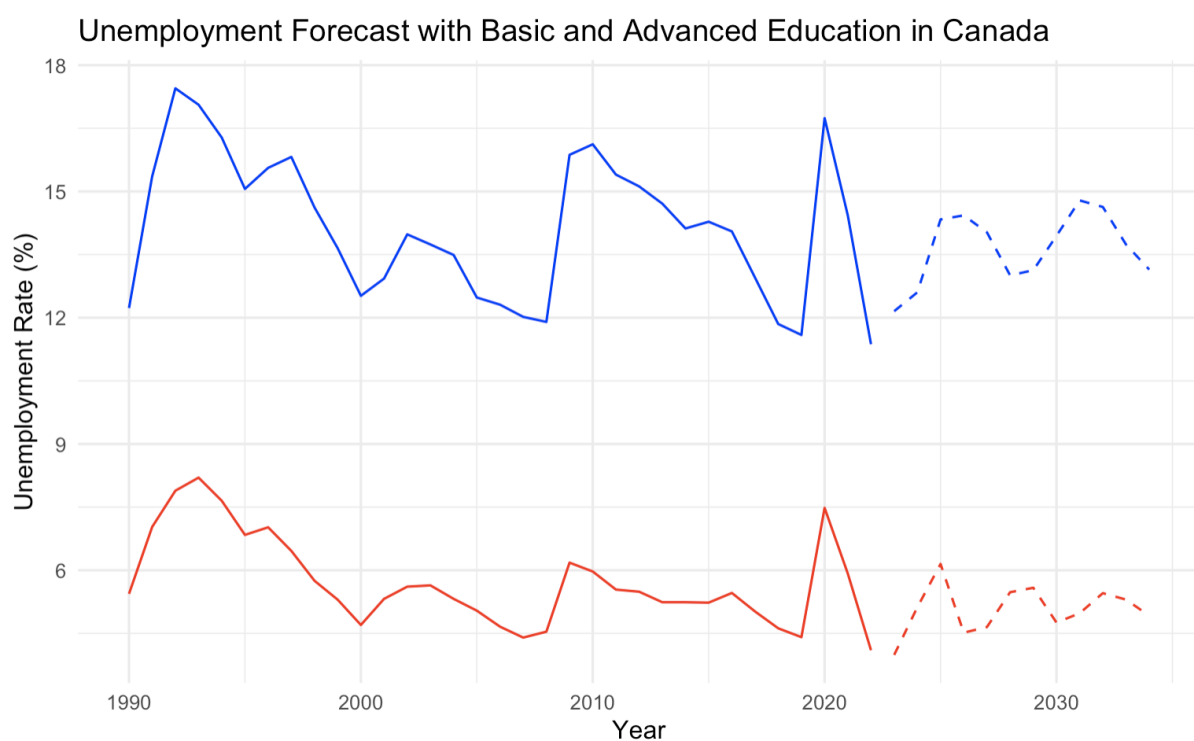
Figure 5: Unemployment Rate with Basic and Advanced Education in Canada.
When the forecast plot is drawn, the trend is also clear. First, consistent with the forecast trend of unemployment for the Canadian Labour market as a whole, which was first predicted in this paper, the Canadian unemployment rate related to educational attainment is also expected to increase over the next decade. Second, the Canadian unemployment rate data related to educational attainment supports the assumption in this paper that the higher the degree, the lower the unemployment rate. And the forecast conclusions are in line with the conclusions about the trend mentioned earlier. First of all, the predicted data also concludes that the unemployment rate of people with higher education in the future is statistically much lower than that of people with basic education. Second, when confronted with factors that affect graduation rates, the unemployment rate for people with higher education fluctuates compared to the unemployment rate for people with basic education.
6.Conclusion
Based on the data analysis of the previous Canadian unemployment rate and the prediction of the ARIMA model, the long-term impact of COVID-19 is still very deep. Although the unemployment rate will decrease in 20023, it will basically maintain a relatively high degree of continuous fluctuation. Secondly, when analyzing the unemployment rate corresponding to the different levels of education in the Canadian labor market in the past, the data clearly shows that the unemployment rate of the group with higher education is much smaller than that of the group with only basic education, and the fluctuation of the unemployment rate of the group with higher education will also be lower than that of the group with only basic education in times of crisis. Similarly predicating the unemployment rates of the two groups over the next ten years leads to the conclusion that the unemployment rates of the two groups in the future will maintain the characteristics of the pre-pandemic period. Thus, the highly educated tend to weather economic downturns better than those with relatively little education.
All the prediction analysis in this paper is based on the modeling of the actual observed data in the past, ignoring the related effects of the subsequent time. For example, the Canadian government introduced easing policies to ease the downturn in the labor market. Based on the above, Dynamic Regression Models can be used in future predictive analysis to deal with dynamic factors in time series.
References
[1]. Kreishan, Fuad M. "Economic growth and unemployment: An empirical analysis." Journal of social sciences 7.2 (2011): 228-231.
[2]. Pohlan, Laura. "Unemployment and social exclusion." Journal of Economic Behavior & Organization 164 (2019): 273-299.
[3]. Saunders, Peter. "The direct and indirect effects of unemployment on poverty and inequality." Australian Journal of Labour Economics 5.4 (2002): 507-529.
[4]. “Youth Unemployment: A Global Crisis.” Mercy Corps, 2 Mar. 2022, www.mercycorps.org/blog/youth-unemployment-global-crisis.
[5]. Shrestha, Nistha, et al. “The impact of covid-19 on Globalization.” One Health, vol. 11, 2020, p. 100180, https://doi.org/10.1016/j.onehlt.2020.100180.
[6]. Press, The Canadian. “Canada’s Unemployment Rate Reaches Record 13.7% - National.” Global News, 6 June 2020, globalnews.ca/news/7029601/canada-may-unemployment-rate/.
[7]. Layard, Richard, Stephen J. Nickell, and Richard Jackman. Unemployment: macroeconomic performance and the labour market. Oxford University Press, USA, 2005.
[8]. Government of Canada, Statistics Canada. “Labour Force Survey, January 2022.” The Daily - , 4 Feb. 2022, www150.statcan.gc.ca/n1/daily-quotidien/220204/dq220204a-eng.htm.
[9]. Blustein, David L., et al. “Unemployment in the Time of COVID-19: A Research Agenda.” Journal of Vocational Behavior, vol. 119, 2020, p. 103436.
[10]. Janko, Zuzana. "Unemployment and labor force participation in Canada." Applied Economics Letters 30.12 (2023): 1647-1651.
[11]. Janko, Zuzana, and Gurleen Popli. “Examining the Link between Crime and Unemployment: A Time-Series Analysis for Canada.” Applied Economics, vol. 47, no. 37, 2015, pp. 4007–4019.
[12]. Popirlan, Claudiu Ionut, et al. “Predicting the Unemployment Rate and Energy Poverty Levels in Selected European Union Countries Using an Arima-ARNN Model.” PeerJ Computer Science, vol. 9, 2023, https://doi.org/10.7717/peerj-cs.1464.
Cite this article
Chen,T. (2023). A Multifaceted Analysis of the Canada Unemployment Rate under Time Series —— Based on Education Level. Advances in Economics, Management and Political Sciences,53,279-287.
Data availability
The datasets used and/or analyzed during the current study will be available from the authors upon reasonable request.
Disclaimer/Publisher's Note
The statements, opinions and data contained in all publications are solely those of the individual author(s) and contributor(s) and not of EWA Publishing and/or the editor(s). EWA Publishing and/or the editor(s) disclaim responsibility for any injury to people or property resulting from any ideas, methods, instructions or products referred to in the content.
About volume
Volume title: Proceedings of the 2nd International Conference on Financial Technology and Business Analysis
© 2024 by the author(s). Licensee EWA Publishing, Oxford, UK. This article is an open access article distributed under the terms and
conditions of the Creative Commons Attribution (CC BY) license. Authors who
publish this series agree to the following terms:
1. Authors retain copyright and grant the series right of first publication with the work simultaneously licensed under a Creative Commons
Attribution License that allows others to share the work with an acknowledgment of the work's authorship and initial publication in this
series.
2. Authors are able to enter into separate, additional contractual arrangements for the non-exclusive distribution of the series's published
version of the work (e.g., post it to an institutional repository or publish it in a book), with an acknowledgment of its initial
publication in this series.
3. Authors are permitted and encouraged to post their work online (e.g., in institutional repositories or on their website) prior to and
during the submission process, as it can lead to productive exchanges, as well as earlier and greater citation of published work (See
Open access policy for details).
References
[1]. Kreishan, Fuad M. "Economic growth and unemployment: An empirical analysis." Journal of social sciences 7.2 (2011): 228-231.
[2]. Pohlan, Laura. "Unemployment and social exclusion." Journal of Economic Behavior & Organization 164 (2019): 273-299.
[3]. Saunders, Peter. "The direct and indirect effects of unemployment on poverty and inequality." Australian Journal of Labour Economics 5.4 (2002): 507-529.
[4]. “Youth Unemployment: A Global Crisis.” Mercy Corps, 2 Mar. 2022, www.mercycorps.org/blog/youth-unemployment-global-crisis.
[5]. Shrestha, Nistha, et al. “The impact of covid-19 on Globalization.” One Health, vol. 11, 2020, p. 100180, https://doi.org/10.1016/j.onehlt.2020.100180.
[6]. Press, The Canadian. “Canada’s Unemployment Rate Reaches Record 13.7% - National.” Global News, 6 June 2020, globalnews.ca/news/7029601/canada-may-unemployment-rate/.
[7]. Layard, Richard, Stephen J. Nickell, and Richard Jackman. Unemployment: macroeconomic performance and the labour market. Oxford University Press, USA, 2005.
[8]. Government of Canada, Statistics Canada. “Labour Force Survey, January 2022.” The Daily - , 4 Feb. 2022, www150.statcan.gc.ca/n1/daily-quotidien/220204/dq220204a-eng.htm.
[9]. Blustein, David L., et al. “Unemployment in the Time of COVID-19: A Research Agenda.” Journal of Vocational Behavior, vol. 119, 2020, p. 103436.
[10]. Janko, Zuzana. "Unemployment and labor force participation in Canada." Applied Economics Letters 30.12 (2023): 1647-1651.
[11]. Janko, Zuzana, and Gurleen Popli. “Examining the Link between Crime and Unemployment: A Time-Series Analysis for Canada.” Applied Economics, vol. 47, no. 37, 2015, pp. 4007–4019.
[12]. Popirlan, Claudiu Ionut, et al. “Predicting the Unemployment Rate and Energy Poverty Levels in Selected European Union Countries Using an Arima-ARNN Model.” PeerJ Computer Science, vol. 9, 2023, https://doi.org/10.7717/peerj-cs.1464.