


1. Introduction
China is the world’s second-largest economy, and its economic growth over the past few decades has greatly contributed to the development of the world economy. China’s economic development is inseparable from appropriate exchange rate policies and stable exchange rate levels. The development of the exchange rate regime can be identified and is affected by macroeconomic conditions, including elements such as the relative factor endowments among nations and the scale of bilateral market interactions [1].
With the growth of China’s economy, China’s exchange rate policy is also constantly changing. A “dual-track” exchange rate paradigm was adopted by China in 1994 as part of a gradual transition away from its previous fixed exchange rate structure. In 2005, China introduced a covert exchange rate regime based on a basket of currencies. This trajectory was furthered in 2015 when China formally attained basic capital account convertibility, fostering an atmosphere favorable to unrestricted capital flows, and enhancing the RMB’s market-oriented characteristics. However, the RMB’s exchange rate has simultaneously demonstrated a heightened propensity for oscillation, becoming increasingly pliable to external macroeconomic and microeconomic factors. The US interest rate, US stock price, and the difference in inflation rates all positively impact on the CNY/USD exchange rate, whereas China’s interest rate, US real GDP, and China’s stock price all have a negative impact [2].
Exchange rate determines the relative value of currencies between different countries, and affects the pricing of goods and services. Exchange rate is determined by a variety of factors, such as interest rate differences, inflation rates, trade balance conditions, government intervention, political stability, etc. Exchange rates determine the relative value of currencies between different countries, affecting the pricing of goods and services. The domestic economy’s real annual GDP growth slows down when foreign interest rates increase. The main reason for this is how foreign interest rates influence domestic interest rates, which is also the most reasonable way to understand this situation [3]. In addition, after the reform of the exchange rate regime in 1994, the RMB experienced a large-scale depreciation. It was mainly due to the deterioration of the international environment, the drastic changes in the Soviet Union and the East, the economic collapse of China’s traditional trading partners, and the serious financial problems of the central government.
Meanwhile, a stable exchange rate level is very important for a country’s economic development. China is the world’s largest trading nation, and foreign trade has an important role in boosting China’s economy. Exchange rate fluctuations affect a country’s exports and imports, and thus affect its trade balance and foreign exchange reserves. The RMB exchange rate has experienced several fluctuations in response to various exogenous shocks, such as the global financial crisis, the Sino-US trade conflict, the COVID-19 pandemic, and the Federal Reserve’s monetary tightening.
Despite encountering foreign sanctions, industrial relocations, and domestic economic restructuring, China, a nation highly interdependent with the global economy, has maintained its fundamental status quo. Notably, China’s aggregate imports and exports projected to comprise 34.76% of GDP in 2022. Exchange rate fluctuations also affect a country’s economic growth and employment level. When the currency appreciates beyond a threshold value, not only does the RMB exchange rate have a significant inhibitory effect on employment, but it also leads to a decline in the employment share of the secondary and tertiary industries and a decrease in the ratio of trade to non-trade sector employment, which is unfavorable for improving the employment structure [4].
In the present research landscape concerning the RMB exchange rate, the predominant focus lies on exploring the association between an individual indicator and the exchange rate. Simultaneously, these studies integrate the collective influence of various indicators on the exchange rate. The USD/CNY exchange rate volatility has a significant positive impact on China’s crude oil prices, which implies that a stronger US dollar relative to the RMB leads to higher crude oil prices in China [5]. Alternatively, it involves the scrutiny of the interrelationships between the RMB exchange rate and the exchange rates of alternative currencies. The CNY–JPY has long-term negative cross-correlations, during the European debt crisis, but CNY and KRW are positively cross-correlated [6].
Under the influence of the pandemic in the past few years, Western countries have generally adopted a more relaxed monetary policy, which has stabilized economic growth in the short term, but also caused large-scale inflation due to excessive money supply. Through measures such as interest rate hikes, inflation has been suppressed, but it has further aggravated the risk of a global economic recession [7]. This paper examines the determinants of the exchange rate level considering the new situation, and analyzes the long-term and sub-period contributions of different factors to the exchange rate level.
The subsequent sections of this paper will follow this structure. In the forthcoming segment, a succinct literature review will be undertaken. Section 3 will introduce the employed methodology, encompassing a detailed exposition of the model, data selection, and indicator construction. Moving on to section 4, the analysis outcomes and predictions will be presented, and the ensuing discourse will revolve around the interpretation of these findings. Ultimately, section 5 will conclude with a concise summarization of the entire manuscript.
2. Literature Review
The RMB exchange rate stayed at a high and stable level for a long time until the exchange rate reform in 1994. After the reform of the exchange rate regime, the exchange rate movement revealed the real currency value more, and along with the changes in the home and abroad situation, the RMB underwent a large decline. But it was also due to the currency decline that attracted much foreign capital, stimulated the foreign trade growth, maintained a large trade surplus annually, and accumulated much foreign exchange reserves. This was also how China could survive the impact of the Asian financial crisis in 1997. China has a large amount of foreign exchange reserves, which has protected it from the worst effects of the crisis. By the end of 1998, China’s net foreign exchange reserves were about $149 billion. In 1998, China’s exports remained stable and the trade surplus was nearly $44 billion [8].
In the context of economic globalization, the exchange rate has an important impact on a country and society, and even every citizen. The exchange rate affects everyone’s daily life through international economic exchanges. Commodities, US Treasury bond rates, stock markets, international situations, policy changes and exchange rate fluctuations are all closely related. The impact of commodities on a country’s exchange rate mainly depends on the proportion of commodity imports in the domestic market. The change in commodity prices directly affects international trade balance, which in turn affects a country’s GDP and foreign exchange reserves [9]. RMB depreciation is beneficial to commodity trade, and the stock market remains bullish during the depreciation period, but it may lead to a certain degree of capital outflow [10]. The U.S. has urged China to appreciate its undervalued currency since the mid-2000s, arguing that it boosts China’s manufacturing competitiveness and causes bilateral trade imbalances [11].
The exchange rate effects on economic growth are time-sensitive. Short-term exchange rate fluctuations can affect the balance of international payments, stimulate economic growth, but in the long run, fluctuating exchange rates will suppress economic growth and affect foreign direct investment [12]. At the same time, there are time differences in the analysis and prediction of exchange rates by macroeconomic factors. In the short term, the fundamentals of the economy are difficult to explain the exchange rate well, and the exchange rate is more affected by market sentiment. The fundamentals of the economy may have a greater impact on the exchange rate in the long term (more than two years) [13]. The quantitative analysis part of this paper, considering the possible existence of irrational factors such as market sentiment, chose a longer sample period and combined it with monthly data.
3. Methodology
3.1. Data
The sample data used in the paper are monthly data from February 1994 to June 2023, with a sample size of 353. The research data of this paper are from diverse sources, including the official website of the National Bureau of Statistics of China, the official website of the U.S. Census Bureau, and the famous financial website Investing.com. The selected independent variables include the U.S. dollar index (DXY), China’s GDP index, China’s CPI, commodity price index (CRB), and the U.S.-China trade balance (U.S. Customs statistics).
The GDP index holds significance as a crucial macroeconomic gauge employed for the assessment and scrutiny of the cumulative economic activity within a nation or region. It provides insight into growth trends and offers a platform for the analysis of diverse economic phenomena and policy ramifications. Conversely, the DXY assumes a pivotal role as a financial metric of paramount importance, serving to mirror the comprehensive performance and trajectory of the United States dollar within the international foreign exchange arena. Its purview encompasses not only the broader financial landscape but also the far-reaching influence of global economic conditions.
On a different note, the CPI functions as a metric that delineates vital domestic economic facets, encompassing inflation dynamics, purchasing power fluctuations, and the intricate tapestry of monetary policy. In a parallel vein, the CRB index assumes a role of measuring the intricate fluctuations in the pricing of commodities, thereby furnishing invaluable insights into the trajectories of commodity markets, the specter of inflation, the vigor of global economic activities, and the discernment of prudent investment avenues.
Not to be overlooked, the US-China trade balance encapsulates the intricate web of trade interactions between these economic giants. The vigilant scrutiny exercised by policy makers and economists alike is inextricably tied to a fervent assessment of this metric, designed to evaluate its reverberations upon the economies of both nations and the fluid dynamics of the global trade landscape. The selection of these indicators in this study primarily takes into consideration the macroeconomic conditions of China and the global economic influence on China.
To begin with, the present study undertakes a concise descriptive statistical analysis of the data. As evident from Table 1, substantial disparities are observed in the magnitudes and variances across different datasets. This underscores the necessity for data preprocessing to mitigate the undue influence of outliers on the overarching model. Notably, IMEX predominantly assumes negative values, consistent with the prevailing understanding of U.S.-China trade dynamics, where the United States perennially experiences a trade deficit.
Table 1: Descriptive Statistics Analysis.
CNY/USD | GDP Index | DXY | IMEX | CRB | CPI | |
Mean | 7.3785 | 108.6455 | 92.0005 | -18676.4212 | 212.0945 | 3.3567 |
Standard Error | 0.0458 | 0.1557 | 0.5647 | 578.6309 | 4.4133 | 0.2804 |
Median | 7.0722 | 108.6000 | 92.1200 | -20167.6000 | 199.2500 | 1.9000 |
Mode | 8.2765 | 106.9000 | 94.5500 | -19319.5000 | 296.9100 | 1.5000 |
Standard Deviation | 0.8607 | 2.9251 | 10.6090 | 10871.4885 | 82.9176 | 5.2689 |
Sample Variance | 0.7408 | 8.5563 | 112.5517 | 118189261.5007 | 6875.3325 | 27.7615 |
Kurtosis | -1.6931 | 3.3707 | -0.2494 | -1.2973 | -0.8287 | 8.5725 |
Skewness | 0.0013 | -0.6673 | 0.4201 | 0.0693 | 0.1796 | 2.8368 |
Range | 2.6741 | 25.6000 | 48.4400 | 41493.1000 | 392.4200 | 30.3800 |
Minimum | 6.0509 | 93.1000 | 71.8000 | -42892.4000 | 66.5400 | -2.6800 |
Maximum | 8.7251 | 118.7000 | 120.2400 | -1399.3000 | 458.9600 | 27.7000 |
Count | 353 | 353 | 353 | 353 | 353 | 353 |
Maximum | 8.7251 | 118.7000 | 120.2400 | -1399.3000 | 458.9600 | 27.7000 |
Minimum | 6.0509 | 93.1000 | 71.8000 | -42892.4000 | 66.5400 | -2.6800 |
The trade balance between the U.S. and China has a notable seasonal variation, as shown by simple graphs of six data sets from Figure 1. Global events caused all data to fluctuate sharply.
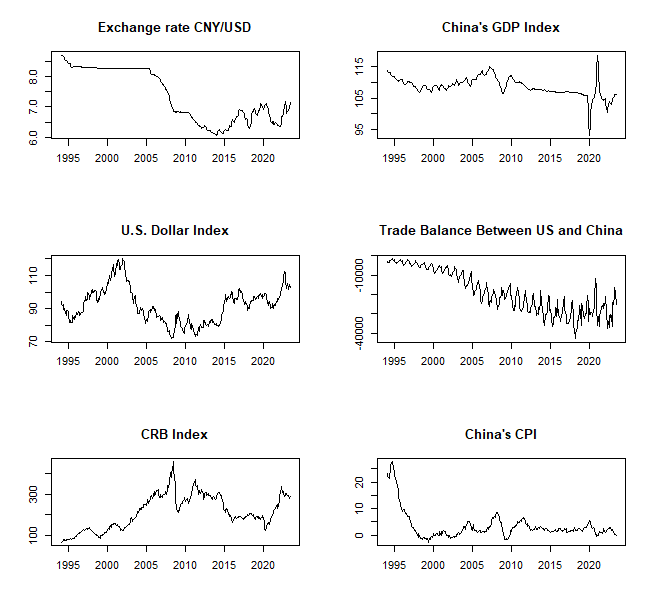
Figure 1: The Performance of 6 Variables from 1994 to 2023.
3.2. Research Design
This paper mainly adopts a quantitative research method to explore whether there is a significant linear relationship between the RMB exchange rate and its related influencing factors. More specifically, it uses a multiple regression method to examine the degree and significance of the impact of different influencing factors on the RMB exchange rate. Moreover, in the subsequent robustness test, it divides the sample into groups according to important events as time nodes, and observes the differences between the group results and the overall results, as well as the differences among the groups.
First, the sample data were processed. This included using linear interpolation to convert quarterly GDP data into monthly data, and standardizing all data to the same time dimension. Furthermore, log transformation was employed across all datasets in this study, harmonizing the data scale and enhancing the precision and interpretability of the model outcomes.
When dividing the sample, the following time periods were included: (1) 1994-2001, from China’s formal start of exchange rate regime reform to joining the WTO, China’s international trade continued to develop and resisted the Asian financial crisis; (2) 2001-2008, during this period, China continued to promote exchange rate regime reform, benefiting from the WTO, China’s international trade continued to develop; (3) 2008-2015, the global financial crisis had a profound impact, China officially surpassed Japan and became the world’s second largest economy; (4) 2015-2020, China carried out a new round of exchange rate regime reform, trade conflicts between China and the United States emerged, China faced multiple sanctions, RMB exchange rate fluctuations increased, and returned to “7.00 CNY/USD”; (5) 2020-now, after the pandemic, the world faced economic downturn, weak consumption, and shrinking international trade, but the economic recovery speed of different countries varied.
Then, this paper used the least squares method to estimate the regression coefficients and performed linear regression analysis on the processed data,
\( Y={β_{0}}+{β_{1}}{X_{1}}+{β_{2}}{X_{2}}+{β_{3}}{X_{3}}+{β_{4}}{X_{4}}+{β_{5}}{X_{5}}+ε\ \ \ (1) \)
where:
\( Y \) represents the dependent variable, the monthly exchange rate between RMB and US dollar,
\( {X_{1}} \) represents the first independent variable, China’s monthly GDP Index (setting the last period as 100),
\( {X_{2}} \) represents the second independent variable, the monthly Dollar index (DXY),
\( {X_{3}} \) represents the third independent variable, the monthly balance of import-export between US and China (IMEX),
\( {X_{4}} \) represents the fourth independent variable, the monthly Commodity Research Bureau Index (CRB),
\( {X_{5}} \) represents the fifth independent variable, the monthly CPI in China
4. Empirical Results and Analysis
4.1. Analysis
This research conducted a series of six linear regression analyses to investigate the dynamics of the RMB/USD exchange rate. The initial linear regression encompassed the entire sample spanning from 1994 to 2023. As it shown in Table 2, the outcomes of this regression indicated notable linear associations between the RMB/USD exchange rate and key variables such as GDP index, DXY, IMEX, and CRB. Notably, the variable CPI exhibited limited influence on the RMB exchange rate. Among these variables, GDP index exhibited the most substantial contribution, represented by a coefficient of 1.102688, followed by DXY with a coefficient of 0.320781. This underscores the pivotal impact of China's macroeconomic conditions on the RMB exchange rate. Simultaneously, the close linkage between the RMB and the US dollar was evident, wherein the strength or weakness of the US dollar reverberated onto the RMB exchange rate.
In order to validate the durability of the outcomes derived from the linear regression analysis, five supplementary regression analyses were undertaken across distinct temporal intervals. The ensuing sub-sample regression analyses yielded intriguing insights. Variations in the relative significance and contribution of different factors to the linear relationship with the RMB exchange rate emerged across distinct time spans. During the period of 1994-2001, the US-China trade balance exerted negligible influence on the RMB exchange rate, with GDP index retaining its paramount role. Furthermore, this era exhibited the best model fit in capturing the nexus between the RMB and its influencing factors.
In the subsequent phase (2001-2008), solely the GDP index demonstrated a significant linear relationship with the RMB exchange rate, displaying a negative correlation. During this time period, the model exhibited the most optimal fitting effect in capturing the relationship between the RMB and its influencing factors (adjusted R-squared is 0.8096). This interval witnessed China's accession to the World Trade Organization, accompanied by persistent foreign trade expansion and substantial inflow of foreign direct investment. However, due to international pressures, the RMB embarked on a phase of rapid appreciation. Consequently, while GDP index increased, the RMB/USD diminished.
The third stage (2008-2015) encompassed China's sustained rapid economic growth, with its GDP and foreign trade playing pivotal roles. In the fourth phase (2015-2020), the US dollar exhibited persistent strength. Over this period, the US 10-year Treasury bond yield continued to ascend, culminating at 3.23% on August 5, 2018. Notably, variations in the U.S. Dollar Index markedly impacted the RMB/USD.
In the fifth stage (2020-now), responding to the severe inflation triggered by the pandemic, the Federal Reserve repeatedly raised interest rates, eventually reaching a federal funds rate of 5.00%-5.25%. Simultaneously, global commodity markets experienced disruptions, prompting soaring prices of raw materials for industrial production. This circumstance significantly impacted China as a pivotal export-oriented manufacturing nation. In this phase, the RMB exchange rate had significant linear relationships with both DXY and CRB, and was negatively affected by commodity price fluctuations.
Table 2: The Results of Linear Regression for 6 Models.
|
| Estimate | Std.Error | t value | Pr(>|t|) |
| Adj. R^2 | |
Model 1 (1994-2023) | (Intercept) | -3.809654 | 0.600205 | -6.347 | 6.86E-10 | *** | 0.7749 | |
X1 | 1.102688 | 0.109913 | 10.032 | < 2e-16 | *** | |||
X2 | 0.320781 | 0.030098 | 10.658 | < 2e-16 | *** | |||
X3 | -0.081707 | 0.005237 | -15.601 | < 2e-16 | *** | |||
X4 | 0.033685 | 0.010502 | 3.207 | 0.00146 | ** | |||
X5 | 0.002147 | 0.003178 | 0.676 | 0.49977 | ||||
Model 2 (1994-2001) | (Intercept) | 0.382655 | 0.36326 | 1.053 | 0.295 |
| 0.8096 | |
X1 | 0.392885 | 0.076489 | 5.136 | 1.66E-06 | *** | |||
X2 | 0.052671 | 0.009252 | 5.693 | 1.62E-07 | *** | |||
X3 | -0.003073 | 0.001984 | -1.549 | 0.125 | ||||
X4 | -0.024703 | 0.004051 | -6.098 | 2.79E-08 | *** | |||
X5 | 0.001682 | 0.000836 | 2.012 | 0.0472 | * | |||
Model 3 (2001-2008) | (Intercept) | 8.512055 | 1.200167 | 7.092 | 9.67E-10 | *** | 0.5954 | |
X1 | -1.33748 | 0.255236 | -5.24 | 1.71E-06 | *** | |||
X2 | 0.009815 | 0.067163 | 0.146 | 0.884 | ||||
X3 | 0.00861 | 0.010474 | 0.822 | 0.414 | ||||
X4 | 0.00147 | 0.024094 | 0.061 | 0.952 | ||||
X5 | -0.00763 | 0.007549 | -1.011 | 0.316 |
| |||
Model 4 (2008-2015) | (Intercept) | -5.920383 | 1.458181 | -4.06 | 0.000109 | *** | 0.5372 | |
X1 | 1.635574 | 0.241181 | 6.782 | 1.49E-09 | *** | |||
X2 | 0.131583 | 0.09614 | 1.369 | 0.174715 | ||||
X3 | -0.050733 | 0.015004 | -3.381 | 0.001092 | ** | |||
X4 | 0.053535 | 0.041248 | 1.298 | 0.197842 | ||||
X5 | -0.008717 | 0.005071 | -1.719 | 0.089259 | . | |||
Model 5 (2015-2020) | (Intercept) | 0.435053 | 1.156416 | 0.376 | 0.7085 |
| 0.3725 | |
X1 | -0.05454 | 0.177516 | -0.307 | 0.76 | ||||
X2 | 0.433707 | 0.10749 | 4.035 | 0.0002 | *** | |||
X3 | -0.004787 | 0.019746 | -0.242 | 0.8095 | ||||
X4 | -0.003773 | 0.062931 | -0.06 | 0.9524 | ||||
X5 | 0.045354 | 0.022252 | 2.038 | 0.0472 | * | |||
Model 6 (2020-now) | (Intercept) | 0.316038 | 0.840221 | 0.376 | 0.709 | 0.6962 | ||
X1 | -0.095886 | 0.172917 | -0.555 | 0.583 | ||||
X2 | 0.599473 | 0.0698 | 8.588 | 3.88E-10 | *** | |||
X3 | 0.009278 | 0.015958 | 0.581 | 0.565 | ||||
X4 | -0.096897 | 0.015612 | -6.207 | 4.13E-07 | *** | |||
X5 | -0.02534 | 0.020931 | -1.211 | 0.234 |
| |||
Signif. codes: 0 ‘***’ 0.001 ‘**’ 0.01 ‘*’ 0.05 ‘.’ 0.1 ‘ ’ 1 | ||||||||
4.2. Limitation and Outlook
The quantitative analysis demonstrates that the selected factors exhibit varying linear relationships with the RMB exchange rate, with performance diverging across different time periods. While early periods indicate strong fits, recent years show less significance and weaker model fit, suggesting shifts in influencing factors or the need for additional considerations. The study acknowledges potential limitations in sample size and data frequency, and suggests introducing more advanced methodologies, such as instrumental variables and difference-in-differences, for deeper analysis of data changes and endogeneity in future research.
5. Conclusion
This paper synthesizes existing literature and identifies several factors closely linked to the RMB exchange rate. This paper applies the least squares method to estimate the regression coefficients and assess the effects of various factors on the RMB exchange rate. The findings indicate that the RMB exchange rate is largely determined by China’s own macroeconomic conditions. Subsequent robustness tests reveal that the same influential factors exhibit varying effects across different temporal intervals. This highlights the necessity of considering both domestic and foreign economic and political conditions across diverse timeframes when analyzing factors affecting the exchange rate. Timely adjustments to influencing variables or assigning appropriate weights to different factors may yield more precise fitting outcomes.
References
[1]. Sabrina Dorn, Peter Egger, On the distribution of exchange rate regime treatment effects on international trade, Journal of International Money and Finance, Volume 53, 2015, Pages 75-94, ISSN 0261-5606.
[2]. Hsing, Yu. "Determinants of the CNY/USD exchange rate: A simultaneous-equation model." International Journal of Monetary Economics and Finance 8.3 (2015): 274-281.
[3]. Julian di Giovanni, Jay C. Shambaugh, The impact of foreign interest rates on the economy: The role of the exchange rate regime, Journal of International Economics, Volume 74, Issue 2, 2008, Pages 341-361, ISSN 0022-1996.
[4]. Zhang, Guangxian. (2020). Analysis of the impact of RMB exchange rate on economic growth: A review of the article “Exchange rate changes, income gaps and economic growth.” Journal of Yunnan University of Finance and Economics, 36(06), 2+113.
[5]. Chuanwang Sun, Yanhong Zhan, Yiqi Peng, Weiyi Cai, Crude oil price and exchange rate: Evidence from the period before and after the launch of China's crude oil futures, Energy Economics, Volume 105, 2022, 105707, ISSN 0140-9883.
[6]. Wang, Gang-Jin & Xie, Chi, 2013. "Cross-correlations between RMB and four major currencies in the RMB currency basket," Physica A: Statistical Mechanics and its Applications, Elsevier, vol. 392(6), pages 1418-1428.
[7]. Lou, F., Economic Recession Risk, Shift in Monetary Policy, and Exchange Rate Fluctuations[J]. China Money Market, 2023(02): 21-26.
[8]. Fernald, John G., and Oliver D. Babson. "Why has China survived the Asian crisis so well? What risks remain?." Financial Market Reform In China. Routledge, 2019. 55-85.
[9]. Luo X., Relationship between Exchange Rate and Prices of Commodities, Gold, and Oil[J]. Fiscal Research, 2011(01): 20-22. DOI: 10.19477/j.cnki.11-1077/f.2011.01.005.
[10]. Qian Huang, Xiangning Wang, Shuguang Zhang, The effects of exchange rate fluctuations on the stock market and the affecting mechanisms: Evidence from BRICS countries, The North American Journal of Economics and Finance, Volume 56, 2021, 101340, ISSN 1062-9408.
[11]. Makin, A.J. (2020). The China-US Trade Imbalance: Evaluating Remedial Macroeconomic Measures. In: Lau, E., Simonetti, B., Trinugroho, I., Tan, L. (eds) Economics and Finance Readings. Springer, Singapore.
[12]. S. Wang, S. Ye and X. Li, "The impact of real effective exchange rate volatility on economic growth in the process of RMB internationalization an empirical study based on VAR model," 2017 4th International Conference on Industrial Economics System and Industrial Security Engineering (IEIS), Kyoto, Japan, 2017, pp. 1-7, doi: 10.1109/IEIS.2017.8078569.
[13]. Hopper, Gregory P. "What determines the exchange rate: Economic factors or market sentiment." Business Review 5 (1997): 17-29.
Cite this article
Li,H. (2023). Analysis of the Influencing Factors of the RMB Exchange Rate. Advances in Economics, Management and Political Sciences,53,288-296.
Data availability
The datasets used and/or analyzed during the current study will be available from the authors upon reasonable request.
Disclaimer/Publisher's Note
The statements, opinions and data contained in all publications are solely those of the individual author(s) and contributor(s) and not of EWA Publishing and/or the editor(s). EWA Publishing and/or the editor(s) disclaim responsibility for any injury to people or property resulting from any ideas, methods, instructions or products referred to in the content.
About volume
Volume title: Proceedings of the 2nd International Conference on Financial Technology and Business Analysis
© 2024 by the author(s). Licensee EWA Publishing, Oxford, UK. This article is an open access article distributed under the terms and
conditions of the Creative Commons Attribution (CC BY) license. Authors who
publish this series agree to the following terms:
1. Authors retain copyright and grant the series right of first publication with the work simultaneously licensed under a Creative Commons
Attribution License that allows others to share the work with an acknowledgment of the work's authorship and initial publication in this
series.
2. Authors are able to enter into separate, additional contractual arrangements for the non-exclusive distribution of the series's published
version of the work (e.g., post it to an institutional repository or publish it in a book), with an acknowledgment of its initial
publication in this series.
3. Authors are permitted and encouraged to post their work online (e.g., in institutional repositories or on their website) prior to and
during the submission process, as it can lead to productive exchanges, as well as earlier and greater citation of published work (See
Open access policy for details).
References
[1]. Sabrina Dorn, Peter Egger, On the distribution of exchange rate regime treatment effects on international trade, Journal of International Money and Finance, Volume 53, 2015, Pages 75-94, ISSN 0261-5606.
[2]. Hsing, Yu. "Determinants of the CNY/USD exchange rate: A simultaneous-equation model." International Journal of Monetary Economics and Finance 8.3 (2015): 274-281.
[3]. Julian di Giovanni, Jay C. Shambaugh, The impact of foreign interest rates on the economy: The role of the exchange rate regime, Journal of International Economics, Volume 74, Issue 2, 2008, Pages 341-361, ISSN 0022-1996.
[4]. Zhang, Guangxian. (2020). Analysis of the impact of RMB exchange rate on economic growth: A review of the article “Exchange rate changes, income gaps and economic growth.” Journal of Yunnan University of Finance and Economics, 36(06), 2+113.
[5]. Chuanwang Sun, Yanhong Zhan, Yiqi Peng, Weiyi Cai, Crude oil price and exchange rate: Evidence from the period before and after the launch of China's crude oil futures, Energy Economics, Volume 105, 2022, 105707, ISSN 0140-9883.
[6]. Wang, Gang-Jin & Xie, Chi, 2013. "Cross-correlations between RMB and four major currencies in the RMB currency basket," Physica A: Statistical Mechanics and its Applications, Elsevier, vol. 392(6), pages 1418-1428.
[7]. Lou, F., Economic Recession Risk, Shift in Monetary Policy, and Exchange Rate Fluctuations[J]. China Money Market, 2023(02): 21-26.
[8]. Fernald, John G., and Oliver D. Babson. "Why has China survived the Asian crisis so well? What risks remain?." Financial Market Reform In China. Routledge, 2019. 55-85.
[9]. Luo X., Relationship between Exchange Rate and Prices of Commodities, Gold, and Oil[J]. Fiscal Research, 2011(01): 20-22. DOI: 10.19477/j.cnki.11-1077/f.2011.01.005.
[10]. Qian Huang, Xiangning Wang, Shuguang Zhang, The effects of exchange rate fluctuations on the stock market and the affecting mechanisms: Evidence from BRICS countries, The North American Journal of Economics and Finance, Volume 56, 2021, 101340, ISSN 1062-9408.
[11]. Makin, A.J. (2020). The China-US Trade Imbalance: Evaluating Remedial Macroeconomic Measures. In: Lau, E., Simonetti, B., Trinugroho, I., Tan, L. (eds) Economics and Finance Readings. Springer, Singapore.
[12]. S. Wang, S. Ye and X. Li, "The impact of real effective exchange rate volatility on economic growth in the process of RMB internationalization an empirical study based on VAR model," 2017 4th International Conference on Industrial Economics System and Industrial Security Engineering (IEIS), Kyoto, Japan, 2017, pp. 1-7, doi: 10.1109/IEIS.2017.8078569.
[13]. Hopper, Gregory P. "What determines the exchange rate: Economic factors or market sentiment." Business Review 5 (1997): 17-29.