


1. Introduction
In recent years, the advent of blockchain technology has revolutionized our traditional understanding of ownership, transactions, and the economy at large. Ethereum, a decentralized, open-source blockchain platform, has emerged as a pivotal player at the forefront of this revolution. Ethereum has facilitated an entirely new form of digital asset - the Non-Fungible Token (NFT). Unlike cryptocurrencies such as Bitcoin or Ethereum's native Ether, NFTs represent a unique, indivisible, and thus non-fungible asset, carving a significant niche within the broader digital economy. Through Ethereum's innovative smart contract functionality, NFTs encode ownership information on the blockchain, creating an immutable proof of ownership for digital or digitized assets, from artwork to real estate.
The majority of NFT transactions occur on the Ethereum blockchain and are powered by Ether, Ethereum's native cryptocurrency [1]. Ethereum's advanced smart contract capabilities have made it the blockchain of choice for NFT developers and marketplaces. When purchasing an NFT, a buyer typically pays in Ether, making it the default currency for NFT transactions. Ether serves as both a digital currency and a "fuel" for operating transactions on the Ethereum network. This dual role is particularly relevant in the NFT marketplace, where Ether not only serves as a medium of exchange but also powers the execution of the smart contracts that establish ownership of the NFTs. Thus, exploring if there exists a relationship between the price and price volatility of the Ethereum blockchain’s native Token Ether and NFTs users' activities becomes worth investigating. The research question for this paper thus becomes: What relationship exists between the price of the Ethereum token and the NFT trading activities on the Ethereum blockchain? By conducting a study on this topic, we can shed further light on the connections and dependencies between the two markets that used to drive and are still driving some of the most significant topics of interest in the blockchain world.
2. Literature Review
Despite the transformative potential exhibited by blockchain technologies like Ethereum and novel digital assets such as Non-Fungible Tokens (NFTs), academic literature on these topics still remains nascent. Launched in 2015, Ethereum has rapidly ascended as a trailblazer in the world of decentralized applications and smart contracts. NFTs, gaining significant traction during the COVID-19 pandemic era, have created a seismic shift in the digital ownership landscape [2]. However, the novelty of these technologies and their relatively recent prominence suggests that the body of research is still in its formative stages. Therefore, this literature review aims to collate and synthesize the currently available scholarship on Ethereum and NFTs, while acknowledging the preliminary nature of these studies and the rapidly evolving contexts they seek to document and understand.
Many research studies aim to explore the relationship and differences between cryptocurrency and traditional investments. This is because people have yet to become familiar with cryptocurrency and its related areas, and a control group that has been extensively studied is necessary for comparison. Cryptocurrencies’ returns are considered and tested as having low correlations with traditional investment products like the industry portfolio, market indices, the stock market, gold, and bonds [3][4]. The majority of Bitcoin users treat cryptocurrency less as a medium of exchange but as an asset to be traded with other cryptocurrencies and itself [5]. Other popular research topics are how cryptocurrencies’ returns and volatilities are related to each other. An investment asset like cryptocurrency lacks diversification because of the high returns and volatilities spillover effects and high correlations to each other [6]. Studies have also shown that the trading volume of a specific cryptocurrency plays an essential role in predicting the cryptocurrency’s returns [7][8]. The above preliminary studies about crypto returns, volatilities, trade volumes, and other aspects of cryptocurrencies were mainly conducted during the period when the web3 and blockchain topics were gaining popularity a few years before 2020. Most early-stage studies use Bitcoin as the main subject for their research, with some studies using Ethereum as a secondary subject for observation and comparison.
As the NFT market and the connected Ethereum gained much attention in 2021, there has been rapid growth in research in such fields. The study on NFT’s rapidly growing markets and its fluctuation in pricing show an overall steady increase in value and are currently in a market inefficient stage [9]. Academia also shows interest in the financial correlation between NFT prices and the prices of cryptocurrencies. Major cryptocurrencies’ lagged returns, especially Bitcoin and Ether, have shown some impact on the Decentraland LAND Token market, a secondary NFT market, but the price volatility connectedness between NFT and cryptocurrencies remains negligible [10]. A more detailed study on the financial connections between NFT and Ethereum finds interesting results: the return spillover effects from Ethereum to NFTs are more significant, and the price volatility spillover effects from Bitcoin to NFTs have shown to be more dominant, indicating that NFTs cannot be counted as an asset class that is separated from the Ethereum blockchain that they are traded in [11]. However, a study on whether NFTs can act as a safe haven for Cryptocurrency price and volatility fluctuations shows that during the Covid-19 and Russia-Ukraine war period, NFTs could act as a diversification investment in a portfolio to hedge against the risk of Ethereum fluctuations in the short term to the mid-term time period [12]. The financial aspects of NFTs and Ethereum are heavily studied and yield interesting and different results. However, a knowledge gap appears in connecting the financial aspects of the NFTs and Ether to user behavior.
Aside from the studies on the pricing, returns, and volatilities of the Crypto and NFT markets, researchers also conduct studies on the user sentiments towards the Crypto and NFT markets. One study indicated that investors had shown the opposite behavior toward investing in Bitcoins as opposed to investing in traditional financial products: they tend to enter the market and buy in Bitcoin when Bitcoin’s prices are exceptionally high and tend to not enter the market when Bitcoin prices are low, making lots of crypto investors losing money during the process [13]. People are still adjusting and familiarizing themselves with the all of sudden popular notions of Web3, NFTs, and metaverse [14]. The study conducted by Tuba and others on user sentiments on NFTs showed that monetary value is only one of the factors that impact user buying, holding, and liking of NFTs, and other factors include the uniqueness of NFTs, the artistic value, the technology newness, or simply because the idea of NFT is fun [15].
In spite of the burgeoning academic interest in Ethereum, Non-Fungible Tokens (NFTs), and their consequential implications on the digital economy, there remains a notable knowledge gap. Specifically, empirical investigations assessing the correlation between Ether's price dynamics and user behavior concerning NFTs traded on the Ethereum blockchain are limited. Given the increasing prominence of NFTs and the extensive utilization of Ether as a medium of exchange in these transactions, understanding this relationship could yield significant insights. Such a study would illuminate the behavioral nuances of participants in the NFT market and the potential influence of Ether's price volatility on these behaviors. Furthermore, it could offer a more granular understanding of the underlying mechanisms that drive the digital asset market. Closing this knowledge gap has significant academic worth and provides crucial insights that can be useful in policy-making, investment strategies, and developing blockchain technology.
3. Methodology
3.1. Data
This study employs a mixed-methods approach to investigate the relationship between the daily price fluctuations of Ether and the user trading activities of Non-Fungible Tokens (NFTs). For the former, we sourced a comprehensive dataset from the open-source platform Dune Analytics. This dataset provides daily price tracking data for Ether. R will be used to calculate the rolling volatilities of the Ether daily price.
To understand NFT trading activities, we utilized data from CryptoSlam, an open-source data aggregator known for its reliable and comprehensive data on NFT sales and transactions. CryptoSlam provides a broad array of metrics, including sales volume, user metrics, and top-selling NFT projects, enabling a robust examination of NFT trading behavior. NFT data on the unique buyers, unique sellers, and sales (USD) that occur on the Ethereum blockchain will be utilized as three variables for the regression analysis. All data will have a starting date of 2021-01-01 and an ending date of 2023-06-30.
Figure 1 displays the daily tracking of key variables used for this study. A few key macroeconomic trends could be identified from the graph that impacted the price of Ethereum as well as the trading activities of NFT. After the price of Ethereum reached a peak of over $4,000, the price of the token gradually went down as consumer confidence dwindled in the market and the crypto market cooled. This trend is less evident for NFT trading activities but still noticeable. The most rapid drops in Ethereum daily price and NFT sales volume occurred around June 2022, which is now recognized as the “June Crypto Crash” by the broader market.
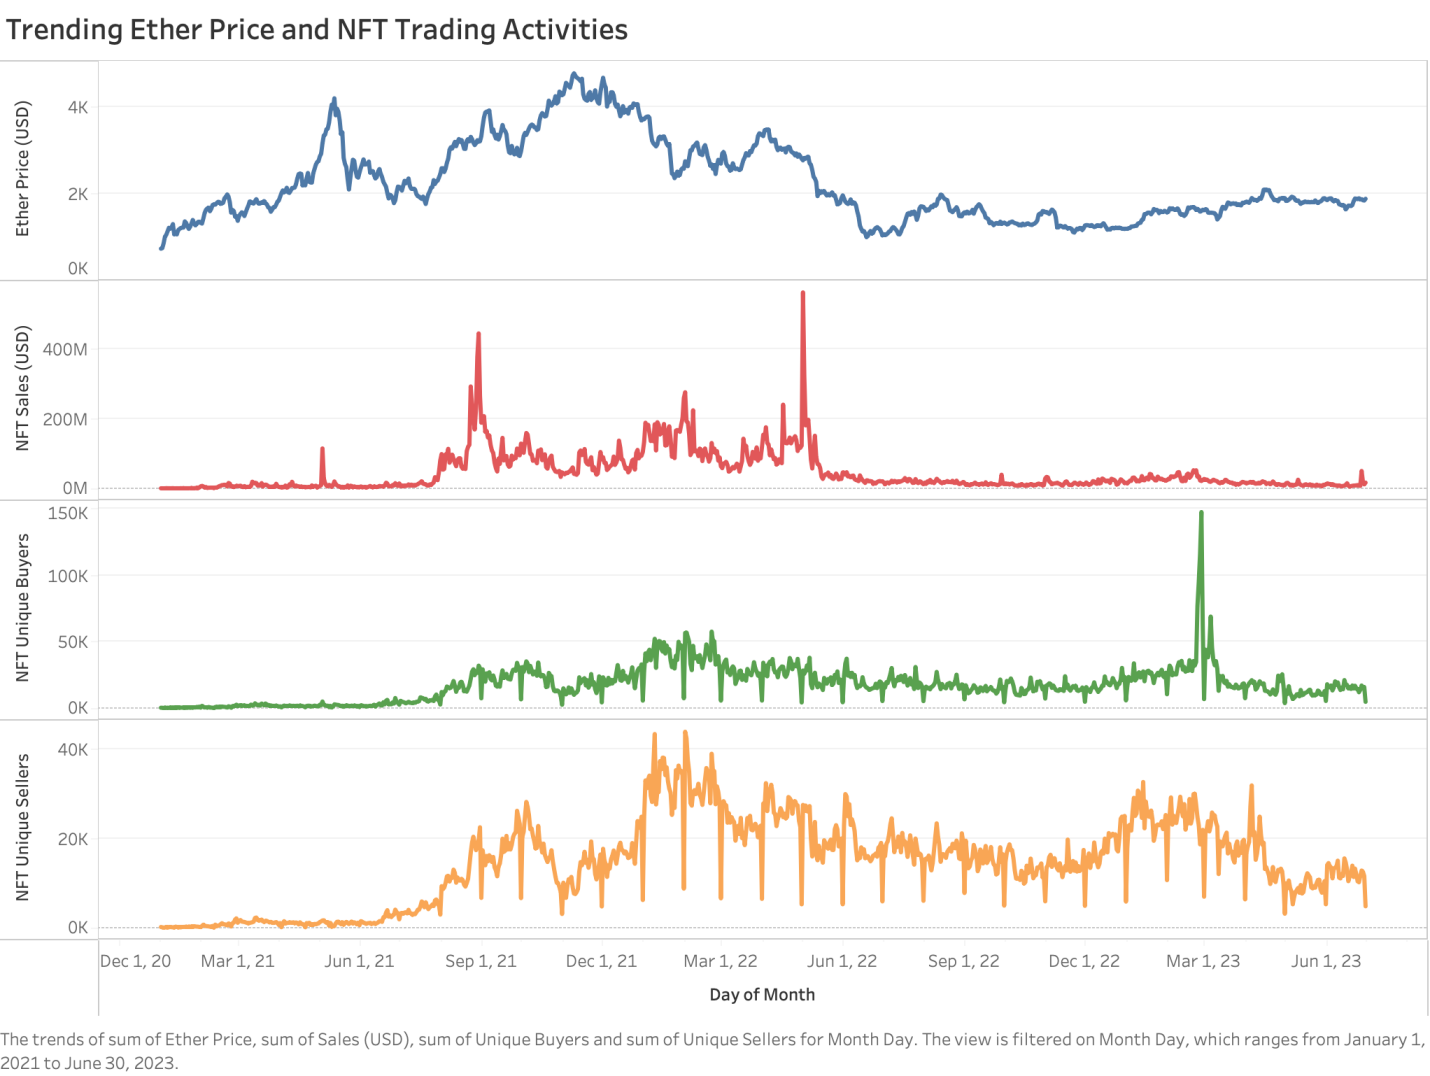
Figure 1: Trending line graph for Ethereum price, NFT sales, unique buyers, and unique sellers.
3.2. Method
The insights gleaned from Figure 1 provide valuable visual cues on the broader market trends of Ethereum price and NFT trading activities. As we observe the patterns and fluctuations in the graph, it becomes evident that there exists a complex interplay between the price movements of Ethereum and the trading volumes of NFTs. However, a more rigorous approach is required to delve deeper into understanding the underlying dynamics and statistical significance of these relationships.
This leads us to employ a robust statistical framework, comprising regression analysis and t-tests. By employing regression analysis, we seek to quantify the extent to which changes in Ethereum's price and its volatility impact the trading activities of NFTs. Additionally, we use t-tests to examine whether distinct periods of high and low Ethereum price and high and low volatility significantly influence NFT trading activity. By transitioning from the visual insights of Figure 1 to a statistical approach, we aim to unveil nuanced insights and establish empirical evidence that will contribute to a comprehensive understanding of the intricate relationship between Ethereum price, its volatility, and the vibrant world of Non-Fungible Tokens trading.
4. Results
First, Table 1 provides descriptive statistics on the data used for this study.
Table 1: Descriptive statistics on the data.
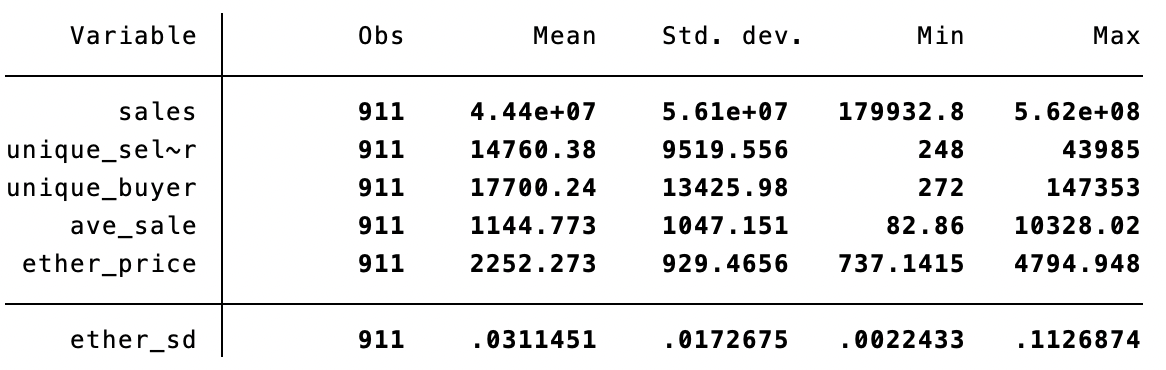
Table 1 reports the statistics of the relevant variable’s mean, standard deviation, minimum, and maximum values. The first four rows depict the sales, unique sellers, unique buyers, and average sales of NFT daily, while the last two rows show the daily price and the rolling volatilities of the Ethereum token, respectively.
In recognition of the fact that the price change and the price volatility could both have a substantial correlation to the NFT trading activities with the assumptions that investors tend to react to both the price of an underlying cryptocurrency and the degree of volatility of the underlying cryptocurrency when trading NFT assets, the multiple regression analysis will have Ethereum price (ether_price) and Ethereum rolling volatility (ether_sd). To ensure uniformity in the units of measurement, we took the natural logarithm of the dependent variables sales, unique seller, unique buyer, and average daily sales. In summary, the regression equations are:
\( ln\_sales{=β0 + β1 ether\_price + β2 ether\_sd } \) (1)
\( ln\_seller{=β0 + β1 ether\_price + β2 ether\_sd } \) (2)
\( ln\_buyer{=β0 + β1 ether\_price + β2 ether\_sd } \) (3)
\( ln\_ave\_sale{=β0 + β1 ether\_price + β2 ether\_sd } \) (4)
Table 2: Regression analysis of Ether price and volatility contribution on NFT trading activities.
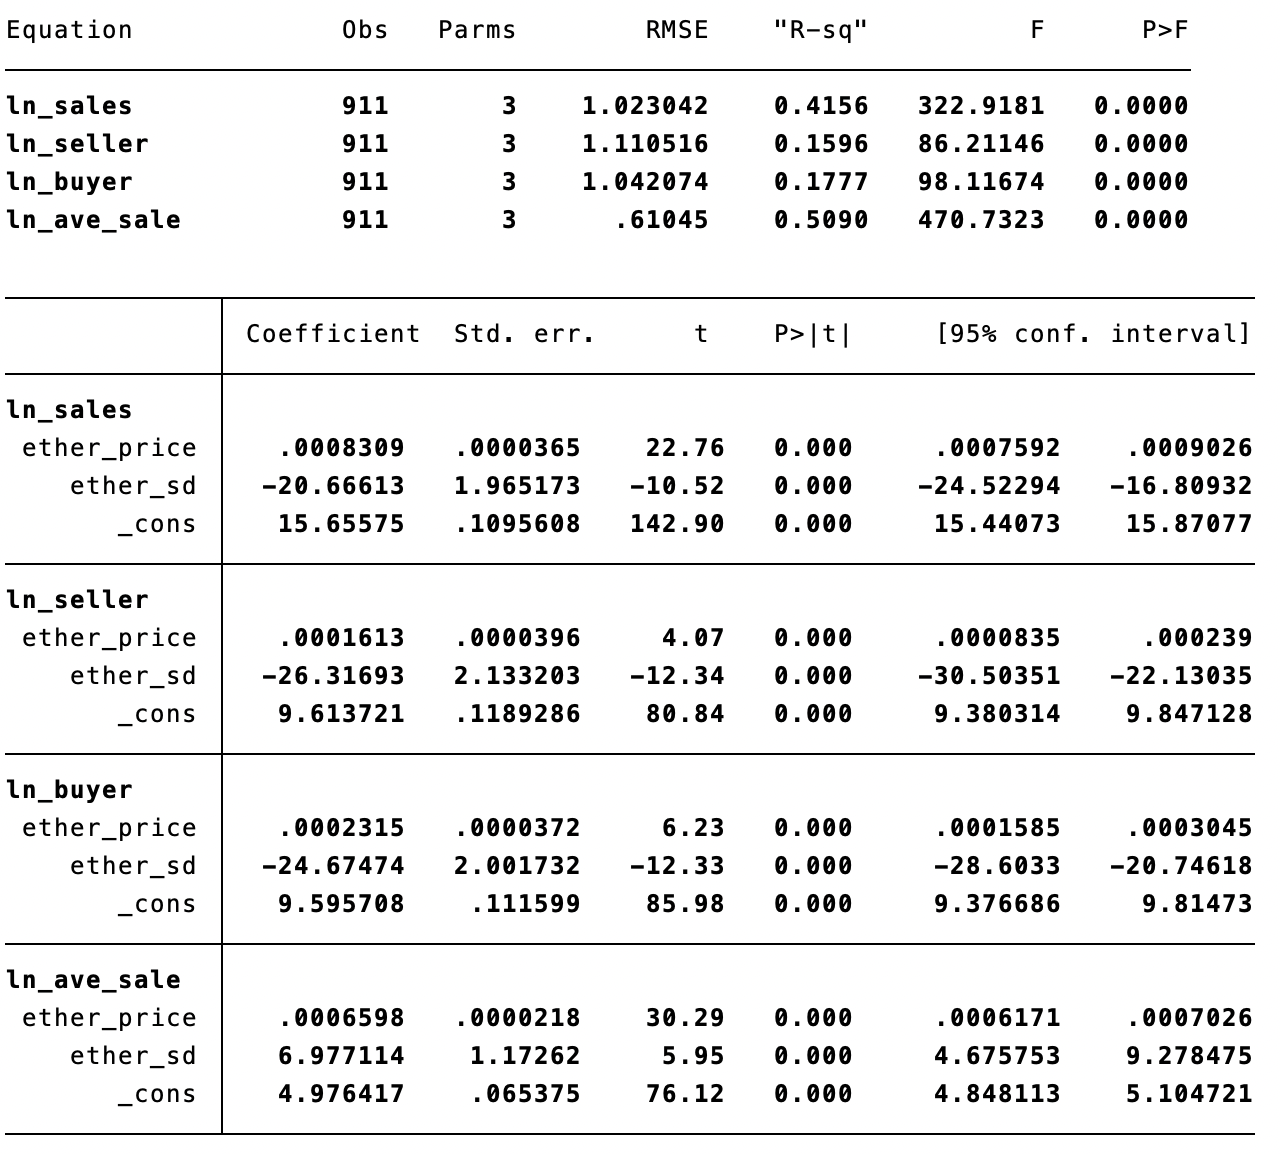
Table 2 displays the regression results and the estimated coefficients. In general, the regression findings indicate that there are significant positive correlations between the price of Ethereum and the variables that denote NFT trading activities. For a unit increase in the Ethereum price, the sales volume, unique sellers, unique buyers, and the average sales of NFTs (β1 > 0, p = 0.00) will increase by 0.083%, 0.016%, 0.023%, 0.065%, respectively. On the other hand, the relationship between Ethereum price volatility and the NFT trading activities appears significantly negative except for Ethereum price volatility’s effect on NFT average sales. This indicates that NFT investors react very strongly towards the volatility of the Ethereum price when making decisions to trade NFT. However, the opposite observation is derived for the Ethereum price volatility effect on NFT average sales amount. This can be further investigated with a t-test.
Building upon the regression analysis results presented in Table 1, we now turn our attention to the t-test analysis to further investigate the impact of distinct periods of high and low Ethereum price, as well as high and low Ethereum volatility, on NFT trading activities. By applying t-tests, we seek to explore whether these different market conditions significantly influence the variables denoting NFT trading activities. Specifically, we aim to compare the mean values of sales volume, unique sellers, unique buyers, and NFT average sales during periods of "high price" and "low price", as well as during periods of "high volatility" and "low volatility."
The t-test results presented in Appendix 1, Tables 3.1, 3.2, 4.1, 4.2, 5.1, 5.2, 6.1, and 6.2 provide valuable insights into the impact of both high and low Ethereum price and high and low Ethereum volatility on various NFT trading activities. Based on the t values and p values of the T-Tests, all NFT trading activities’ differences between high and low Ethereum prices and high and low Ethereum price volatilities are significant (p = 0.00), with an exception for the difference in mean average NFT sales during high and low Ethereum price volatilities (t = -0.425, p = 0.67). Some key findings are revealed by the T-tests.
During periods of high Ethereum price (group 1), there are substantial increases in sales volume, unique sellers, unique buyers, and average sales for NFT. This corresponds to the regression analysis where all coefficients for Ethereum price (ether_price) are positive, indicating a positive relationship between Ethereum price and NFT trading activeness. During periods of high Ethereum price volatilities (group 1), there are substantial decreases in sales volume, unique sellers and unique buyers for NFT. This also corresponds to the regression analysis where all coefficients for Ethereum price volatility (ether_sd) are negative, indicating a negative relationship between Ethereum price volatility and NFT trading activeness.
5. Discussion
The empirical analysis aimed to explore the relationship between the price and price volatility of Ethereum's native token Ether and the activities of users in the Non-Fungible Tokens (NFT) market. The regression analysis revealed significant positive correlations between the price of Ethereum and various NFT trading activities, including sales volume, unique sellers, unique buyers, and average sales of NFTs. Conversely, the relationship between Ethereum price volatility and NFT trading activities showed significant negative associations. NFT investors demonstrated strong sensitivity to the volatility of the Ethereum price when making trading decisions. Notably, there was an interesting observation that Ethereum price volatility did not significantly impact NFT average sales amount, warranting further investigation. Figures must appear inside the designated margins.
The t-test analysis further examined the impact of distinct periods of high and low Ethereum price and volatility on NFT trading activities. The t-test results confirmed the significance of differences in NFT trading activities between high and low Ethereum prices and high and low Ethereum price volatilities, except for the mean average NFT sales during high and low Ethereum price volatilities. This finding connects interestingly with Dowling’s finding that the price volatility of cryptocurrencies and the price of NFT have a neglectable connection (2022). In this study, the volatility of a specific type of cryptocurrency, Ethereum, impacts another factor of NFT, which is the trading activity.
The findings of this study directly address the research question by shedding light on the relationship between Ethereum's price, price volatility, and the trading activities in the NFT market on the Ethereum blockchain. These empirical findings provide strong evidence of the interconnectedness between Ethereum's dynamics and the vibrant NFT market, offering valuable insights for investors, traders, and policymakers seeking to navigate the rapidly evolving landscape of blockchain-based assets and decentralized markets.
Currently, there are no published studies on the relationship between Ether prices and NFT trading activeness. The findings of this study hold significant implications for both researchers and stakeholders in the NFT market. The price of Ethereum and NFT trading activities are connected, suggesting that Ethereum's price fluctuations influence market participants' behaviors. Therefore, investors and traders should keep a close eye on the movements of Ethereum's price, as it can serve as an indicator of heightened trading activity within the NFT market. On the other hand, the negative relationship between Ethereum price volatility and NFT trading activities suggests that heightened price volatility may lead to reduced trading activities, potentially due to increased market uncertainties and risk aversion among investors. Understanding this relationship can help NFT market participants strategize their trading decisions during periods of price instability.
The NFT market is influenced by Ethereum's dynamics and by broader market sentiment and external events. Market sentiment, investor psychology, and media coverage can significantly impact NFT trading behaviors. Furthermore, significant events such as regulatory changes, technological advancements, or major cryptocurrency market movements may drive shifts in NFT trading activities independently of Ethereum's price and volatility.
6. Conclusion
To summarize, the primary aim of this research was to investigate the relationship between the price of the Ethereum token and Non-Fungible Token (NFT) trading activities on the Ethereum blockchain. To achieve this, the study employed regression analysis and t-tests to explore how changes in Ethereum's price and price volatility influence NFT trading behaviors.
The key findings of the research provided valuable insights into the dynamics of the NFT market in relation to Ethereum's price and volatility. The regression analysis revealed significant positive correlations between Ethereum's price and various NFT trading variables, indicating that an increase in Ethereum's price positively impacts sales volume, unique sellers, unique buyers, and average sales of NFTs. Conversely, Ethereum's price volatility demonstrated significant negative associations with NFT trading activities, suggesting that market uncertainty and risk aversion influence investors' decisions.
These findings are directly relevant to the research question and objectives of this study, as they shed light on the interplay between Ethereum's dynamics and NFT trading activities. The results underscore the importance of Ethereum's price as a driver of NFT market activeness, while also highlighting the impact of price volatility on investor behaviors. This knowledge can be valuable for practitioners, investors, and traders in the NFT market, as it can inform decision-making strategies and provide insights into market trends.
Despite the valuable findings, this study has several limitations that should be acknowledged. The regression analysis identified correlations between Ethereum's dynamics and NFT trading activities. However, as with any observational study, causation cannot be definitively established, and other unobserved factors might drive these relationships. Secondly, the analysis might be subject to selection bias, as the data may include only specific NFT projects, platforms, or user groups. Different NFT ecosystems may have varying sensitivities to Ethereum's dynamics. For example, the behavior of NFT users may be influenced by blockchain and platform-specific features and user engagement strategies. Although this paper mainly focused on the NFT trading activities that happened in the Ethereum blockchain, other blockchains, such as Solana and Polygon, may attract distinct user communities with varying preferences and objectives, leading to differences in trading activities. Future studies can build upon this research by adopting a longitudinal approach, including additional control variables, and conducting qualitative research to gain deeper insights into user perspectives. Exploring the impact of external events and cross-currency comparisons could also enhance understanding of the dynamic NFT market.
The implications of this research extend to various stakeholders in the NFT ecosystem. Investors and traders can leverage the knowledge gained to make informed decisions and navigate the evolving market landscape. Policymakers can utilize these insights to implement measures that promote market stability and growth. Furthermore, future researchers can build upon this study's findings by addressing the identified limitations and exploring other dimensions of the relationship between the Ethereum's price and NFT trading activities.
In conclusion, this research contributes valuable empirical evidence to the understanding of the relationship between Ethereum's price and NFT trading activities. The findings provide critical guidance for stakeholders and offer another step for further exploration in the dynamic world of blockchain-based assets and decentralized markets. As the NFT market continues to evolve, ongoing research in this area will play a vital role in shaping the future of this emerging and transformative space.
References
[1]. NFT Trade Volume by Chain. (2023, July 2). https://www.theblock.co/data/nft-non-fungible-tokens/nft-overview
[2]. Maouchi, Y., Charfeddine, L., & El Montasser, G. (2021). Understanding digital bubbles amidst the COVID-19 pandemic: Evidence from DeFi and NFTs. Finance Research Letters, 102584. https://doi.org/10.1016/j.frl.2021.102584
[3]. Corbet, S., Meegan, A., Larkin, C., Lucey, B., & Yarovaya, L. (2018). Exploring the dynamic relationships between cryptocurrencies and other financial assets. Economics Letters, 165, 28–34. https://doi.org/10.1016/j.econlet.2018.01.004
[4]. Akhtaruzzaman, M., Sensoy, A., & Corbet, S. (2019). The influence of Bitcoin on portfolio diversification and design. Finance Research Letters, 37, 101344. https://doi.org/10.1016/j.frl.2019.101344
[5]. Baur, D. G., Hong, K., & Lee, A. D. (2018). Bitcoin: Medium of exchange or speculative assets? Journal of International Financial Markets, Institutions and Money, 54(1), 177–189. https://doi.org/10.1016/j.intfin.2017.12.004
[6]. Koutmos, D. (2018). Return and volatility spillovers among cryptocurrencies. Economics Letters, 173, 122–127. https://doi.org/10.1016/j.econlet.2018.10.004
[7]. Balcilar, M., Bouri, E., Gupta, R., & Roubaud, D. (2017). Can volume predict Bitcoin returns and volatility? A quantiles-based approach. Economic Modelling, 64, 74–81. https://doi.org/10.1016/j.econmod.2017.03.019
[8]. Bouri, E., Lau, C. K. M., Lucey, B., & Roubaud, D. (2019). Trading volume and the predictability of return and volatility in the cryptocurrency market. Finance Research Letters, 29, 340–346. https://doi.org/10.1016/j.frl.2018.08.015
[9]. Dowling, M. (2021). Is non-fungible token pricing driven by cryptocurrencies? Finance Research Letters, 44(102097), 102097. https://doi.org/10.1016/j.frl.2021.102097
[10]. Dowling, M. (2021). Fertile LAND: Pricing non-fungible tokens. Finance Research Letters, 44, 102096. https://doi.org/10.1016/j.frl.2021.102096
[11]. Gunay, S., & Kaskaloglu, K. (2022). Does utilizing smart contracts induce a financial connectedness between Ethereum and non-fungible tokens? Research in International Business and Finance, 63, 101773. https://doi.org/10.1016/j.ribaf.2022.101773
[12]. Kumar, A. S., & Steven Raj Padakandla. (2023). Do NFTs act as a good hedge and safe haven against Cryptocurrency fluctuations? 104131–104131. https://doi.org/10.1016/j.frl.2023.104131
[13]. Auer, R., Cornelli, G., Doerr, S., Frost, J., & Gambacorta, L. (2022). Crypto trading and Bitcoin prices: evidence from a new database of retail adoption. Www.bis.org. https://www.bis.org/publ/work1049.htm
[14]. Belk, R., Humayun, M., & Brouard, M. (2022). Money, possessions, and ownership in the Metaverse: NFTs, cryptocurrencies, Web3 and Wild Markets. Journal of Business Research, 153, 198–205. https://doi.org/10.1016/j.jbusres.2022.08.031
[15]. Yilmaz, T., Sofie Sagfossen, & Velasco, C. (2023). What makes NFTs valuable to consumers? Perceived value drivers associated with NFTs liking, purchasing, and holding. 165, 114056–114056. https://doi.org/10.1016/j.jbusres.2023.114056
Cite this article
Zhang,S. (2023). Price of Ethereum Token Effect on the Non-Fungible Token User Trading Activities in the 2020s. Advances in Economics, Management and Political Sciences,54,122-134.
Data availability
The datasets used and/or analyzed during the current study will be available from the authors upon reasonable request.
Disclaimer/Publisher's Note
The statements, opinions and data contained in all publications are solely those of the individual author(s) and contributor(s) and not of EWA Publishing and/or the editor(s). EWA Publishing and/or the editor(s) disclaim responsibility for any injury to people or property resulting from any ideas, methods, instructions or products referred to in the content.
About volume
Volume title: Proceedings of the 2nd International Conference on Financial Technology and Business Analysis
© 2024 by the author(s). Licensee EWA Publishing, Oxford, UK. This article is an open access article distributed under the terms and
conditions of the Creative Commons Attribution (CC BY) license. Authors who
publish this series agree to the following terms:
1. Authors retain copyright and grant the series right of first publication with the work simultaneously licensed under a Creative Commons
Attribution License that allows others to share the work with an acknowledgment of the work's authorship and initial publication in this
series.
2. Authors are able to enter into separate, additional contractual arrangements for the non-exclusive distribution of the series's published
version of the work (e.g., post it to an institutional repository or publish it in a book), with an acknowledgment of its initial
publication in this series.
3. Authors are permitted and encouraged to post their work online (e.g., in institutional repositories or on their website) prior to and
during the submission process, as it can lead to productive exchanges, as well as earlier and greater citation of published work (See
Open access policy for details).
References
[1]. NFT Trade Volume by Chain. (2023, July 2). https://www.theblock.co/data/nft-non-fungible-tokens/nft-overview
[2]. Maouchi, Y., Charfeddine, L., & El Montasser, G. (2021). Understanding digital bubbles amidst the COVID-19 pandemic: Evidence from DeFi and NFTs. Finance Research Letters, 102584. https://doi.org/10.1016/j.frl.2021.102584
[3]. Corbet, S., Meegan, A., Larkin, C., Lucey, B., & Yarovaya, L. (2018). Exploring the dynamic relationships between cryptocurrencies and other financial assets. Economics Letters, 165, 28–34. https://doi.org/10.1016/j.econlet.2018.01.004
[4]. Akhtaruzzaman, M., Sensoy, A., & Corbet, S. (2019). The influence of Bitcoin on portfolio diversification and design. Finance Research Letters, 37, 101344. https://doi.org/10.1016/j.frl.2019.101344
[5]. Baur, D. G., Hong, K., & Lee, A. D. (2018). Bitcoin: Medium of exchange or speculative assets? Journal of International Financial Markets, Institutions and Money, 54(1), 177–189. https://doi.org/10.1016/j.intfin.2017.12.004
[6]. Koutmos, D. (2018). Return and volatility spillovers among cryptocurrencies. Economics Letters, 173, 122–127. https://doi.org/10.1016/j.econlet.2018.10.004
[7]. Balcilar, M., Bouri, E., Gupta, R., & Roubaud, D. (2017). Can volume predict Bitcoin returns and volatility? A quantiles-based approach. Economic Modelling, 64, 74–81. https://doi.org/10.1016/j.econmod.2017.03.019
[8]. Bouri, E., Lau, C. K. M., Lucey, B., & Roubaud, D. (2019). Trading volume and the predictability of return and volatility in the cryptocurrency market. Finance Research Letters, 29, 340–346. https://doi.org/10.1016/j.frl.2018.08.015
[9]. Dowling, M. (2021). Is non-fungible token pricing driven by cryptocurrencies? Finance Research Letters, 44(102097), 102097. https://doi.org/10.1016/j.frl.2021.102097
[10]. Dowling, M. (2021). Fertile LAND: Pricing non-fungible tokens. Finance Research Letters, 44, 102096. https://doi.org/10.1016/j.frl.2021.102096
[11]. Gunay, S., & Kaskaloglu, K. (2022). Does utilizing smart contracts induce a financial connectedness between Ethereum and non-fungible tokens? Research in International Business and Finance, 63, 101773. https://doi.org/10.1016/j.ribaf.2022.101773
[12]. Kumar, A. S., & Steven Raj Padakandla. (2023). Do NFTs act as a good hedge and safe haven against Cryptocurrency fluctuations? 104131–104131. https://doi.org/10.1016/j.frl.2023.104131
[13]. Auer, R., Cornelli, G., Doerr, S., Frost, J., & Gambacorta, L. (2022). Crypto trading and Bitcoin prices: evidence from a new database of retail adoption. Www.bis.org. https://www.bis.org/publ/work1049.htm
[14]. Belk, R., Humayun, M., & Brouard, M. (2022). Money, possessions, and ownership in the Metaverse: NFTs, cryptocurrencies, Web3 and Wild Markets. Journal of Business Research, 153, 198–205. https://doi.org/10.1016/j.jbusres.2022.08.031
[15]. Yilmaz, T., Sofie Sagfossen, & Velasco, C. (2023). What makes NFTs valuable to consumers? Perceived value drivers associated with NFTs liking, purchasing, and holding. 165, 114056–114056. https://doi.org/10.1016/j.jbusres.2023.114056