


1. Introduction
In today’s world, an important index to measure the economy is the unemployment rate. China and India, which are two of the biggest developing countries in the world, grab every opportunity to grow their economy. By understanding, analyzing, and forecasting the unemployment rates of two countries, we can have a good understanding of their economic history and future trends, which is essential in today’s globalized society. In fact, with their excessive economy growth, they also meet different kinds of challenges, for example, the problem of young people being unemployed upon graduation, the problem of an aging population, showing that various factors are affecting unemployment rate. In the past, these two countries’ historical trends in unemployment rates reveal fluctuations influenced by economic cycles, policy changes, and external shocks. India’s unemployment rates have shown variations due to shifts in sectors like agriculture, while China’s rates have responded to changes in manufacturing and export dynamics. The covid-19 epidemic that started in 2019 has also caused the unemployment rate to soar. Both India and China have implemented labor market policies to address unemployment. India’s “Make in India” initiative and China’s focus on innovation and consumption-led growth reflect their unique approaches.
Although scholars have established various models to study the unemployment rate from various perspectives, there will still be areas that can be added and improved. For example, if the panel threshold regression model (Liang et al.) is used, since the true data-generating process does not adhere to the threshold model assumption, the estimates might be biased or inefficient.
This article uses the ARIMA model to predict the unemployment rates of China and India in the next ten years, to compare and contrast the future economic trends of the two countries. By giving detailed graphs and explaining results of the model, this article will provide a comprehensive interpretation of unemployment rates in future 10 years to make policy recommendations to developing countries, so as to help people in these countries to clarify their future development choices and to avoid risks in today’s competitive society. Therefore, we can promote sustainable and inclusive economic growth in both countries, and correspondingly, the whole world.
The rest of the paper is divided into: 2. Literature review 3. Methodlogy 4. Results 5. Discussion 6. Conclusion. The Literature review part introduced several journals that give more comprehensive understanding of this topic. Methodology part helps people know the Arima model and the data recourses. Results part listed the results of Arima model, and the explanation of the results is given in the Discussion part. Conclusion part gave suggestions to policymakers and researchers.
2. Literature Review
In their respective studies, Feng and Guo (2021) delve into the intricacies of China’s labor market, focusing on the influence of state-owned enterprises (SOEs) on labor mobility and equilibrium [1]. Through an equilibrium search and matching framework, they uncover the distinctive role of SOEs in shaping labor dynamics, underlining the higher bargaining power of SOE workers stemming from institutional disparities. The study highlights the productivity gap between state and private sectors, shedding light on how SOE reforms impact labor mobility and reduce unemployment duration. Huang et al. (2020) contribute to the discourse on China’s informal economies by investigating their causes and dynamics [2]. Engaging with multiple theoretical perspectives, they emphasize the need to integrate informal economies into urbanization theories and advocate for a comprehensive approach to understand and address this phenomenon.
Liang et al. (2023) offer insights into the regional impacts of aging populations on economic development across Chinese regions [3]. Utilizing panel data and a panel threshold regression model, they reveal varied effects of aging on economic growth based on trade balances and unemployment rates. This underscores the necessity for tailored policies to harness positive impacts, contributing to informed regional policy-making. Yan (2010) examines the expansion of domestic demand for foreign-investment enterprises in China, emphasizing the multifaceted nature of such expansion [4]. The study underscores the role of financial policies and tax reforms, suggesting strategies for foreign-investment enterprises to align with government-supported industries.
Shifting focus, the study “An Exercise in Cross-Validation of Data on Employment and Unemployment” by Inamdar validates employment and unemployment data across sources [5]. It showcases the utility of pilot time use surveys for capturing workforce estimates often missed by traditional NSSO surveys. The study highlights the significance of validation techniques for comprehensive employment trend analysis. In “Regional Patterns and Determinants of Commuting between Rural and Urban India,” Vasavi Bhatt et al. explore rural-urban commuting trends, providing insights into worker mobility patterns and their determinants [6]. Their study complements migration-centric literature and emphasizes the role of commuting in shaping rural-urban dynamics.
In the realm of technological advancement, “Artificial Intelligence and Labor Productivity Paradox” by Jamielyn Bonsay et al. investigates the impact of AI on economies, questioning whether it could surpass human labor in driving growth [7]. By examining AI’s influence on economic growth in China, India, Japan, and Singapore, the study contributes to the discourse on technological unemployment and its implications. Lastly, Geethu J.A. and Sajini B. Nair’s study on “ELDERLY DEPENDENCY in INDIA: FINDINGS from CENSUS DATA” examines the challenges posed by an aging population [8]. Through analyzing census data, the study explores the dynamics of elderly dependency, highlighting its consequences for population structure and economic development.
In summary, these studies collectively enrich our understanding of various economic dimensions in China and India. Addressing labor market dynamics, informal economies, demographic shifts, and the impact of AI, these works offer multifaceted insights into the complexities of these economies. From labor mobility to the challenges of an aging society, these studies provide valuable guidance for policymakers, researchers, and businesses navigating the evolving economic landscapes of these countries.
3. Methodology
3.1. Data
Just as Figure1 shows, to compare the India and China unemployment rate, we will first analyze the past 20 years trend and then use Arima model to forecast the next 10 years unemployment rate.
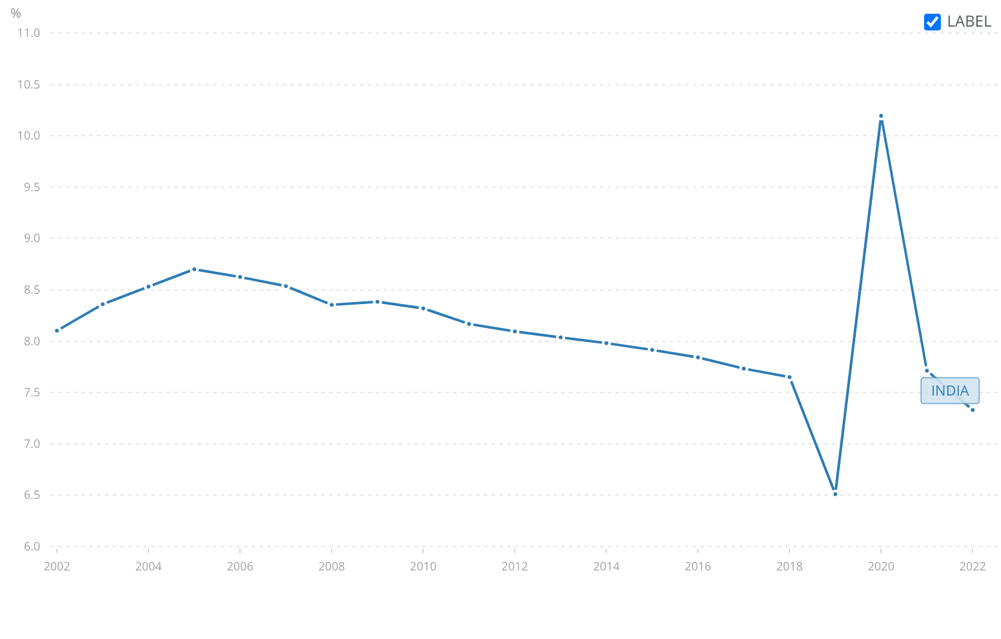
Figure 1: India Unemployment Rate In the Past 20 Years.
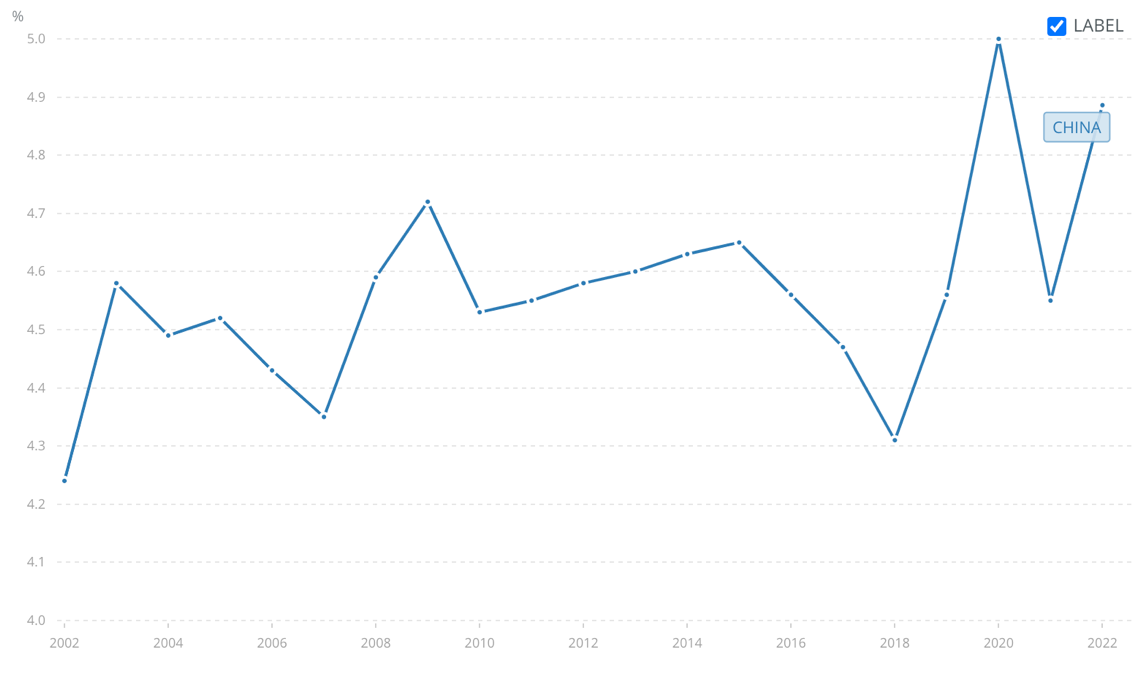
Figure 2: China Unemployment Rate In the Past 20 Years.
From Figure1 and Figure2, we could see that although both countries did not show a clear trend, China, in past 20 years, experienced a more tumultuous economic situation. Despite the COVID-19 pandemic period, which starts from 2019 and lasts until now, India unemployment rate keeps decreasing during 2005 to 2019, compared to the fluctuating China unemployment rate.
There are many factors affecting China’s high and low unemployment rate in the past few years. The Asian financial crisis triggered by the U.S. subprime mortgage crisis in 2008 has greatly changed the form of foreign investment in China, and in recent years, with the tense international situation, the competition between foreign companies and Chinese state-owned enterprises has become more and more intense. The low labor dynamics of China’s SOEs in the face of the brain drain from foreign companies has led to a high rate of long-term unemployment. Besides, the problem of aging also become worse. In short term, China is still in the early stage of aging, and the Chinese government has extended the retirement age, so the unemployment rate was low at the beginning [9]. However, in the long run, China unemployment rate remains unabated.
India started liberalizing its economy in the 1990s and a large number of foreign entities entered the economy, providing a large number of jobs in India. India also liberalized from family planning, and a large number of laborers flooded the market. However, with the economic development, many problems have been exposed, and in the past 20 years, the gap between the rich and the poor in India has worsened. In fact, with the economic development, many problems have been exposed, for example, in the past 20 years, India’s wealth gap has worsened this is due to the market does not have enough high-paying occupations to match the massive labor force. What’s worse, the failure of the education system makes employers often think that education are worthless, leading to the Indian labor force to accept higher education will continue to be low, but also worsened the country’s high unemployment rate. At the same time, India is highly dependent on indirect taxes, and many ordinary people have to pay taxes on everyday consumer goods and services [10].
Use 20-point type for the title, aligned to the center, linespace exactly at 20-point with a bold.
3.2. Model
ARIMA model is valuable tool for time series forecasting. The ARIMA model focuses on identifying the autoregressive and moving average patterns in the data. It’s based on the idea of differencing the data to achieve stationarity, estimating autoregressive and moving average terms, and then integrating them back to the original data.
For both countries, we extracted the data and selected the data from 1991 to 2022 as the database for forecasting. We selected December 2019 as the end date for the training data. Data after January 2020 is selected as the start date for the test data. All these data come from The World Bank, an international financial institution. It provides a wide range of economic and social indicators, such as reliable and up-to-date information on unemployment rates [11].
First, we use the Dickey-Fuller unit root test to check for stationarity. We got the p-value for India unemployment rate is 0.0004865, much less than 0.5, which proves that the data is stationary. In other words, since our data is already stationary based on the Dickey-Fuller test and we didn’t need to perform differencing (d = 0). Then, By using a loop to iterate through different combinations of p and q, we can fit ARIMA models with those parameters, and then select the model with the lowest AIC and BIC values. For the India unemployment rate, p=2 and q=2.
For China unemployment rate, since p-value=0.054>0.05, it is not stationary. We use differential process and get d=1. Then we get to know p=1 and q=0.
4. Results
4.1. India
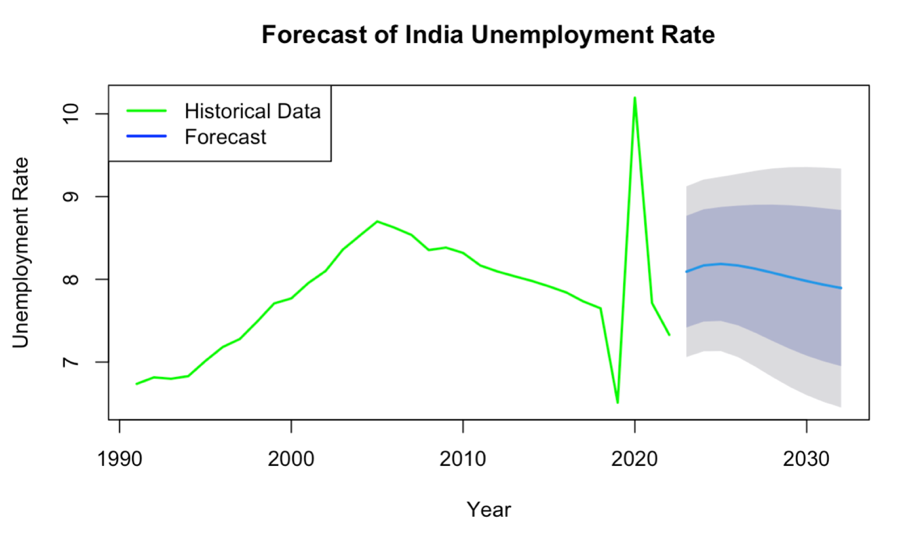
Figure 3: India Unemployment Rate Forecast In the Future 10 Years.
Just as figure3 shows, the ARIMA model with orders (p, d, q) = (2, 0, 2) represents the following:
• p=2: This is the order of the autoregressive (AR) component of the model. It indicates the number of lagged values of the dependent variable (unemployment rate in this case) that are included in the model to predict the current value. In your case, the model includes the unemployment rates from two previous time points.
• d=0: This is the order of differencing applied to the time series data. In your model, d=0 indicates that no differencing is needed. This means that the original data is stationary and does not require any transformations to achieve stationarity.
• q=2: This is the order of the moving average (MA) component of the model. It represents the number of lagged forecast errors (residuals) that are included in the model to predict the current value. In your case, the model includes the residuals from two previous time points.
• So, in summary, the ARIMA model (2, 0, 2) for forecasting the unemployment rate in India means that it uses the most recent two lagged values of the unemployment rate, no differencing, and the most recent two lagged forecast errors to predict the future values of the unemployment rate.
4.2. China
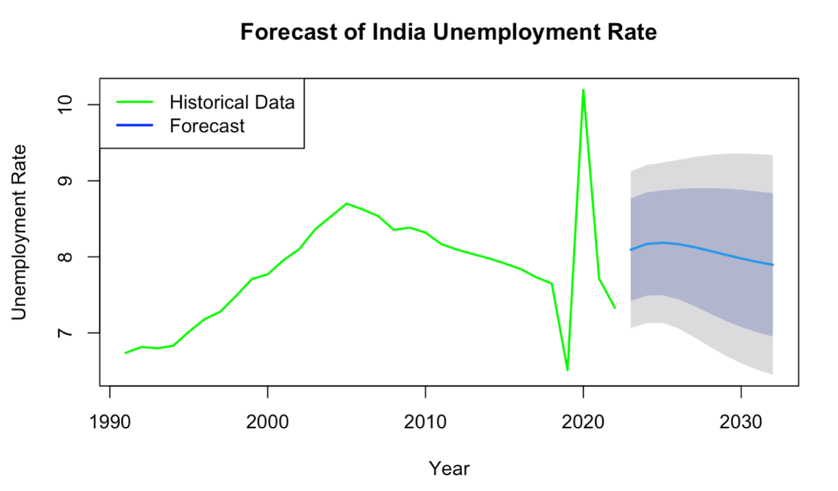
Figure 4: India Unemployment Rate Forecast In the Future 10 Years.
As we can see in Figure 4 that the ARIMA model with orders (p, d, q) = (2, 0, 2) represents the following:
• p=2: This is the order of the autoregressive (AR) component of the model. It indicates the number of lagged values of the dependent variable (unemployment rate in this case) that are included in the model to predict the current value. In your case, the model includes the unemployment rates from two previous time points.
• d=0: This is the order of differencing applied to the time series data. In your model, d=0 indicates that no differencing is needed. This means that the original data is stationary and does not require any transformations to achieve stationarity.
• q=2: This is the order of the moving average (MA) component of the model. It represents the number of lagged forecast errors (residuals) that are included in the model to predict the current value. In your case, the model includes the residuals from two previous time points.
• So, in summary, the ARIMA model (2, 0, 2) for forecasting the unemployment rate in India means that it uses the most recent two lagged values of the unemployment rate, no differencing, and the most recent two lagged forecast errors to predict the future values of the unemployment rate.
5. Discussion
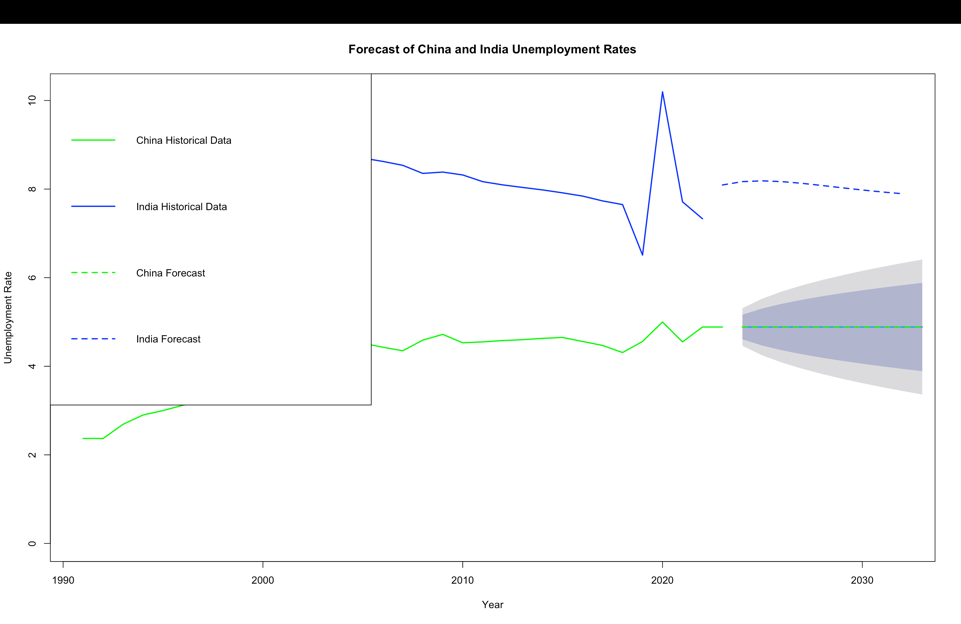
Figure 5: India VS China Unemployment Rate Forecast In the Future 10 Years.
According to Figure5, we could see that at some point about the same time, both India and China have faced significant changes in unemployment rates. Notably, from 2005 to 2019, India’s unemployment rate exhibited a decreasing trend. This decrease can be attributed to various factors, including economic liberalization in the 1990s, which attracted foreign entities and generated job opportunities [12]. China’s unemployment rate, on the other hand, exhibited a more tumultuous pattern over the past two decades. For both countries, they all dealt with the Asian financial crisis of 2008, triggered by the U.S. subprime mortgage crisis, which reshaped the landscape of foreign investment and led to the increase of unemployment rate. More recently, Covid-19 also caused significant increases in unemployment in both countries in 2019.
For the forecast part, we could see that China remains the same as the current number, indicating that government policies and economic conditions are expected to remain relatively unchanged over the forecast period. It may also imply that the status of China economy is close to equilibrium in future 10 years, where labor demand and supply are balanced [13]. This could suggest that the labor market is well-functioning and that there are no major shocks or disruptions expected to affect employment.
By contrast, India future unemployment rate shows small fluctuations. Although it first increases a little and then decreases, it still keeps a moderate trend. The fluctuations could be influenced by the health problems caused by Covid-19, the artificial intelligence, the tensioned protectionist trade policies, etc [14]. In today’s world, it is not only India’s own policies and demographics that will affect the unemployment rate, but the tense global economic situation will also greatly affect the unemployment rate.
6. Conclusion
In conclusion, this study reveals the intricate relationship between economic trends and unemployment rates in two major developing economies, namely, China and India.
China’s unemployment rate is expected to remain stable, which may indicate a well-functioning labor market and balanced economic conditions. China’s current broad policy direction can remain intact and continue.
On the other hand, India’s unemployment rate is expected to show moderate fluctuations. Reacting to the fact that the current policies are still not enough to sustain the economy. The demographic and labor force structure needs further improvement.
The findings of the study highlight the need for a combination of factors, including domestic policies, demographic changes and global economic dynamics, in addressing the challenges of unemployment. As both countries strive to achieve sustainable economic growth, policymakers must adopt a multifaceted strategy to deal with the changing nature of the labor market.
To mitigate the challenges posed by unemployment and promote sustainable growth, China and India could consider a range of policy measures. In China, a focus on increasing labor market flexibility and encouraging innovation-driven industries could facilitate the integration of skilled workers, thereby potentially reducing long-term unemployment. In addition, continued efforts to adapt to an aging population and promote the mobility of skilled labor could help maintain labor market balance. In India, policies to close the gap between education and employment, promote inclusive economic growth, and support industries that match emerging technologies could make the labor force more dynamic and adaptable. Both countries are likely to benefit from collaborative efforts that capitalize on each other’s strengths and experiences to address common challenges and build a stable foundation for sustainable economic development.
References
[1]. Feng, Shuaizhang, and Naijia Guo. “Labor Market Dynamics in Urban China and the Role of the State Sector.” Journal of Comparative Economics, vol. 49, no. 4, Dec. 2021, pp. 918–32, https://doi.org/10.1016/j.jce.2021.04.002. Accessed 22 Aug. 2023.
[2]. Huang, Gengzhi, et al. “Integrating Theories on Informal Economies: An Examination of Causes of Urban Informal Economies in China.” Sustainability, vol. 12, no. 7, Mar. 2020, p. 2738, https://doi.org/10.3390/su12072738.
[3]. Liang, Yifan, et al. “Regional Impact of Aging Population on Economic Development in China: Evidence from Panel Threshold Regression (PTR).” PLOS ONE, edited by Wajid Khan, vol. 18, no. 3, Mar. 2023, p. e0282913, https://doi.org/10.1371/journal.pone.0282913.
[4]. Yan, Dazhu. “Influences and Countermeasures of the Policies Expanding Domestic Demand for Foreign-Investment Enterprises.” International Journal of Business and Management, vol. 5, no. 11, Oct. 2010, https://doi.org/10.5539/ijbm.v5n11p199. Accessed 30 Aug. 2020.
[5]. NIRAD, Inamdar. “An Exercise in Cross-Validation of Data on Employment and Unemployment.” Annals of Dunarea de Jos University of Galati. Fascicle I. Economics and Applied Informatics, vol. 25, no. 3, Dec. 2019, pp. 72–84, https://doi.org/10.35219/eai1584040957.
[6]. Bhatt, Vasavi, et al. “Regional Patterns and Determinants of Commuting between Rural and Urban India.” The Indian Journal of Labour Economics, vol. 63, no. 4, Oct. 2020, pp. 1041–63,
[7]. https://doi.org/10.1007/s41027-020-00276-9. Accessed 25 Sept. 2021.
[8]. Bonsay, Jamielyn, et al. “Artificial Intelligence and Labor Productivity Paradox: The Economic Impact of AI in China, India, Japan, and Singapore.” Journal of Economics, Finance and Accounting Studies, vol. 3, no. 2, Nov. 2021, pp. 120–39, https://doi.org/10.32996/jefas.2021.3.2.13. Accessed 8 Feb. 2022.
[9]. J.A, Geethu., and Sajini B. Nair. “ELDERLY DEPENDENCY in INDIA: FINDINGS from CENSUS DATA.” International Journal of Advanced Research, vol. 9, no. 08, Aug. 2021, pp. 279–92, https://doi.org/10.21474/ijar01/13262. Accessed 15 May 2022.
[10]. Ajami, Riad A. “Economic Challenges and Adjustments for the Asia-Pacific Region: COVID-19 and Beyond.” Journal of Asia-Pacific Business, vol. 21, no. 3, June 2020, pp. 1–4, https://doi.org/10.1080/10599231.2020.1783970. Accessed 21 July 2020.
[11]. Bildirici, Melike E. “The Relationship between Cement Production, Mortality Rate, Air Quality, and Economic Growth for China, India, Brazil, Turkey, and the USA: MScBVAR and MScBGC Analysis.” Environmental Science and Pollution Research, vol. 27, no. 2, Nov. 2019, pp. 2248–63, https://doi.org/10.1007/s11356-019-06586-w. Accessed 15 Feb. 2022.
[12]. The World Bank. “Unemployment, Total (% of Total Labor Force) (Modeled ILO Estimate) - China | Data.” Data.worldbank.org, 2022, data.worldbank.org/indicator/SL.UEM.TOTL.ZS?locations=CN. Accessed 25 Apr. 2023.
[13]. ---. “Unemployment, Total (% of Total Labor Force) (Modeled ILO Estimate) - India | Data.” Data.worldbank.org, data.worldbank.org/indicator/SL.UEM.TOTL.ZS?locations=IN. Accessed 25 Apr. 2023.
[14]. “Unemployment in India Lower than in China and Asia Pacific, Says Minister Quoting ILO Report.” The Economic Times, 3 July 2019, economictimes.indiatimes.com/news/economy/indicators/unemployment-in-india-lower-than-in-china-and-asia-pacific-says-minister-quoting-ilo-report/articleshow/70059015.cms. Accessed 7 Aug. 2023.
Cite this article
Peng,Y. (2023). Comparative Analysis of Unemployment Rates Between China and India. Advances in Economics, Management and Political Sciences,54,140-147.
Data availability
The datasets used and/or analyzed during the current study will be available from the authors upon reasonable request.
Disclaimer/Publisher's Note
The statements, opinions and data contained in all publications are solely those of the individual author(s) and contributor(s) and not of EWA Publishing and/or the editor(s). EWA Publishing and/or the editor(s) disclaim responsibility for any injury to people or property resulting from any ideas, methods, instructions or products referred to in the content.
About volume
Volume title: Proceedings of the 2nd International Conference on Financial Technology and Business Analysis
© 2024 by the author(s). Licensee EWA Publishing, Oxford, UK. This article is an open access article distributed under the terms and
conditions of the Creative Commons Attribution (CC BY) license. Authors who
publish this series agree to the following terms:
1. Authors retain copyright and grant the series right of first publication with the work simultaneously licensed under a Creative Commons
Attribution License that allows others to share the work with an acknowledgment of the work's authorship and initial publication in this
series.
2. Authors are able to enter into separate, additional contractual arrangements for the non-exclusive distribution of the series's published
version of the work (e.g., post it to an institutional repository or publish it in a book), with an acknowledgment of its initial
publication in this series.
3. Authors are permitted and encouraged to post their work online (e.g., in institutional repositories or on their website) prior to and
during the submission process, as it can lead to productive exchanges, as well as earlier and greater citation of published work (See
Open access policy for details).
References
[1]. Feng, Shuaizhang, and Naijia Guo. “Labor Market Dynamics in Urban China and the Role of the State Sector.” Journal of Comparative Economics, vol. 49, no. 4, Dec. 2021, pp. 918–32, https://doi.org/10.1016/j.jce.2021.04.002. Accessed 22 Aug. 2023.
[2]. Huang, Gengzhi, et al. “Integrating Theories on Informal Economies: An Examination of Causes of Urban Informal Economies in China.” Sustainability, vol. 12, no. 7, Mar. 2020, p. 2738, https://doi.org/10.3390/su12072738.
[3]. Liang, Yifan, et al. “Regional Impact of Aging Population on Economic Development in China: Evidence from Panel Threshold Regression (PTR).” PLOS ONE, edited by Wajid Khan, vol. 18, no. 3, Mar. 2023, p. e0282913, https://doi.org/10.1371/journal.pone.0282913.
[4]. Yan, Dazhu. “Influences and Countermeasures of the Policies Expanding Domestic Demand for Foreign-Investment Enterprises.” International Journal of Business and Management, vol. 5, no. 11, Oct. 2010, https://doi.org/10.5539/ijbm.v5n11p199. Accessed 30 Aug. 2020.
[5]. NIRAD, Inamdar. “An Exercise in Cross-Validation of Data on Employment and Unemployment.” Annals of Dunarea de Jos University of Galati. Fascicle I. Economics and Applied Informatics, vol. 25, no. 3, Dec. 2019, pp. 72–84, https://doi.org/10.35219/eai1584040957.
[6]. Bhatt, Vasavi, et al. “Regional Patterns and Determinants of Commuting between Rural and Urban India.” The Indian Journal of Labour Economics, vol. 63, no. 4, Oct. 2020, pp. 1041–63,
[7]. https://doi.org/10.1007/s41027-020-00276-9. Accessed 25 Sept. 2021.
[8]. Bonsay, Jamielyn, et al. “Artificial Intelligence and Labor Productivity Paradox: The Economic Impact of AI in China, India, Japan, and Singapore.” Journal of Economics, Finance and Accounting Studies, vol. 3, no. 2, Nov. 2021, pp. 120–39, https://doi.org/10.32996/jefas.2021.3.2.13. Accessed 8 Feb. 2022.
[9]. J.A, Geethu., and Sajini B. Nair. “ELDERLY DEPENDENCY in INDIA: FINDINGS from CENSUS DATA.” International Journal of Advanced Research, vol. 9, no. 08, Aug. 2021, pp. 279–92, https://doi.org/10.21474/ijar01/13262. Accessed 15 May 2022.
[10]. Ajami, Riad A. “Economic Challenges and Adjustments for the Asia-Pacific Region: COVID-19 and Beyond.” Journal of Asia-Pacific Business, vol. 21, no. 3, June 2020, pp. 1–4, https://doi.org/10.1080/10599231.2020.1783970. Accessed 21 July 2020.
[11]. Bildirici, Melike E. “The Relationship between Cement Production, Mortality Rate, Air Quality, and Economic Growth for China, India, Brazil, Turkey, and the USA: MScBVAR and MScBGC Analysis.” Environmental Science and Pollution Research, vol. 27, no. 2, Nov. 2019, pp. 2248–63, https://doi.org/10.1007/s11356-019-06586-w. Accessed 15 Feb. 2022.
[12]. The World Bank. “Unemployment, Total (% of Total Labor Force) (Modeled ILO Estimate) - China | Data.” Data.worldbank.org, 2022, data.worldbank.org/indicator/SL.UEM.TOTL.ZS?locations=CN. Accessed 25 Apr. 2023.
[13]. ---. “Unemployment, Total (% of Total Labor Force) (Modeled ILO Estimate) - India | Data.” Data.worldbank.org, data.worldbank.org/indicator/SL.UEM.TOTL.ZS?locations=IN. Accessed 25 Apr. 2023.
[14]. “Unemployment in India Lower than in China and Asia Pacific, Says Minister Quoting ILO Report.” The Economic Times, 3 July 2019, economictimes.indiatimes.com/news/economy/indicators/unemployment-in-india-lower-than-in-china-and-asia-pacific-says-minister-quoting-ilo-report/articleshow/70059015.cms. Accessed 7 Aug. 2023.