


1. Introduction
The research on stock price prediction is of great significance to investors and practitioners in the financial industry. People want to model stock prices correctly so that, as stock buyers, they can rely on stock price prediction to make wise decisions about buying, selling, or holding stocks. Accurate forecasting helps optimize a portfolio and may lead to higher returns. At the same time, accurate share price forecasting helps manage risk by providing insight into potential price movements. Investors can adjust strategies and positions to mitigate potential losses from market volatility. Therefore, the issue of stock forecasting is very important. Nevertheless, predictions must be made with a realistic understanding of their limitations and potential risks, as financial markets are subject to many factors, many of which are unpredictable or influenced by human behavior. This inherent complexity makes accurate predictions challenging.
Numerous prior research endeavors have employed machine learning methodologies for the purpose of forecasting stock values. These methodologies encompass a range of models such as linear regression [1], autoregressive integral moving average (ARIMA) [2], random forest [3], decision tree [4], support vector machine (SVM) [5], and others. However, previous investigations still appear to be limited. Given the rapid development of machine learning methods, this paper selects the historical data of the four companies with the largest market value in the U.S. stock market from 2013 to 2023 and uses KNN and LSTM models to forecast the data of these four companies.
2. Data
This article uses data from Yahoo Finance and selects the closing prices of the four largest U.S. stocks (Google, Apple, Microsoft, Amazon) from 2013 to 2023, a total of 2,517 data pieces. Closing prices reflect the sentiment and decisions of stock market traders throughout the trading day. It involves a collective assessment of the value of a stock by buyers and sellers. Some basic information of the assets is shown in the following Figure 1 and Figure 2.
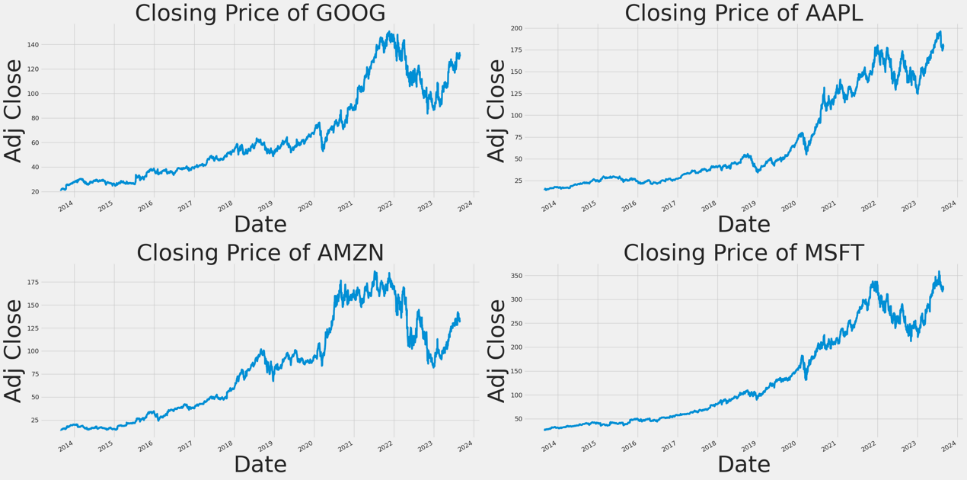
Figure 1: Ten-year price fluctuations of each stock.
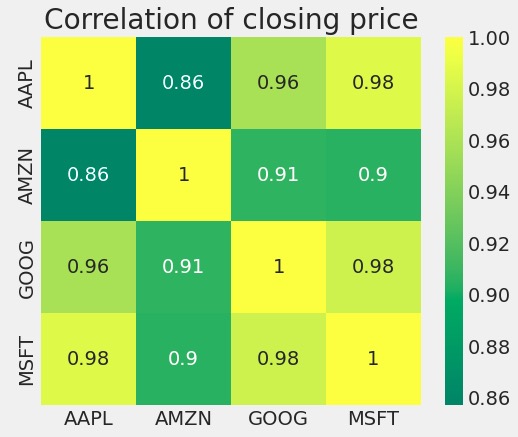
Figure 2: The correlation of each stock.
From Figure 1, we can see how the closing prices of these four companies have fluctuated over ten years. Furthermore, Figure 2 shows that they have a strong similarity.
3. Methodology
This paper mainly uses KNN and LSTM to forecast the closing prices of Google, Apple, Microsoft, and Amazon from 2013 to 2023. T The predictive performance is evaluated by computing the RMSE between the predicted and actual values.
3.1. KNN
K-Nearest Neighbors (KNN) model is based on classification and regression. KNN is an algorithm used in machine learning for classification and regression tasks [6]. The K-nearest Neighbors algorithm operates under the assumption that a training dataset is provided, containing instances labeled with their respective categories. During the process of classification, the prediction of a new instance is determined by a majority voting approach, wherein the category assigned to the instance is based on the categories of its K Nearest Neighbors. KNN focuses on local patterns in data and can adapt to changing market conditions and capture changes in trends, making them suitable for specific dynamic market environments. In financial markets, short-term trends and patterns can often be effectively captured using local methods.
The KNN algorithm utilizes a distance metric to quantify the similarity between two points in the sample space. A smaller distance indicates a higher degree of similarity, while a larger distance indicates a lower degree of similarity. Three distances that are frequently employed in many fields of study are the Manhattan distance, the Euclidean distance, and the Minkowski distance (See Figure 3).
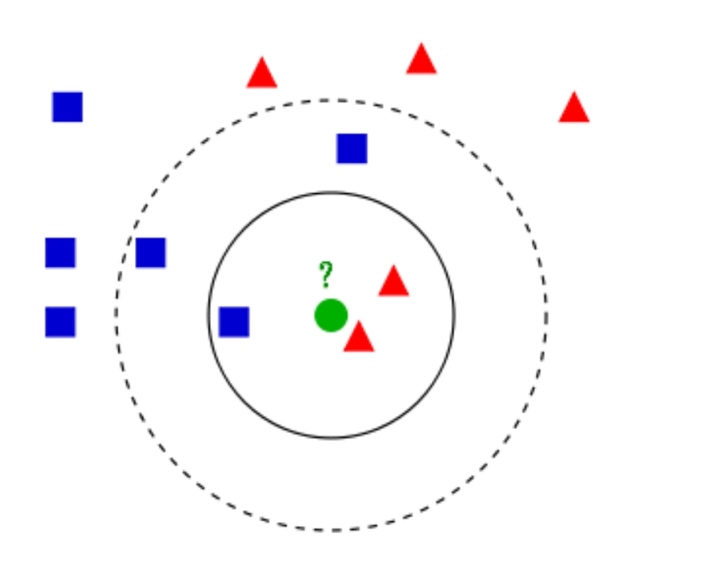
Figure 3: KNN model.
First, the data set is separated from the feature variables (“ High,” “Low,” “Open,” “Volume”) to X and the target variable (“ Close “) to y. A TimeSeriesSplit object is then defined, the feature variables in the training and test sets are standardized using StandardScaler, and two splits perform time series cross-validation. Hyperparameter tuning is performed using cross-validation, with the number of neighbors (K) as the hyperparameter, and the errors (mean square errors) for different K values are plotted to help find the best K value. The selection of the K value in the KNN algorithm, being the sole one-bit hyperparameter, significantly influences the ultimate prediction outcome of the algorithm in an intuitive and consequential manner. After that, GridSearchCV is used to find the best K value from the range of values (1,150). This K value is then used to create the best_knn model and fit the best_knn model on the scaled training data. The optimal solution prediction function is used to predict our scaling data. The best_knn model was used to plot the test data’s actual and predicted closing prices. Calculating the RMSE is part of the performance evaluation of a model.
3.2. LSTM
LSTM is a recurrent neural network (RNN) model. RNNs are an artificial neural network type expressly designed to process sequential data. Particularly effective in occupations requiring the manipulation of sequences, such as time series data, voice, and natural language, as well as related tasks [7]. It is specifically designed to capture long-term dependencies in sequential data. They can remember patterns and relationships in data over long periods, which is crucial for understanding complex stock price trends. Stock price data typically exhibit variable time lags between different events and movements. LSTM can naturally handle these irregular time intervals and capture dependencies on different time scales. LSTM is widely regarded by professionals as the algorithm with the highest potential for stock prediction. The system possesses the capability to handle both discrete data points and intricate data sequences, rendering it suitable for analyzing non-linear time series data and forecasting significant price movements characterized by high volatility [8].
Creating a sequential model that permits the linear stacking of neural network layers is the first stage in developing an LSTM model. Then, three LSTM layers are added to the Sequential model. Each LSTM layer contains 50 neurons. The output of the first two LSTM layers is a suitable sequence for the subsequent LSTM layer. The output of the third layer LSTM is a single value suitable for input to the next layer. After each LSTM layer, add the Dropout layer with a Dropout rate of 0.2 to prevent the model from overfitting. Using the relu activation function, add a dense layer, also known as the entirely connected layer with 1 neuron. The dense layer serves as the model’s output layer and outputs the anticipated stock price. After the model’s structure has been defined, the model is compiled. The loss function was selected as Mean Squared Error, the optimizer as Adam, and the evaluation index as Mean Absolute Percentage Error. Finally, the model is trained by fitting method, training data and target are input, validation data is set, 10 training epochs are set, batch size is 32, and training process is printed (See Figure 4).
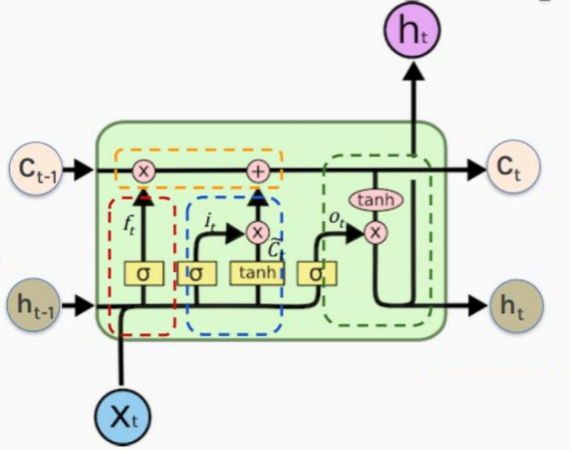
Figure 4: LSTM model structure.
3.3. RMSE
RMSE is widely utilized as an evaluation metric for regression tasks because to its ability to assess the proximity between predictions and actual values on average, while also providing insights into the impact of significant errors. Significant inaccuracies will affect the outcome of RMSE [9]. When applied to predicting stocks, RMSE can be used to quantify the degree to which a forecasting model’s forecast matches a stock’s actual price movement in a specific time period. The performance of its forecasting model can be evaluated by comparing the predicted stock price with the actual price using RMSE. A large RMSE shows that the model’s predictions and the real values are very different from each other. When the RMSE is small, on the other hand, the correlation between the price predicted by the model and the real price is stronger, which means the model is more accurate. If the model has an extremely low RMSE on the training data, the model may perform very well. Overfitted models demonstrate high performance when evaluated on the training data but exhibit poor performance when tested on fresh or unseen data. Therefore, the constructed model lacks practical utility [10]. RMSE is calculated as follows.
\( RMSE=\sqrt[]{\frac{\sum _{k=1}^{n}{({actual_{1}}-{predicted_{1}})^{2}}+…+{({actual_{n}}+{predicted_{n}})^{2}}}{n}} \) (1)
4. Results
4.1. KNN
Using cross-validation to perform hyperparameter tuning, taking the number of neighbors (K) as the hyperparameter, the errors (mean square errors) of different K values are plotted. GridSearchCV is used to find the best K value of AAPL is 52, GOOG is 51, and AMZN is 60 from the range of values (1,150). The optimal K value of MSFT is 147. Then, the best_knn model is created using these K values, and the best_knn model is fitted on the scaled training data and the actual and predicted closing prices of the test data are plotted using the best_knn model. Lastly, the efficacy of the model is evaluated by calculating the RMSE. Based on this KNN model, the RMSE of AAPL is 21.2507, the RMSE of GOOG is 5.4037, the RMSE of AMZN is 6.3037, and the RMSE of MSFT is 44.6457 (Details are shown in the following Figures 5-8).
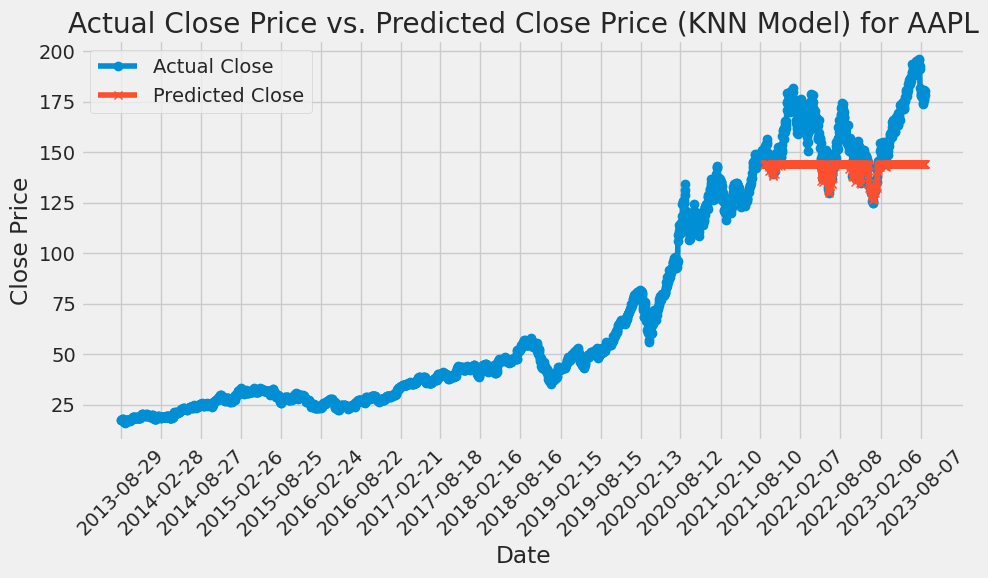
Figure 5: KNN is used to predict the price of AAPL stock.
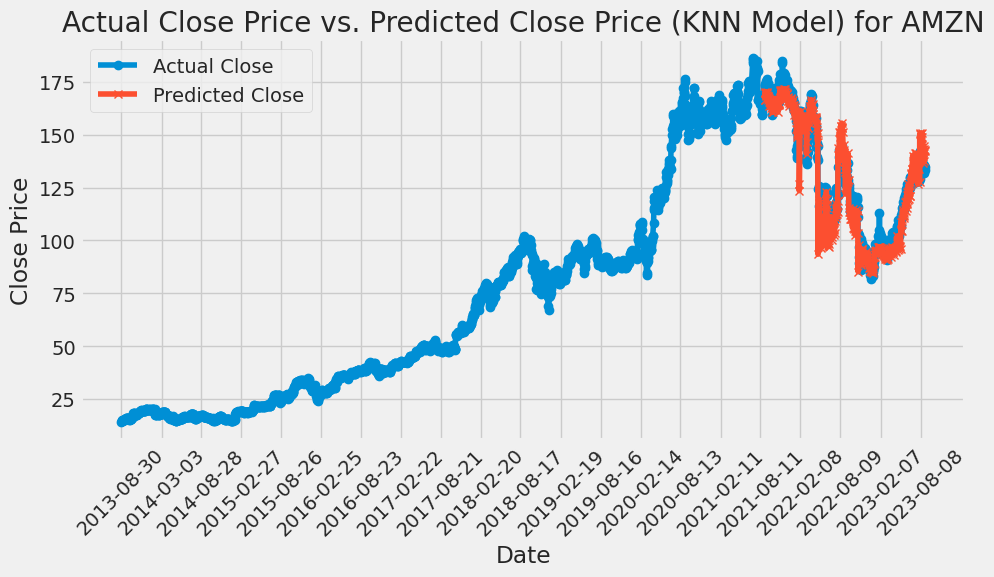
Figure 6: KNN is used to predict the price of AMZN stock.
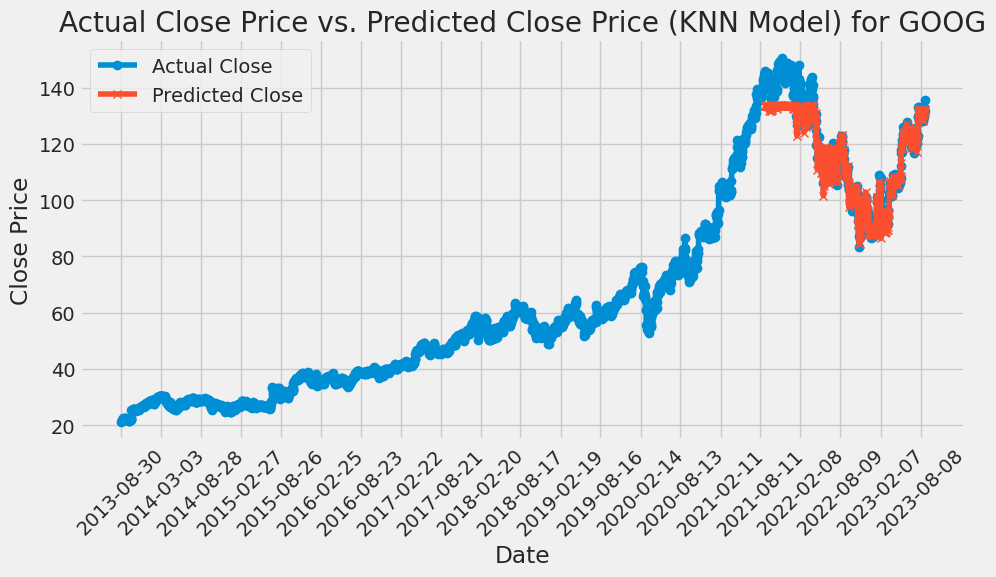
Figure 7: KNN is used to predict the price of GOOG stock.
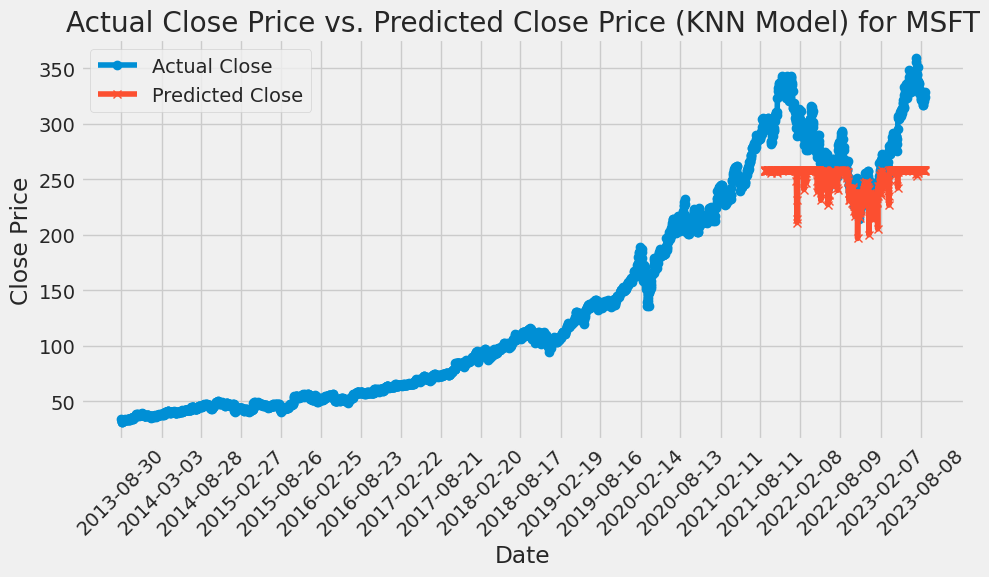
Figure 8: KNN is used to predict the price of MSFT stock.
4.2. LSTM
A sequential model is created that allows for linear stacking of neural network layers. Add three LSTM layers to the Sequential model. Each LSTM layer contains 50 neurons. The output of the first two LSTM layers is a sequence suitable for input into the next LSTM layer. The output of the third layer LSTM is a solitary value that is suitable for use as input to the subsequent layer. After each LSTM layer, add the Dropout layer with a Dropout rate of 0.2 to prevent the model from overfitting. Then, add a dense layer, which has one neuron. The dense layer serves as the final layer of the model and generates the forecasted stock price. Once the structure of the model has been established, the model undergoes the process of compilation. The loss function was selected as Mean Squared Error, the optimizer as Adam, and the evaluation index as Mean Absolute Percentage Error. Finally, the model is trained by fitting method, training data and target are input, validation data is set, ten training epochs are set, the batch size is 32, and the training process is printed. Lastly, the trained model is then used to forecast the time series data, and the accuracy of the prediction is determined by calculating the RMSE. The RMSE of AAPL is 9.7359 of GOOG, is 4.8965 of AMZN is 6.6956, and of MSFT is 10.3862 (Details are shown in the following Figures 9-12).
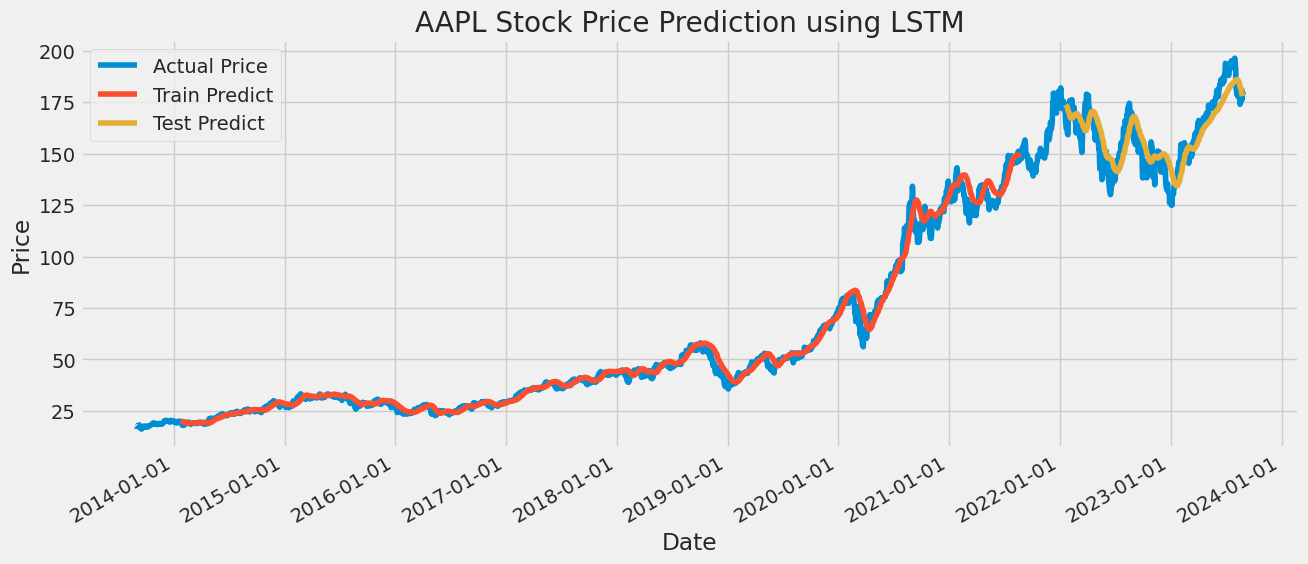
Figure 9: LSTM is used to predict the price of AAPL stock.
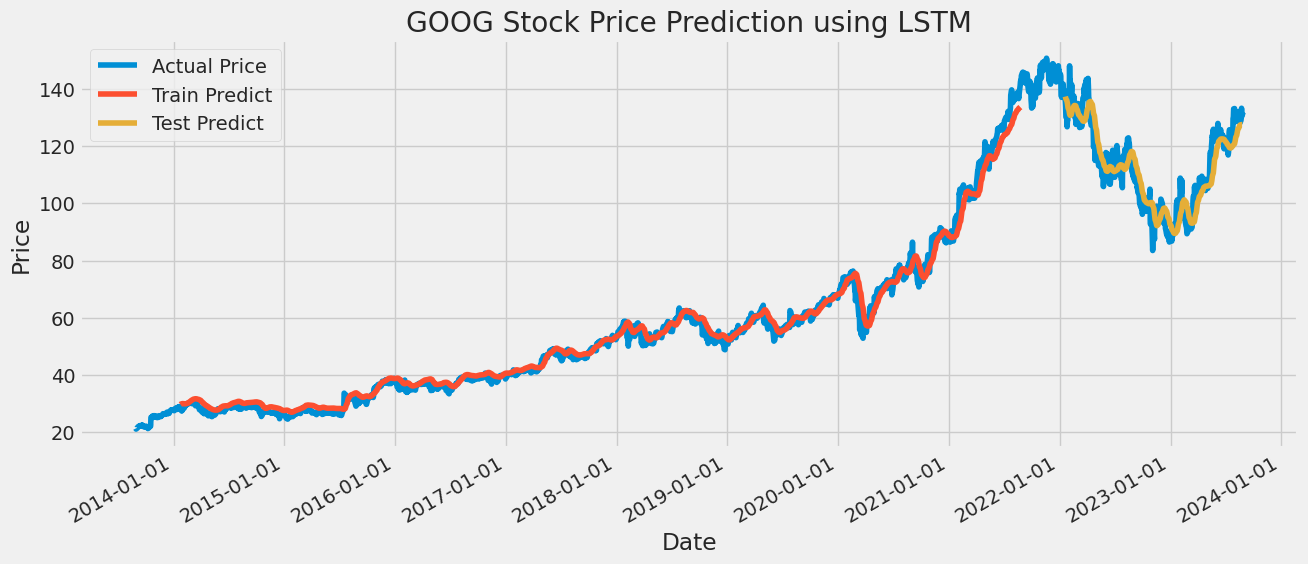
Figure 10: LSTM is used to predict the price of GOOG stock.
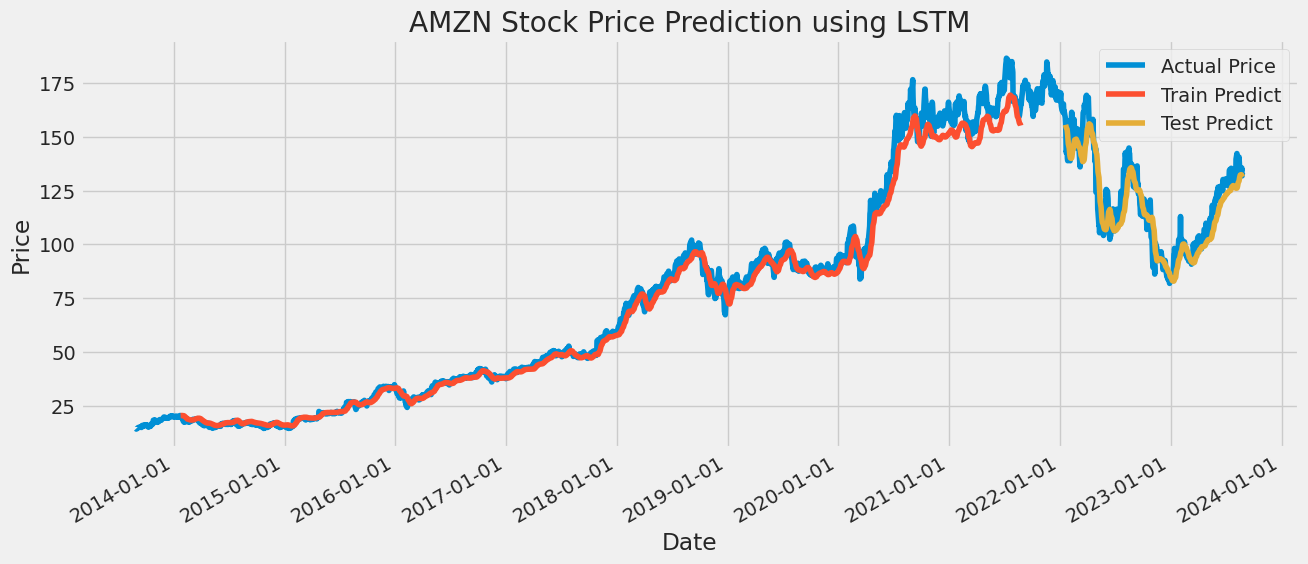
Figure 11: LSTM is used to predict the price of AMZN stock.

Figure 12: LSTM is used to predict the price of MSFT stock.
4.3. RMSE
As demonstrated in the Table 1 below, the RMSE of the LSTM model is very stable because it predicts AAPL, GOOG, and MSFT with fewer errors than the KNN model. However, the KNN model is only marginally more accurate than the LSTM model when predicting AMZN price.
Table 1.
Table 1: RMSE of KNN and LSTM for the four assets.
RMSE | KNN | LSTM |
AAPL | 21.2507 | 9.7359 |
GOOG | 5.4037 | 4.8965 |
AMZN | 6.3037 | 6.6956 |
MSFT | 44.6457 | 10.3862 |
5. Conclusion
Stock prediction plays a very important role for stock traders. Based on the actual stock data of AAPL, GOOG, AMZN, and MSFT from 2013 to 2023, this paper uses KNN and LSTM models to predict the exact closing price of stocks in the future, which can be used to further evaluate the rise and fall of stocks. The prediction effect is good, and all four companies show an upward trend. Upon doing a comparative analysis between the two models, it has been observed that the LSTM model exhibits a smaller and more consistent error in comparison to the KNN model. This paper argues that LSTM can capture the crucial time dependencies and relationships in financial time series data. Financial markets are influenced by historical trends, news events, and other time-sensitive factors that KNN may have difficulty capturing effectively, which makes the LSTM model very much a stock price forecasting model.
References
[1]. Rishi, T. (2022). Stock Market Analysis Using Linear Regression. In Proceedings of the Jepson Undergraduate Conference on International Economics, 4.
[2]. Loukas, S. (2020). Time-Series Forecasting: Predicting Stock Prices Using An LSTM Model. Retrieved from https://towardsdatascience. com/lstm-time-series-forecasting-predicting-stock-prices-using-an-lstm-model-6223e9644a2f.
[3]. Sadorsky, P. (2021). A random forests approach to predicting clean energy stock prices. Journal of Risk and Financial Management, 14(2), 48.
[4]. Li, R., Ma, M., and Tang, N. (2023). Stock Price Prediction Based on Decision Trees, CNN and LSTM. In Proceedings of the 4th International Conference on Economic Management and Model Engineering, ICEMME 2022, November 18-20, 2022, Nanjing, China.
[5]. Nti, I. K., Adekoya, A. F., and Weyori, B. A. (2020). Efficient Stock-Market Prediction using ensemble support Vector machine. Open Computer Science, 10(1), 153–163.
[6]. Sonkavde, G., Dharrao, D. S., Bongale, A. M., Deokate, S. T., Doreswamy, D., and Bhat, S. K. (2023). Forecasting Stock Market Prices Using Machine Learning and Deep Learning Models: A Systematic Review, Performance Analysis and Discussion of Implications. International Journal of Financial Studies, 11(3), 94.
[7]. Biswal, A. (2023). Power of Recurrent Neural Networks (RNN): revolutionizing AI. Retrieved from https://www.simplilearn.com/tutorials/deep-learning-tutorial/rnn
[8]. Gülen, K. (2023). Stock Prediction In Machine Learning Explained - Dataconomy. Retrieved from https://dataconomy.com/2023/01/11/stock-prediction-machine-learning/
[9]. Ogunbiyi, I. A. (2022). Top evaluation Metrics for regression problems in Machine Learning. Retrieved from https://www.freecodecamp.org/news/evaluation-metrics-for-regression-problems-machine-learning/
[10]. Shah, R. (2022). Performance comparison of regularized and unregularized regression models. Retrieved from https://www.analyticsvidhya.com/blog/2021/08/performance-comparision-of-regularized-and-unregularized-regression-models/
Cite this article
Chen,Z. (2023). Stock Price Forecasts Based on KNN and LSTM. Advances in Economics, Management and Political Sciences,56,70-77.
Data availability
The datasets used and/or analyzed during the current study will be available from the authors upon reasonable request.
Disclaimer/Publisher's Note
The statements, opinions and data contained in all publications are solely those of the individual author(s) and contributor(s) and not of EWA Publishing and/or the editor(s). EWA Publishing and/or the editor(s) disclaim responsibility for any injury to people or property resulting from any ideas, methods, instructions or products referred to in the content.
About volume
Volume title: Proceedings of the 2nd International Conference on Financial Technology and Business Analysis
© 2024 by the author(s). Licensee EWA Publishing, Oxford, UK. This article is an open access article distributed under the terms and
conditions of the Creative Commons Attribution (CC BY) license. Authors who
publish this series agree to the following terms:
1. Authors retain copyright and grant the series right of first publication with the work simultaneously licensed under a Creative Commons
Attribution License that allows others to share the work with an acknowledgment of the work's authorship and initial publication in this
series.
2. Authors are able to enter into separate, additional contractual arrangements for the non-exclusive distribution of the series's published
version of the work (e.g., post it to an institutional repository or publish it in a book), with an acknowledgment of its initial
publication in this series.
3. Authors are permitted and encouraged to post their work online (e.g., in institutional repositories or on their website) prior to and
during the submission process, as it can lead to productive exchanges, as well as earlier and greater citation of published work (See
Open access policy for details).
References
[1]. Rishi, T. (2022). Stock Market Analysis Using Linear Regression. In Proceedings of the Jepson Undergraduate Conference on International Economics, 4.
[2]. Loukas, S. (2020). Time-Series Forecasting: Predicting Stock Prices Using An LSTM Model. Retrieved from https://towardsdatascience. com/lstm-time-series-forecasting-predicting-stock-prices-using-an-lstm-model-6223e9644a2f.
[3]. Sadorsky, P. (2021). A random forests approach to predicting clean energy stock prices. Journal of Risk and Financial Management, 14(2), 48.
[4]. Li, R., Ma, M., and Tang, N. (2023). Stock Price Prediction Based on Decision Trees, CNN and LSTM. In Proceedings of the 4th International Conference on Economic Management and Model Engineering, ICEMME 2022, November 18-20, 2022, Nanjing, China.
[5]. Nti, I. K., Adekoya, A. F., and Weyori, B. A. (2020). Efficient Stock-Market Prediction using ensemble support Vector machine. Open Computer Science, 10(1), 153–163.
[6]. Sonkavde, G., Dharrao, D. S., Bongale, A. M., Deokate, S. T., Doreswamy, D., and Bhat, S. K. (2023). Forecasting Stock Market Prices Using Machine Learning and Deep Learning Models: A Systematic Review, Performance Analysis and Discussion of Implications. International Journal of Financial Studies, 11(3), 94.
[7]. Biswal, A. (2023). Power of Recurrent Neural Networks (RNN): revolutionizing AI. Retrieved from https://www.simplilearn.com/tutorials/deep-learning-tutorial/rnn
[8]. Gülen, K. (2023). Stock Prediction In Machine Learning Explained - Dataconomy. Retrieved from https://dataconomy.com/2023/01/11/stock-prediction-machine-learning/
[9]. Ogunbiyi, I. A. (2022). Top evaluation Metrics for regression problems in Machine Learning. Retrieved from https://www.freecodecamp.org/news/evaluation-metrics-for-regression-problems-machine-learning/
[10]. Shah, R. (2022). Performance comparison of regularized and unregularized regression models. Retrieved from https://www.analyticsvidhya.com/blog/2021/08/performance-comparision-of-regularized-and-unregularized-regression-models/