


1. Introduction
Stock price is a dynamic, non-linear complex system that has sudden and random changes. Predicting the stock market can help investors make decisions and reduce risks to obtain stable returns. More importantly, good predictions of stock price can help improve the efficiency of capital markets and create a more realistic capital model. Therefore, good predictions of stock price are very important.
However, the price of stocks is affected by uncertain factors, and it is difficult for investors to make effective predictions about stocks. Previous researchers mostly used stand-alone learning models to predict stock prices, including nonlinear time series models [1,2], artificial neural networks [3,4], decision trees, genetic algorithms, Markov model, support vector set, etc. However, previous investigations still appear to be limited. Therefore, this essay selects the historical data of the Shanghai Composite Index from 1991 to 2016 and predict the closing prices of five Nasdaq stocks by using the ARIMA model, CNN model and LSTM.
2. Methodology
This article mainly uses ARIMA, CNN and LSTM to analyze and predict five stock closing prices (Apple, ADM, Amazon, Google, Microsoft) from 2021.1 to July 2023.
2.1. ARIMA
ARIMA model is a model that predicts the future based on historical time series. It integrated Auto Regressive model and Moving Average model. The model has the following formula, where p is the number of historical parameters [5,6].
\( {y_{t}}= μ+\sum _{i=1}^{p}{y_{i}}{y_{t-i}}+ {∈_{t}} \) (1)
If the series is not stable, Will do differencing until it becomes stable, and d is the number of times of differencing. Through moving average, it reduces the error in the prediction. Below is the formula, where q is the number of prediction error.
\( {y_{t}}= μ+ {∈_{t}}+\sum _{i=1}^{q}{θ_{i}}{ϵ_{t-i}} \) (2)
When referencing the ARIMA model in practice, there are several steps:
1. Observing the stationarity of the data, need to use difference to transfer the non-stationary data into a stationary data. The parameter d is determined.
2. Use ACF and PACF to observe the possible order of p, q
3. Use the smallest BIC to find the best p, q value.
4. To consider differencing and the AR model depend on prior time steps observations. This paper is performing a rolling forecast to improve the prediction accuracy by re-creating ARIMA model when receive a new observation.
2.2. CNN
Neural networks can learn complex patterns and nonlinear relationships in data. CNNs is good at machine vision problems because of their ability to perform convolution operations, extract features from local input patches, and modularize representations while making efficient use of data. These properties enable convolutional neural networks to work in fields such as sequence processing. It examines time as a spatial dimension to process images. It can be used to find time patterns to make predictions in stock market.
There are one or more convolutional layers in a convolutional neural network and a fully connection layer at the top, as well as a pooling layer [7-9] (See Figure 1).
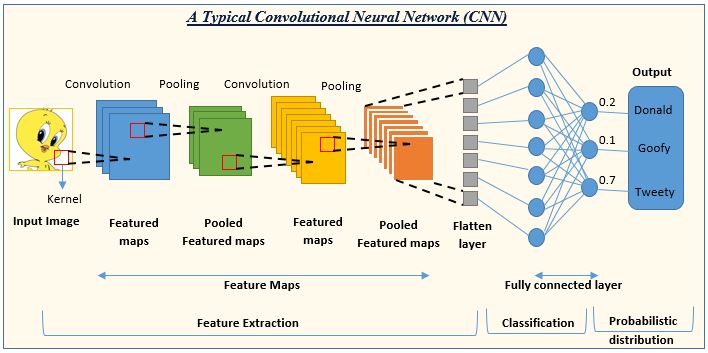
Figure 1: The structure of CNN.
2.3. LSTM
A Long Short-Term Memory network is a type of recurrent neural network, it has capability to learn order dependencies in sequence prediction. Due to the capability to store past information, LSTMs are very useful in predicting stock prices, since future prices are dependent of previous prices.
The LSTM model can predict any number of steps into the future. An LSTM module (or cell) has 5 basic components: cell state, hidden state, input gate, forget gate and output gate allow it to model both long-term and short-term data [10] (See Figure 2).
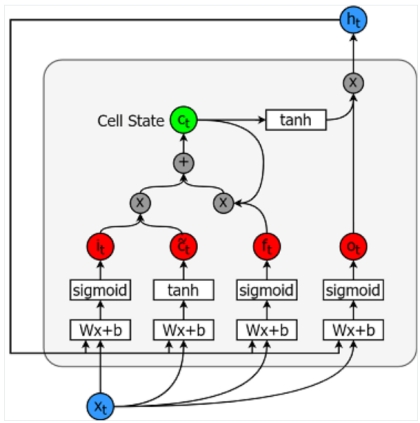
Figure 2: LSTM model.
3. Data and Preprocessing
3.1. Data
In this paper, get stock data from yahoo finance, and five typical stocks of Nasdaq ('AAPL','GOOGL', 'AMD', 'MSFT', 'AMZN') are selected for research. The data contains daily closing prices for these stocks from 2021.1 to July 2023.7. The data is shown in the Figure 3.
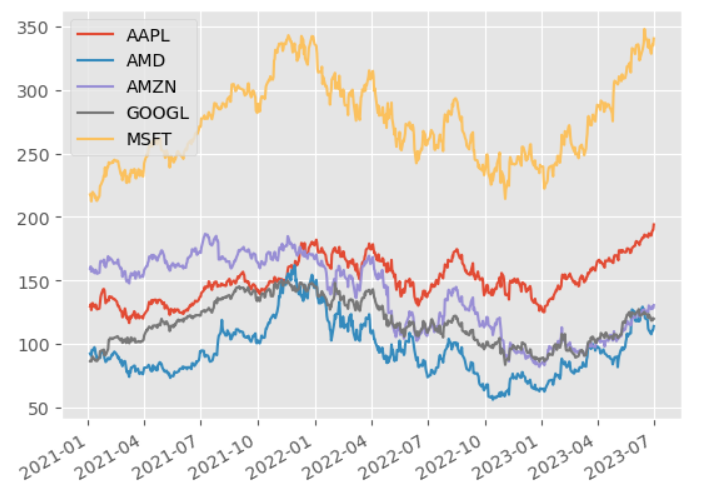
Figure 3: Dataset-stock close price trend.
3.2. ARIMA Processing
The data processing of the ARIMA model is to judge the stationarity of the data. If the data is not stable, the difference operation needs to be performed on the data. After the data is stable, Using ACF and PACF to determine the parameters of P and Q.
It is obvious that data does not meet the stability requirements through observation, so the data are differenced (See Figure 4).
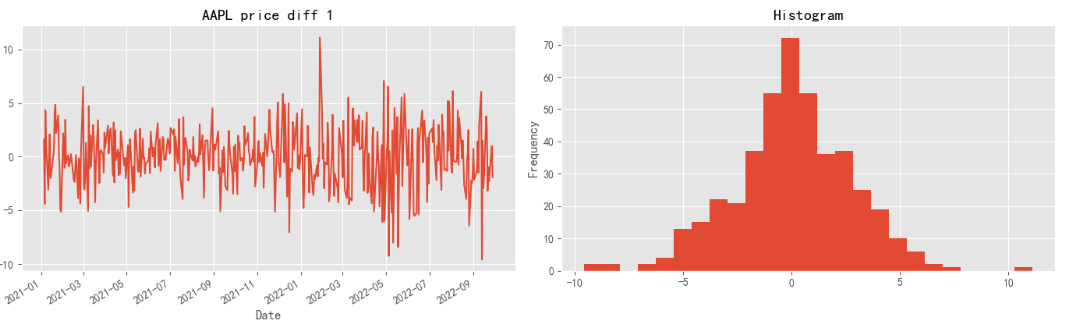
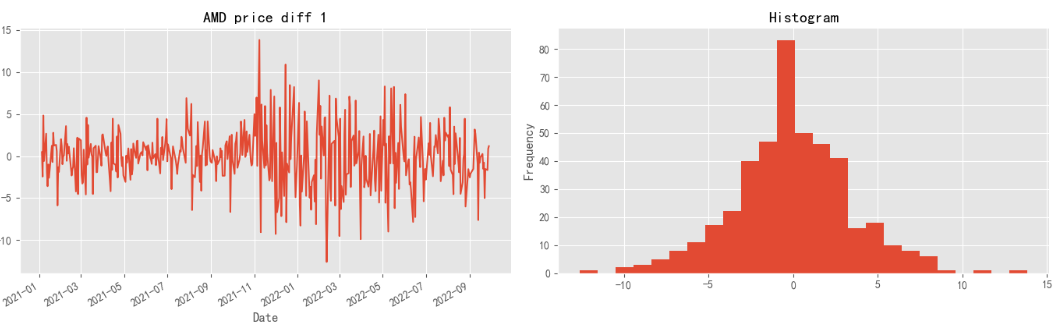
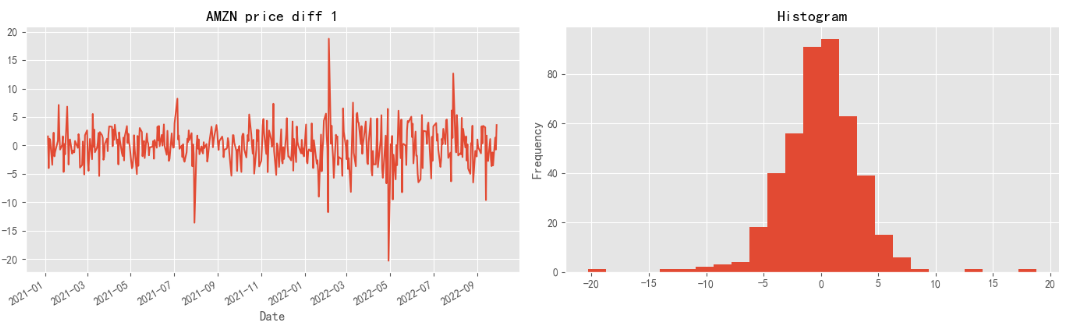
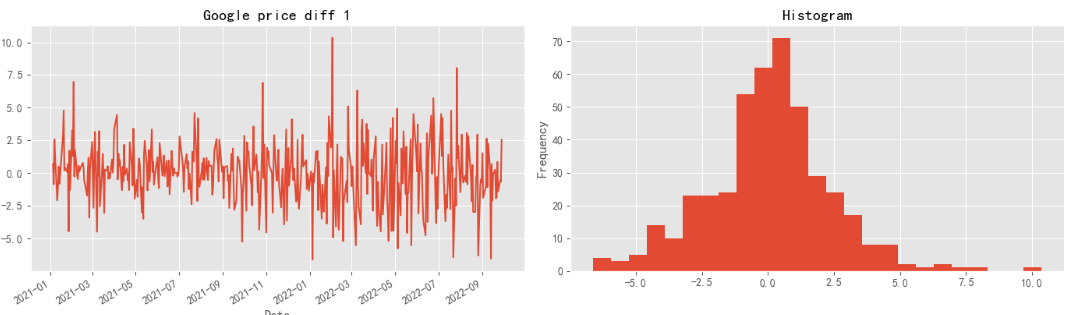
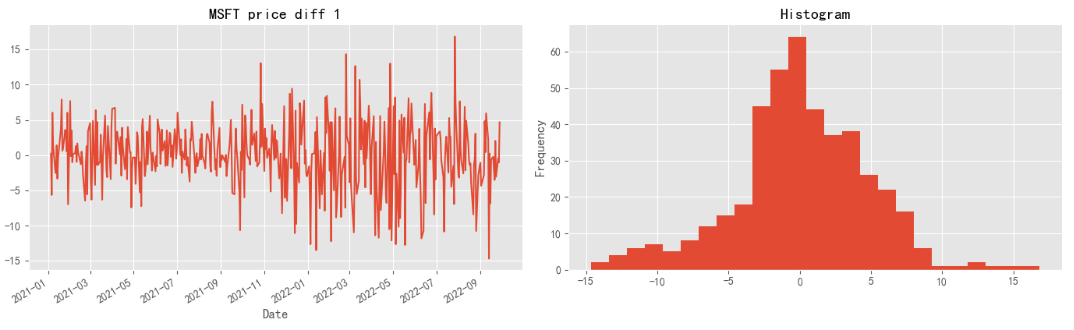
Figure 4: Distributions of Assets.
Then, this paper implements ADF stationary test to the differenced series, and the results show that all the series are stationary and is suitable for economic modelling.
3.3. CNN and LTSM Processing
The CNN model and the LTSM model need to normalize data. The normalization process refers to scaling the original data to reduce it to a fixed range. Normalization can effectively eliminate the two sums of less indicators. The dimensional unit means that the data has comparable performance for comprehensive analysis, and at the same time, it can eliminate noise, improve convergence speed, and improve model accuracy. The normalization method used in this paper is the maximum and minimum method.
3.4. Data Split
The distribution of training data and test data for the three models is 70%, 30%.
4. Results
4.1. ARIMA
This paper first quantities the lag length for ARIMA model and finally, determines the following results. APPL (0, 1, 1), AMD (0 ,1,1), AMZN (0,1,1), Google (0,1,1), MSFT (0,1,1).
Every time the stock value of a new day is predicted, the stock value in the test data is added to the training data. In the meantime, the ARIMA model is reconstructed from the training data to predict the coming day price. Finally, visualize the predict and actual data as Figure 5.
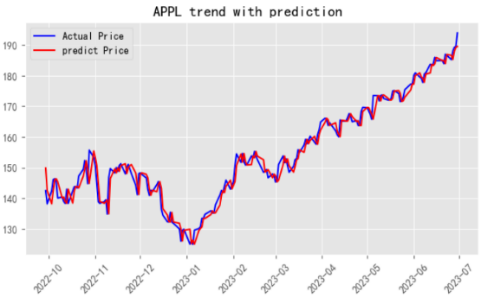
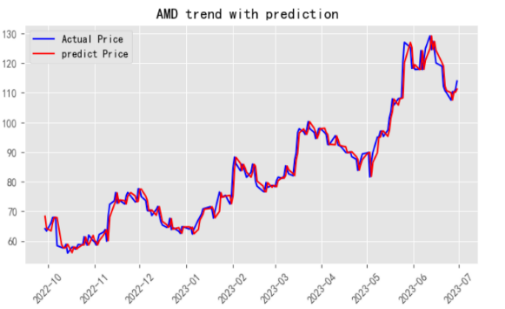
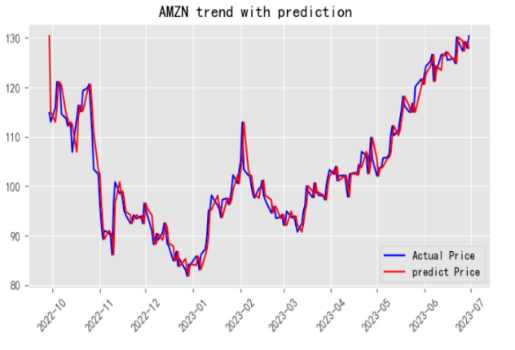
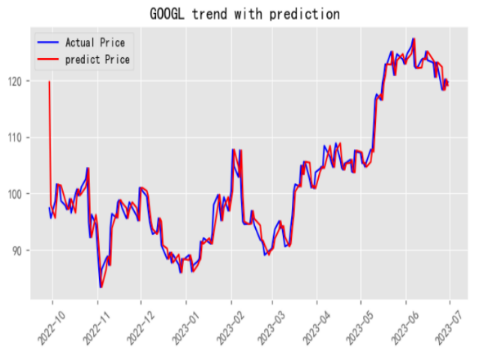
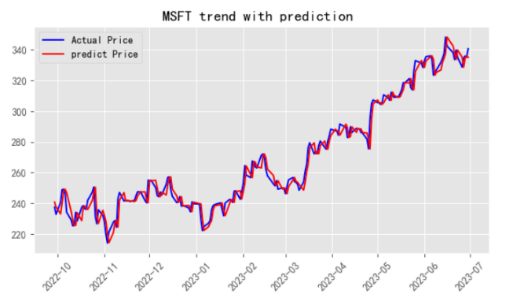
Figure 5: Results of ARIMA forecasts.
The RMSE of the prediction is as Table 1. the prediction effect is very good.
Table 1: RMSE for ARIMA.
Stock symbol | RMSE |
APPL | 2.774560261 |
AMD | 2.896005671 |
AMZN | 2.860170268 |
GoogL | 2.807792113 |
MSFT | 5.384607601 |
4.2. CNN
In this paper, built a simple convolutional neural network model. This model includes two convolutional layers, two pooling layers, one flat and two fully connected layers. convolutional kernels (also known as filters) for first convolutional layer are 3*3 and 2*2 for second layer. The first fully connected layer output nodes are 64, and the second fully connected layer output nodes is 'Stock_Data. The visual display of the prediction results and the real value is shown in the Figure 6.
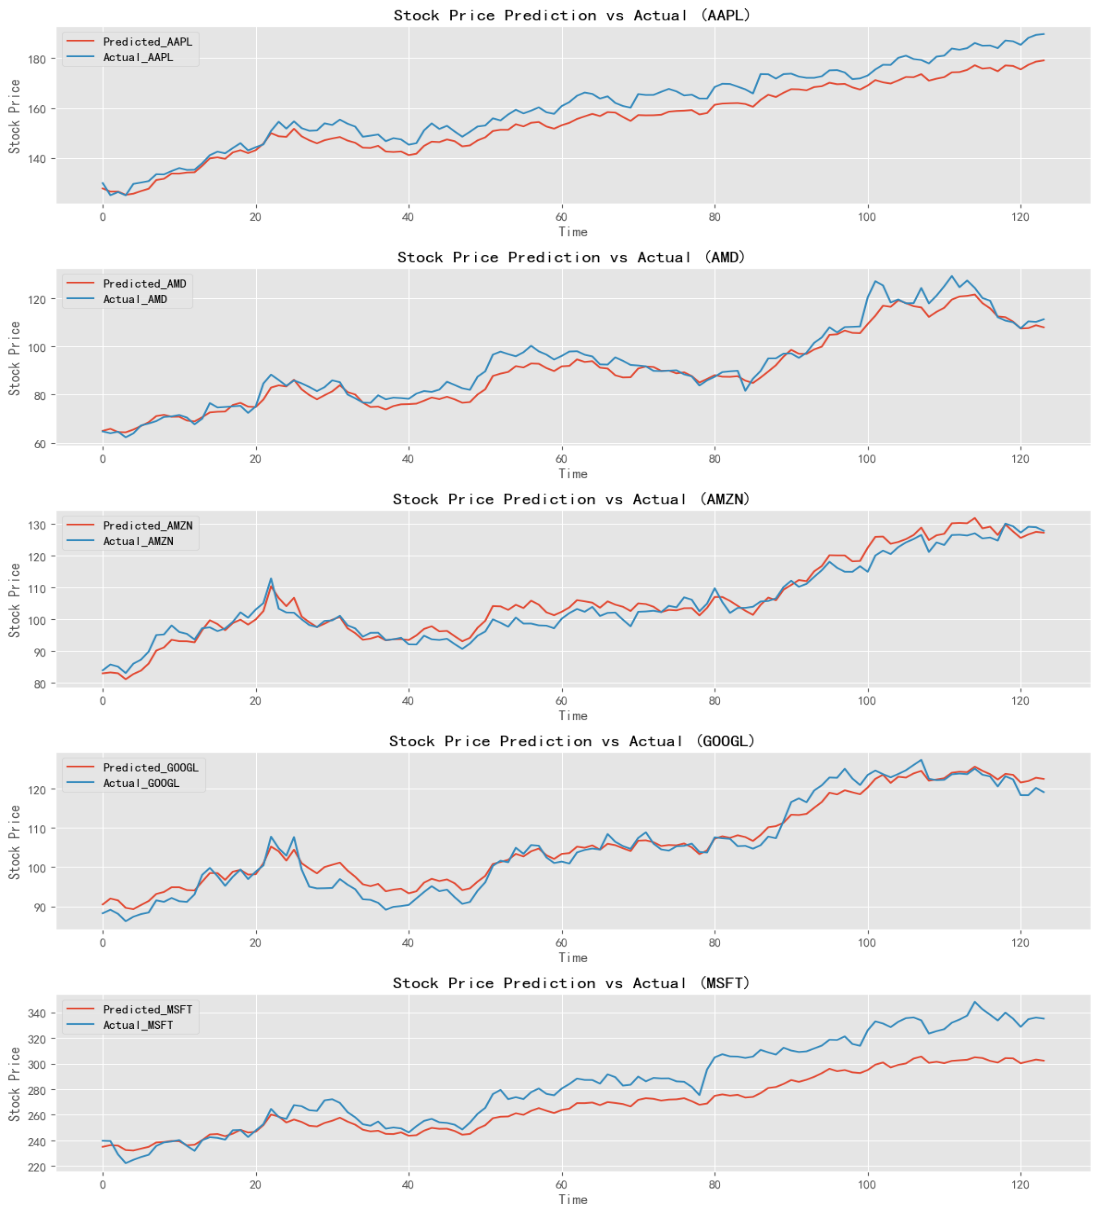
Figure 6: Results of CNN forecasts.
This is the RMSE of the prediction as Table 2.
Table 2: RMSE for CNN.
Stock symbol | CNN RMSE |
APPL | 6.21090165 |
AMD | 4.153477843 |
AMZN | 2.904098039 |
GoogL | 2.497768776 |
MSFT | 20.04826331 |
In this experiment uses mean square error loss. Visualized the loss trend is as Figure 7.
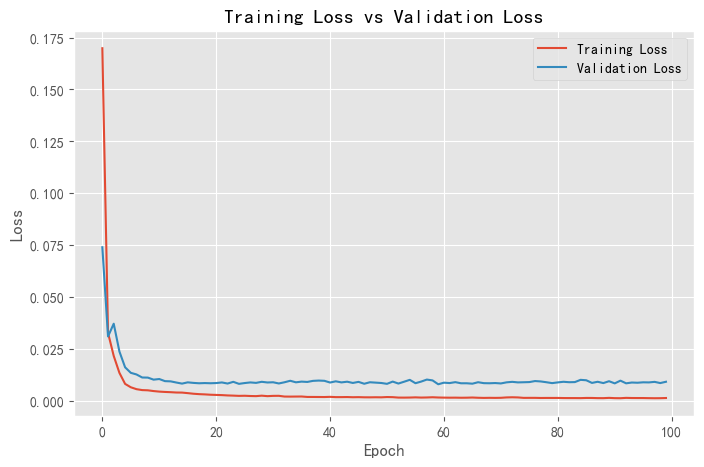
Figure 7: Training loss vs validation loss of CNN.
Both training and validation losses should gradually decrease, indicating that the model is being continuously optimized.
The training loss and validation loss converge to a small value with a significant difference between them. This shows that the generalization ability of the model needs to be improved and can be used to predict future data, but it is not accurate.
In summary, by observing the changes in the loss function, The model has a certain degree of fit to the data and has a general ability to generalize.
4.3. LSTM
This paper uses Keras to build LSTM model. Keras has high-level API for TensorFlow which provides powerful functions, quick use, and easy understanding. First, building the Sequential object and add layers in order. This paper added four layers to this object.
The first layer is the LSTM layer UNIT=96. There are 96 units in the form, and the activation function is 'relu', 5 channels for 5 stocks.
The second layer is LSTM layer and also have 96 unit. Return_sequences=False means that only the next trading day price will be output.
The third layer is the dropout layer. The left and right of the dropout are to randomly shield a certain proportion of the upper layer neurons during each round of training, so that the gradient backpropagation path can be different every time, thereby forcing different neurons to cooperate, thus speeding up the training. To improve the effect, Dropout = 0.2 was set in this paper.
The fourth layer is the Dense layer (full connection layer) and finally outputs the prediction data of 5 stocks.
Then compiles the model, selects 'adam' as the optimizer, MSE as the loss function, visually as Figure 8.
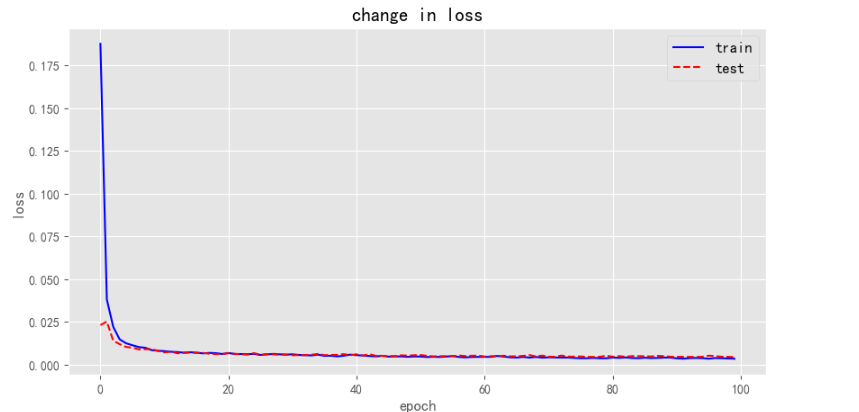
Figure 8: LSTM change in loss.
The next step is to plot the predicted and actual values, as shown in the Figure 9.
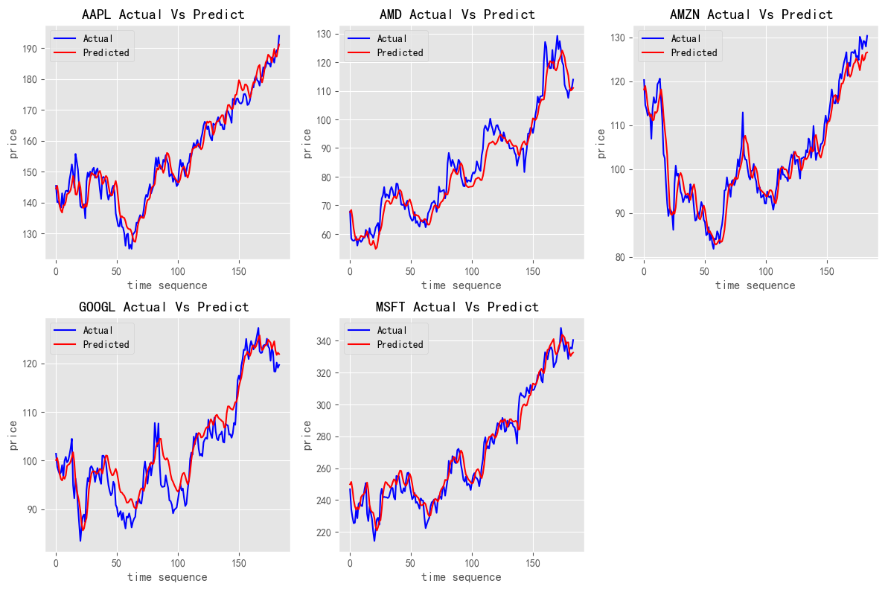
Figure 9: LSTM stock prediction.
The model is evaluated in RMSE as Table 3:
Table 3: LSTM RMSE.
Stock symbol | LSTM RMSE |
APPL | 3.711327865540973 |
AMD | 4.7741382933398775 |
AMZN | 3.495610540683055 |
GoogL | 3.508695503078867 |
MSFT | 7.096476378071467 |
5. Conclusion
This paper compares three stock forecasting algorithms, traditional ARIMA model, CNN model, and LTSM model. According to the verification results of five stocks, the ARIMA model and LSTM model have better forecasting effects. CNN is good at spatial feature extraction, but not good at processing time-related data. Through practice, it shows the deep learning algorithm has good potential to be used to predict stock price, but there are cons: the predicted value lags behind the real value, and there is a large gap in the prediction of turning points. In terms of stock forecasting, potential directions for future deep learning enhancements include applying combined models or trying other deep learning models, or adding other features, such as trading volume or news sentiment, to make the model more comprehensive and accurate.
References
[1]. Vasilev, I., Slater, D., Spacagna, G., Roelants, P., and Zocca, V. (2019). Python Deep Learning: Exploring deep learning techniques and neural network architectures with Pytorch, Keras, and TensorFlow. Packt Publishing Ltd.
[2]. Devi, B. U., Sundar, D., and Alli, P. (2013). An effective time series analysis for stock trend prediction using ARIMA model for nifty midcap-50. International Journal of Data Mining & Knowledge Management Process, 3(1), 65.
[3]. Pai, P., and Hong, W. (2005). An improved neural network model in forecasting arrivals. Annals of Tourism Research, 32(4), 1138-1141.
[4]. Liang, J., Song, W., and Wang, M. (2011). Stock price prediction based on procedural neural networks. Advances in Artificial Neural Systems.
[5]. Ma, Q. (2020). Comparison of ARIMA, ANN and LSTM for stock price prediction. In E3S Web of Conferences, 218, 01026.
[6]. Siami-Namini, S., Tavakoli, N., and Namin, A. S. (2018). A comparison of ARIMA and LSTM in forecasting time series. In 2018 17th IEEE international conference on machine learning and applications, 1394-1401.
[7]. Mehtab, S., and Sen, J. (2020). Stock price prediction using convolutional neural networks on a multivariate timeseries. arXiv preprint arXiv:2001.09769.
[8]. Sen, J., and Mehtab, S. (2022). Stock price prediction using convolutional neural networks. Machine Learning in the Analysis and Forecasting of Financial Time Series, 68-101.
[9]. Sun, Y. (2023). Optimization of Convolutional neural network. Proceedings of the 37th China (Tianjin) 2023 'IT, Network, Information Technology, Electronics, Instrument and Meter Innovation Academic Conference, 54-57.
[10]. Chen, K., Zhou, Y., and Dai, F. (2015). A LSTM-based method for stock returns prediction: A case study of China stock market. In 2015 IEEE international conference on big data, 2823-2824.
Cite this article
Liao,X. (2023). Stock Price Prediction Based on ARIMA and Neural Network. Advances in Economics, Management and Political Sciences,56,163-171.
Data availability
The datasets used and/or analyzed during the current study will be available from the authors upon reasonable request.
Disclaimer/Publisher's Note
The statements, opinions and data contained in all publications are solely those of the individual author(s) and contributor(s) and not of EWA Publishing and/or the editor(s). EWA Publishing and/or the editor(s) disclaim responsibility for any injury to people or property resulting from any ideas, methods, instructions or products referred to in the content.
About volume
Volume title: Proceedings of the 2nd International Conference on Financial Technology and Business Analysis
© 2024 by the author(s). Licensee EWA Publishing, Oxford, UK. This article is an open access article distributed under the terms and
conditions of the Creative Commons Attribution (CC BY) license. Authors who
publish this series agree to the following terms:
1. Authors retain copyright and grant the series right of first publication with the work simultaneously licensed under a Creative Commons
Attribution License that allows others to share the work with an acknowledgment of the work's authorship and initial publication in this
series.
2. Authors are able to enter into separate, additional contractual arrangements for the non-exclusive distribution of the series's published
version of the work (e.g., post it to an institutional repository or publish it in a book), with an acknowledgment of its initial
publication in this series.
3. Authors are permitted and encouraged to post their work online (e.g., in institutional repositories or on their website) prior to and
during the submission process, as it can lead to productive exchanges, as well as earlier and greater citation of published work (See
Open access policy for details).
References
[1]. Vasilev, I., Slater, D., Spacagna, G., Roelants, P., and Zocca, V. (2019). Python Deep Learning: Exploring deep learning techniques and neural network architectures with Pytorch, Keras, and TensorFlow. Packt Publishing Ltd.
[2]. Devi, B. U., Sundar, D., and Alli, P. (2013). An effective time series analysis for stock trend prediction using ARIMA model for nifty midcap-50. International Journal of Data Mining & Knowledge Management Process, 3(1), 65.
[3]. Pai, P., and Hong, W. (2005). An improved neural network model in forecasting arrivals. Annals of Tourism Research, 32(4), 1138-1141.
[4]. Liang, J., Song, W., and Wang, M. (2011). Stock price prediction based on procedural neural networks. Advances in Artificial Neural Systems.
[5]. Ma, Q. (2020). Comparison of ARIMA, ANN and LSTM for stock price prediction. In E3S Web of Conferences, 218, 01026.
[6]. Siami-Namini, S., Tavakoli, N., and Namin, A. S. (2018). A comparison of ARIMA and LSTM in forecasting time series. In 2018 17th IEEE international conference on machine learning and applications, 1394-1401.
[7]. Mehtab, S., and Sen, J. (2020). Stock price prediction using convolutional neural networks on a multivariate timeseries. arXiv preprint arXiv:2001.09769.
[8]. Sen, J., and Mehtab, S. (2022). Stock price prediction using convolutional neural networks. Machine Learning in the Analysis and Forecasting of Financial Time Series, 68-101.
[9]. Sun, Y. (2023). Optimization of Convolutional neural network. Proceedings of the 37th China (Tianjin) 2023 'IT, Network, Information Technology, Electronics, Instrument and Meter Innovation Academic Conference, 54-57.
[10]. Chen, K., Zhou, Y., and Dai, F. (2015). A LSTM-based method for stock returns prediction: A case study of China stock market. In 2015 IEEE international conference on big data, 2823-2824.