


1. Introduction
Equity research is a field that uses quantitative analysis to conduct a thorough research on the company and its equity and give recommendations to investors on whether the stock is worth buying. This paper conducted equity research on Tesla and analyzed whether its stock is worth buying. Tesla is the most valuable automobile company in the world and also it is a leader in the clean energy industry. Model Y cars from Tesla Inc. have been one of the five best-selling vehicles in the world. In the last year, Tesla sold around 936,000 vehicles. This paper analyzed Tesla Inc and its position in the electric vehicles industry by looking through the market share and sales over the last year. After the qualitative analysis, we analyzed the financial health of Tesla based on profitability, liquidity, and credit metric. The data was calculated from the financial statement of the past four years. Furthermore, the company’s equity was analyzed. The beta value was calculated from the past stock price by doing a regression in Excel. The beta value calculated was compared with 1 to see the volatility of stock price relative to the overall market. Finally, a valuation of the cost of equity was calculated using CAPM.
The equity research provides a comprehensive analysis of the company’s equity and the industry, gives a valuation of the company’s stock and determines whether the stock is worth investing currently. This paper provides a logical way of how equity research is conducted. Investors can compare up-to-date data calculated in this paper with the data calculated using the same method in the future to analyze whether Tesla Inc. is becoming more profitable.
2. Data and Methodology
The qualitative way of analyzing the company would give an overview of Tesla Inc., analyze the position of Tesla in the automobile industry and also the prospect of the new energy vehicles industry.
When analyzing the financial statement of the past four years, one ratio was calculated from each of the profitability metric, liquidity metric, and credit metric so that it would be much easier to see whether the company is operating effectively and generating profits in the long run. The financial statement was derived from Yahoo Finance which is a media that provides the user with updated financial news and information about stocks such as the historical stock price and financial reports.
The daily historical data of Tesla Inc.’s stock for the past 5 years was downloaded from Yahoo Finance. Excel would be used for the estimation of the beta by using these data. This paper used the adjusted close price for the calculation of the daily return. The formula for the beta value is:
\( β = \frac{cov({r_{A}},{r_{B}})}{Var({r_{B}})} \) (1)
Using this formula, this paper made a regression of the percentage change in daily return vs the percentage daily change in the overall stock market.
Capital Asset Pricing Model was used for the valuation. The formula for CAPM is:
\( {r_{equity}} = {r_{f}}+{β_{equity}}*({r_{m}}-{r_{f}}) \) (2)
This paper used the 5-year US bond yield from the website for the risk-free rate and calculated the expected market return rate by using the past five year’s S&P mean return to get the annualized mean return. The beta value used for CAPM was calculated from the previous part.
3. Results and Findings
3.1. Company and Industry Analysis
Tesla Inc., an American automobile and clean energy company, was founded by Martin Eberhard and Marc Tarpenning in 2003 in the United States. Tesla Inc. focuses on designing electric vehicles (EV) and the Model 3 has become the world best-selling EV in the world. For the first half year of 2022, Tesla Inc. occupies a “68% market share of the EV industry”, which shows that Tesla Inc. dominates the EV industry [1].
According to Figure 1, over the past 10 years, the sales of Tesla’s vehicles increase from 2600 to 936172, which is 360 times increase [2]. Over the past year, the sales doubled. This graph clearly indicates that as more people are increasing their awareness of clean energy, they are more prone to choose Tesla’s vehicles, so the company has an outstanding performance in sales.
Over the past few years, the demand for EV has steadily increased because of the increase in fossil fuel price, decrease of the battery cost, and the increase of the charging infrastructure. By 2030, there will be “more than 145 million EVs running across the globe” [3]. The prospect for EV is promising as they will dominate the vehicle industry in the future.
On Oct 6th, 2022, the credit rating for Tesla Inc has upgraded from BB+ to BBB at S&P because of the company’s dominance in EV market, low default risk and strong profitability.
Based on the qualitative analysis of dominance of Tesla Inc in EV market, good prospect of EV industry and upgrade of credit rating, Tesla Inc. is worth investing.
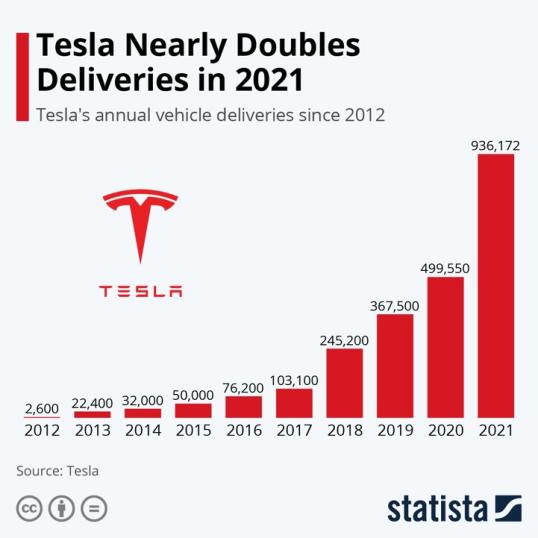
Figure 1: Tesla’s annual vehicle deliveries over the past 10 years [2].
3.2. Financial Statement Analysis
1) The first ratio calculated is return on equity (ROE) which is a profitability metric.
ROE= \( \frac{Net Income}{Shareholder \prime s Equity} \) (3)
Table 1: Return on equity ratio between 2018 and 2021.
2021 | 2020 | 2019 | 2018 | |
ROE | 18.3% | 3.1% | -13.0% | -19.8% |
As is shown in Table 1, the ROE in 2018 was a negative value however in 2021 it has steadily increased to a positive value that is greater than 15%. Usually, a good ROE ratio is >15%, the higher ROE, the greater it can convert the financial into profit. Compared with 2018, Tesla generates more profit with each dollar of shareholders’ equity in 2021 which indicates that Tesla has more residuals after liabilities have been paid.
2) The second ratio calculated is current ratio, which is a liquidity metric.
Quick ratio = \( \frac{current assets-inventory}{current liabilities} \) (4)
Table 2: Quick ratio between 2018 and 2021.
2021 | 2020 | 2019 | 2018 | |
Quick ratio | 1.08 | 1.59 | 0.80 | 0.52 |
As is shown in Table 2, there is an increasing trend in the quick ratio from 2018 to 2020 but in 2021 the quick ratio has decreased. Usually, a good quick ratio is greater than 1 meaning that the company is capable of paying its current liabilities with its liquid assets. Although in 2021, the quick ratio decreased, it still indicates that the financial state of the company is healthy.
3) The third ratio calculated is financial leverage ratio which is a credit metric.
financial leverage ratio = \( \frac{Total assets}{Shareholder \prime s equity} \) (5)
Table 3: Financial leverage ratio between 2018 and 2021.
2021 | 2020 | 2019 | 2018 | |
Financial leverage ratio | 2.06 | 2.20 | 5.18 | 6.04 |
As is shown in Table 3, it can be seen that the financial leverage ratio is decreasing from 2018 to 2021. Usually, a higher ratio that is greater than 2 means that the company fund itself more through debt than equity. So as the ratio is decreasing over these 4 years for Tesla’s company, it can be shown that investing in Tesla is more conservative.
Based on the three metrics above, Tesla Inc is in a good financial state in which it is generating profit, it is capable of paying its debt without external assets and investing in Tesla’s stock has become more conservative.
3.3. Beta Value
Table 4: Summary output of regression of the percentage change in daily return vs the percentage daily change in the overall stock market.
Regression Statistics | |||||||||
Multiple R | 0.50642 | ||||||||
R Square | 0.256461 | ||||||||
Adjusted R | 0.255869 | ||||||||
Standard Error | 3.477861 | ||||||||
Observation | 1258 | ||||||||
ANOVA | |||||||||
df | SS | MS | F | Significance F | |||||
Regression | 1 | 5240.015 | 5240.015 | 433.2197 | 6.69E-83 | ||||
Residual | 1256 | 15191.97 | 12.09552 | ||||||
Total | 1257 | 20431.98 | |||||||
Coefficients | Standard Error | t Stat | P-value | Lower 95% | Upper 95% | Lower 95.0% | Upper 95.0% | ||
Intercept | 0.215218 | 0.098094 | 2.194008 | 0.028418 | 0.022773 | 0.407664 | 0.022773 | 0.407664 | |
X Variable 1 | 1.495769 | 0.071864 | 20.81393 | 6.69E-83 | 1.354783 | 1.636755 | 1.354783 | 1.636755 | |
Using the excess return derived from the daily stock price in Excel and construct a regression, beta value has been calculated. As Table 4 shows, the beta value is 1.495769 which is greater than 1. As the beta value is the “regression slope coefficient of the return on the asset on the return on the market portfolio” [4], it is a type of risk indicator which is used to measure the price volatility of the individual stock relative to the whole stock market. As the calculated beta value is greater than 1, it represents that the price change rate of Tesla Inc’s stock is greater than the general stock market.
3.4. CAPM Valuation
In order to calculate the cost of equity value, this paper used the formula of capital asset pricing model (CAPM) which is: \( {r_{equity}} = {r_{f}}+{β_{equity}}*({r_{m}}-{r_{f}}) \) . The 5-year US government bond yield has been used as the risk-free rate. Therefore, rf = 3.95%. For the market return, this paper estimated it by estimating the annual historical mean return of S&P of past 5 years. rm = 17.042%. By CAPM, the cost of equity = 3.95%+1.495769*(17.042%-3.95%) = 23.53%.
4. Discussion
Using CAPM for valuation has some advantages. To begin with, the formula of CAPM is simple because there are some assumptions that have been used for CAPM. The first one is securities markets are competitive and efficient” and another one is “most investors are risk-averse” [5]. Also, the beta value of CAPM is calculated based on the history of the stock price. The beta value is also a measure of risk, so CAPM takes the systematic risk into account and it represents the volatility of an individual stock compared to the stock market.
Although CAPM provides a simple way to value the stock price, there are some limitations to this method. The first one is the assumptions made are indeed not in reality. The model assumes that the government bond is risk-free. However, in reality, it would not be true. Also, the risk-free rate fluctuates every day [6]. The second problem is when calculating beta value, the method used only looks back to the historical data. This assumes that beta value is constant with the time change. However, beta is not stable over time. Therefore, using historical data to estimate beta could not be a good choice. It cannot estimate accurately of future risk.
5. Conclusion
In conclusion, Tesla is a fast-growing company and dominates the international electric vehicle industry. Besides, as more people become aware of the importance of green travel and also numerous government support has been put into the development of electric vehicles, the prospect of EV industry is promising.
Furthermore, based on the financial statement analysis, key metrics have been calculated from three different perspectives. From these metrics, it can be concluded that Tesla is generating profits, has enough assets to pay its short-term liabilities, and its decreasing reliance on debt to finance itself. From all three prospective, Tesla has a good financial performance.
From the calculation of beta value, it can be observed that Tesla has a beta value greater than 1. It represents that Tesla has greater volatility than the overall stock market. The risk-seeking investors who have a greater risk tolerance would prefer buying Tesla’s stock. Finally, this paper made a valuation of the Tesla Inc. cost of equity by using Capital Asset Pricing Model (CAPM). Although CAPM is easy to use and use historical data to predict future price, it has the limitation that in reality, most investors are not risk-averse, and the beta value is changing over time. Given the problems with CAPM, Arbitrage Pricing Theory (APT) seems to be a better choice for valuation.
Compared with CAPM, APT has added “macroeconomic factors” into consideration. CAPM only has one factor in its equation while in APT, multi-factor has taken into account. Also, CAPM has assumed the rate of return follows a normal distribution, however, APT does not. As a result, APT may seem to be a better model for valuation than CAPM when estimating the stock price for the long run, it may be an accurate approximation in the short run [7].
The valuation models discussed in this paper both use historical data to calculate the beta value. This may present some problems that historical information cannot accurately predict future performance. The two models both assume that the company will act similarly to the past, however, there would be lots of unpredictable events in the future such as in 2020, the spread of the pandemic caused a large number of companies to go bankrupt. In the future, researchers should more focus on the current data and also create multiple extreme scenarios that may happen in the future to cope with future uncertainties.
References
[1]. Lambert, F. (2022, August 15). Tesla (TSLA) still dominates US electric car market with 68% market share. Electrek. Retrieved November 29, 2022, from https://electrek.co/2022/08/15/tesla-tsla-dominates-us-electric-car-market-share/
[2]. Richter, F. (2022, January 11). Infographic: Tesla nearly doubles deliveries in 2021. Statista Infographics. Retrieved November 29, 2022, from https://www.statista.com/chart/8547/teslas-vehicle-deliveries-since-2012/
[3]. Research, V. M. (2022b, September 27). Electric Vehicle (EV) Market Size & Share to Hit $434.4 Bn by 2028 | 12.5 Million Chargers Would be Needed. GlobeNewswire News Room. https://www.globenewswire.com/en/news-release/2022/09/27/2523350/0/en/Electric-Vehicle-EV-Market-Size-Share-to-Hit-434-4-Bn-by-2028-12-5-Million-Chargers-Would-be-Needed.html
[4]. The Capital Asset Pricing Model: Theory and evidence. (n.d.). Retrieved November 29, 2022, from https://pubs.aeaweb.org/doi/pdfplus/10.1257/0895330042162430
[5]. Does the Capital Asset Pricing Model Work? (2014, August 1). Harvard Business Review. https://hbr.org/1982/01/does-the-capital-asset-pricing-model-work
[6]. Nagpal, S. (2013). Capital Asset Pricing Model (CAPM). Educational Technology. https://www.elixirpublishers.com/articles/1368686603_58A%20(2013)%2014982-14984.pdf
[7]. Bodie, Z., Kane, A. & Marcus, A.J. (2012) Investments and Portfolio Management, (9th Ed) McGraw Hill
Cite this article
Ji,X. (2023). Equity Research of Tesla’s Company. Advances in Economics, Management and Political Sciences,6,372-377.
Data availability
The datasets used and/or analyzed during the current study will be available from the authors upon reasonable request.
Disclaimer/Publisher's Note
The statements, opinions and data contained in all publications are solely those of the individual author(s) and contributor(s) and not of EWA Publishing and/or the editor(s). EWA Publishing and/or the editor(s) disclaim responsibility for any injury to people or property resulting from any ideas, methods, instructions or products referred to in the content.
About volume
Volume title: Proceedings of the 2022 International Conference on Financial Technology and Business Analysis (ICFTBA 2022), Part 2
© 2024 by the author(s). Licensee EWA Publishing, Oxford, UK. This article is an open access article distributed under the terms and
conditions of the Creative Commons Attribution (CC BY) license. Authors who
publish this series agree to the following terms:
1. Authors retain copyright and grant the series right of first publication with the work simultaneously licensed under a Creative Commons
Attribution License that allows others to share the work with an acknowledgment of the work's authorship and initial publication in this
series.
2. Authors are able to enter into separate, additional contractual arrangements for the non-exclusive distribution of the series's published
version of the work (e.g., post it to an institutional repository or publish it in a book), with an acknowledgment of its initial
publication in this series.
3. Authors are permitted and encouraged to post their work online (e.g., in institutional repositories or on their website) prior to and
during the submission process, as it can lead to productive exchanges, as well as earlier and greater citation of published work (See
Open access policy for details).
References
[1]. Lambert, F. (2022, August 15). Tesla (TSLA) still dominates US electric car market with 68% market share. Electrek. Retrieved November 29, 2022, from https://electrek.co/2022/08/15/tesla-tsla-dominates-us-electric-car-market-share/
[2]. Richter, F. (2022, January 11). Infographic: Tesla nearly doubles deliveries in 2021. Statista Infographics. Retrieved November 29, 2022, from https://www.statista.com/chart/8547/teslas-vehicle-deliveries-since-2012/
[3]. Research, V. M. (2022b, September 27). Electric Vehicle (EV) Market Size & Share to Hit $434.4 Bn by 2028 | 12.5 Million Chargers Would be Needed. GlobeNewswire News Room. https://www.globenewswire.com/en/news-release/2022/09/27/2523350/0/en/Electric-Vehicle-EV-Market-Size-Share-to-Hit-434-4-Bn-by-2028-12-5-Million-Chargers-Would-be-Needed.html
[4]. The Capital Asset Pricing Model: Theory and evidence. (n.d.). Retrieved November 29, 2022, from https://pubs.aeaweb.org/doi/pdfplus/10.1257/0895330042162430
[5]. Does the Capital Asset Pricing Model Work? (2014, August 1). Harvard Business Review. https://hbr.org/1982/01/does-the-capital-asset-pricing-model-work
[6]. Nagpal, S. (2013). Capital Asset Pricing Model (CAPM). Educational Technology. https://www.elixirpublishers.com/articles/1368686603_58A%20(2013)%2014982-14984.pdf
[7]. Bodie, Z., Kane, A. & Marcus, A.J. (2012) Investments and Portfolio Management, (9th Ed) McGraw Hill