


1. Introduction
The urgency of environmental protection and sustainable development has driven governments and financial institutions worldwide to adopt policies that promote eco-friendly practices among businesses. One pivotal policy in this domain is the GCP [1], designed to incentivize companies to adopt environmentally responsible strategies and reduce their ecological impact. This paper seeks to assess and substantiate the influence of GCP on corporations through three key perspectives: industry composition, corporate outcomes, and the strategies implemented by firms in reaction to this policy.
(1) Background and Importance of GCP: The increasing global environmental concerns and the imperative for sustainable practices have highlighted the significance of the GCP. By encouraging companies to embrace green initiatives and sustainable development, this policy plays a crucial role in achieving environmental objectives and fostering a green economy [2].
(2) Research Objectives and Significance: This study seeks to explore the impact of the GCP on companies from multiple perspectives, namely, its influence on industrial structure, firm performance, and the measures taken by companies in response to the policy. By examining these aspects, this research contributes to the understanding of how the GCP shapes companies’ behavior, performance, and strategic responses towards sustainability.
(3) Research Methodology: The research adopts an empirical approach, utilizing data from a diverse range of sources to examine the influence of GCP on companies. The sample selection process involves collecting and organizing pertinent indicators from 30 provinces in China, resulting in 330 valid samples. The data used for this research are sourced from official publications databases, including the China Statistical Yearbook (2007-2017), the China Industry Statistical Yearbook, and also the CSMAR database.
1.1. The Influence of GCP on Industrial Structure
(1) Theoretical Framework: This section delves into the intricate mechanisms through which GCP exerts its influence on companies’ industrial structure. The Capital Direction Mechanism, Capital Formation Mechanism, Feedback and Credit Generation Mechanism, and Industrial Integration Mechanism are thoroughly examined to provide a comprehensive understanding of the overall effects of GCP on industrial structure.
(2) Theoretical Hypotheses: Drawing on relevant theories and empirical evidence, this research posits the hypothesis that GCP serves to enhance companies’ industrial structure by optimizing the allocation of local resources. Through the rationalization of industrial structure, businesses are expected to undergo positive transformations facilitated by the incentivizing nature of GCP.
(3) Empirical Findings: To gauge the specific impact of GCP on companies’ industrial structures, this study introduces novel indicators such as “industrial structure supererogation (ISS)” and “industrial structure rationalization (ISR)” [3, 4]. The empirical results of this research illustrate how GCP acts as a driving force for industrial structural upgrades, leading to a higher level of industrial rationalization.
1.2. The Influence of GCP on Firm Performance
(1) Theoretical Analysis: This section examines the intricate relationship between GCP and companies’ performance, particularly how it influences their capital allocation and development directions. Moreover, it explores the potential impact of this policy on heavily polluting enterprises (HPEs), while also investigating any differential effects on state-owned enterprises and large-scale firms.
(2) Theoretical Hypotheses: Based on a comprehensive theoretical analysis, several hypotheses are proposed. First, there is the expectation of a “penalty effect” on the performance of environmentally underperforming companies under the GCP. Additionally, the policy’s influence on state-owned enterprises and large-scale firms is assumed to be pronounced. Furthermore, external monitoring is hypothesized to play a significant role in moderating the effect of GCP on firms’ performance.
(3) Empirical Results: To assess firm performance, this research adopts three key indicators: Return on Assets (ROA), Return on Equity (ROE), and Tobin’s Q [5, 6]. The empirical findings substantiate the existence of the “penalty effect” of GCP on firms with poor environmental performance.
1.3. Measures Adopted by Companies in Response to the GCP
(1) Greening the Supply Chain: This section explores companies’ initiatives to green their supply chains in response to the GCP and analyzes the influence of these measures on their industrial structure and performance.
(2) Investment Decision-Making: We investigate companies’ investment decisions in response to the GCP, including their inclination towards investments in the green environmental industry. The research analyzes the influence of these decisions on companies’ industrial structure and performance.
(3) Green Innovation: This part thoroughly analyzes how GCP stimulates green innovation and facilitates green transformation within heavily polluting enterprises. The paper examines the influence of these innovations on companies’ industrial structure and performance.
In conclusion, this research seeks to comprehensively analyze the effects of the GCP on companies, focusing on its impact on industrial structure, firm performance, and the measures adopted by companies in response to this policy. The empirical investigation and theoretical analysis shed light on the transformative role of GCP in promoting environmentally responsible practices and fostering sustainable development within the business sector. By understanding the multifaceted impact of the GCP, policymakers, investors, and stakeholders can make informed decisions that contribute to a greener and more sustainable future.
2. The Influence of GCP on Industrial Structure
The implementation of GCP represents a strategic approach to effectively manage the allocation of socio-economic resources across diverse industries and projects. This financial mechanism entails the investment in and reclamation of projects and companies that demonstrate significant deviations from established environmental standards. By doing so, GCP seeks to curtail the funding sources available to “two high” industries, while concurrently redirecting substantial funds towards green industries and projects, thereby fostering their progressive advancement. Essentially, GCP's main goal is to enable a broad transformation in industrial structure, encompassing two essential aspects: streamlining and enhancing the current industrial framework.
Amidst the continuous evolution of the industrial structure, the China Banking Regulatory Commission (CBRC) took decisive action between 2012 and 2016 by issuing a series of policies dedicated to the promotion of GCP. These strategic policies were devised to establish robust management standards for GCP within financial institutions, while also imposing stringent mandates on companies to facilitate technological transformations aimed at promoting energy conservation and emissions reduction. As a result, the implementation of GCP has brought about substantial changes in the landscape of industrial operations and has played a pivotal role in driving companies to adopt sustainable practices and support environmentally responsible initiatives.
The rationalization of industrial structure involves optimizing the allocation of resources among different industries based on their ecological impact and sustainability considerations [7]. GCP plays a pivotal role in this aspect by incentivizing financial institutions to prioritize environmentally friendly and sustainable projects. As a result, industries that are deemed detrimental to the environment, such as heavily polluting and energy-intensive industries, face reduced financial support. This approach creates a financial disincentive for companies operating within such “two-high” industries, compelling them to reevaluate their practices and potentially transition towards greener alternatives.
In contrast, fostering the enhancement of the industrial framework involves the advancement and amalgamation of eco-friendly sectors, which play a pivotal role in fostering environmental preservation and fostering sustainable progress. With access to increased financial resources through GCP initiatives, companies engaged in eco-friendly practices and renewable technologies experience heightened growth opportunities. This leads to the expansion of green sectors, encouraging more businesses to adopt environmentally responsible practices and contribute to the overall sustainability agenda.
During the period from 2012 to 2016, the CBRC’s issuance of specific policies targeting GCP signified a concerted effort to ensure that financial institutions played a proactive role in fostering sustainable industrial practices. These policies guided financial institutions towards responsibly managing their GCP portfolios and encouraged them to support companies in undertaking necessary technological upgrades for energy efficiency and emissions reduction.
In conclusion, the influence of GCP on companies from the perspective of industrial structure is evident through its role in both rationalizing and upgrading industrial sectors. By discouraging investment in “two-high” industries and encouraging funding for green projects, GCP helps reshape the economic landscape towards more sustainable practices. The subsequent sections of this section will delve into how this is accomplished through Theoretical analysis, research hypotheses, and empirical analysis.
2.1. Theoretical Analysis and Research Hypotheses
This segment aims to present a theoretical analysis of the impact of GCP on the industrial structure, elucidating the underlying mechanisms by which it operates. The discussion will revolve around four key mechanisms: the Capital Formation Mechanism, Capital Direction Mechanism, Feedback and Credit Generation Mechanism, and Industrial Integration Mechanism. Additionally, two research hypotheses are proposed to prove the influence of GCP on the industrial structure (Figure 1).
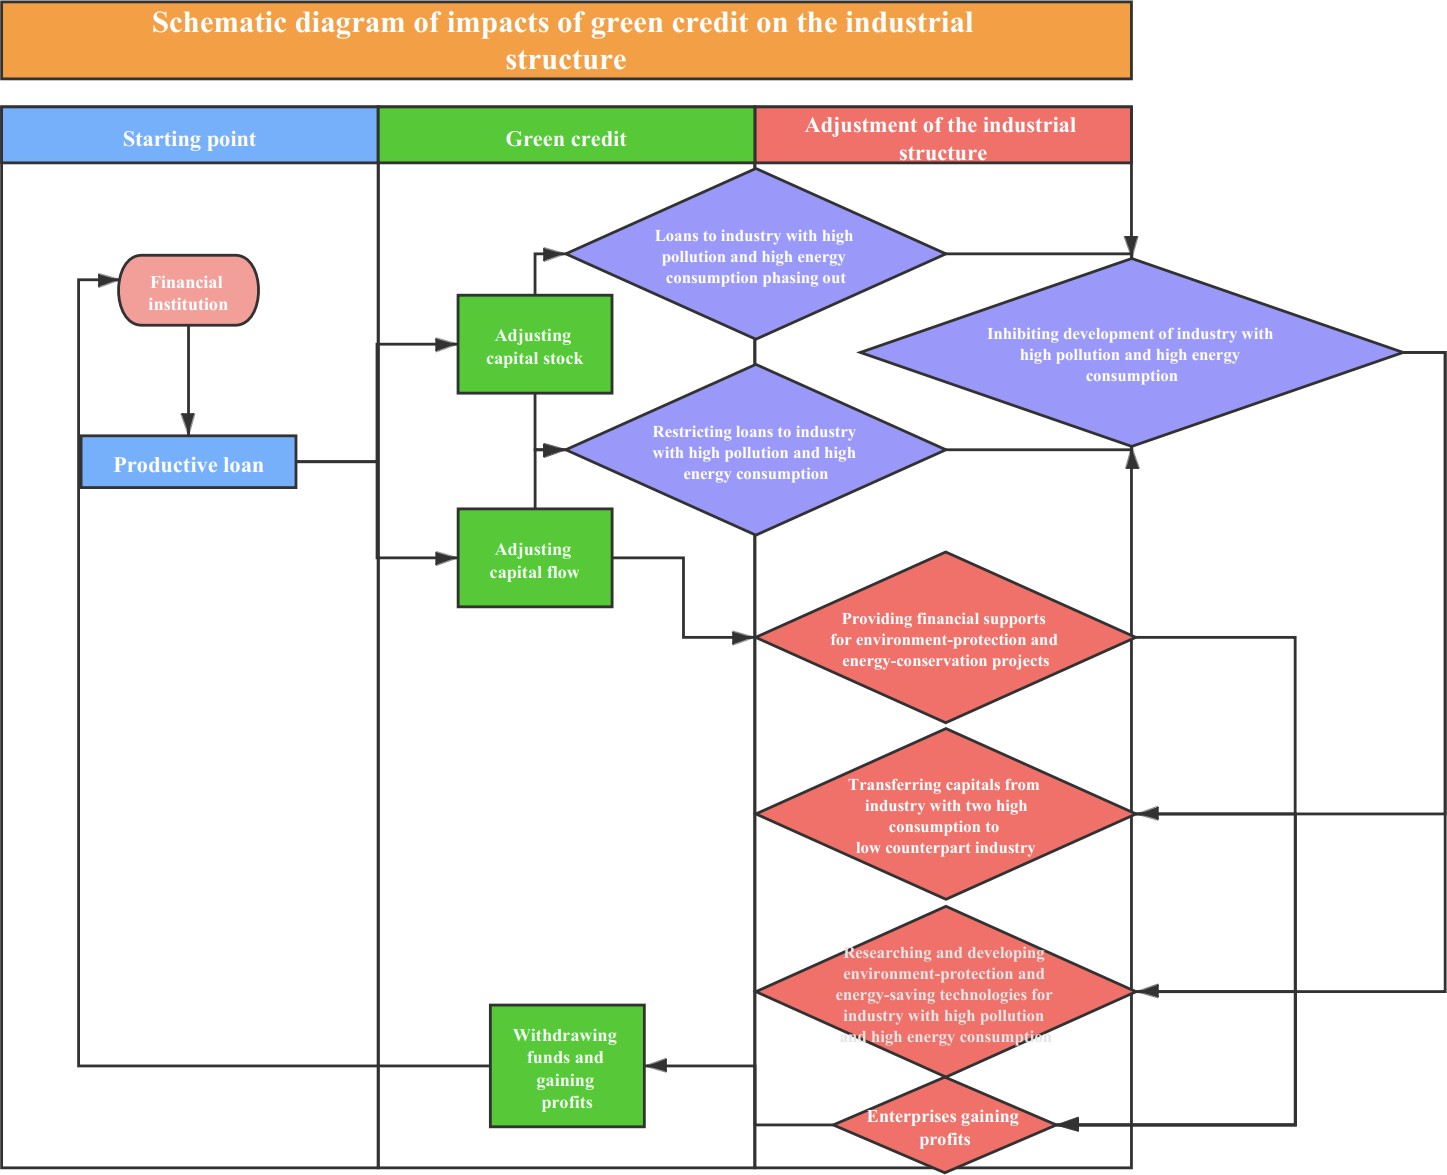
Figure 1: Structure graph of impacts of GCP on the industrial structure.
(1) Capital Formation Mechanism: Renowned American economist Kuznets proposed a mechanism that transforms savings into investments, which significantly influences the development of corporate industries. The scale of enterprise growth is intricately linked to the amount of financing they can secure, with bank credit serving as the primary external financing method. Financial institutions, including commercial banks, aggregate idle funds from society as savings, thus forming industrial capital to support green projects and industries in alignment with national policy directives. Consequently, this process reduces the cost of raising funds for green industries, effectively facilitating their development. To optimize investments and mobilize savings, commercial banks strategically introduce various distinctive green financial instruments and green financing products. Moreover, this approach concurrently safeguards and diversifies market risks while fully harnessing financial capital to propel the optimization of the industrial structure.
(2) Capital Direction Mechanism: Within this mechanism, capital direction entails both advocacy and correction mechanisms. Banking financial institutions possess the capacity to regulate the total supply and direction of credit. Employing interest rate mechanisms and tailored measures, these institutions foster growth in specific sectors while restraining expansion in others. This guides the flow of capital, direct ing relatively lower-cost funds towards green industries and higher-cost funds towards high-pollution industries. To control and limit financing for “two-high”, and overcapacity industries, commercial banks implement high-interest-rate credit policies, while for energy-saving, environmentally-friendly, and high-tech companies, low-interest-rate loan policies are adopted to reduce financing costs for green and high-tech industries. The aim is to encourage more companies to participate in the green industry actively, while compelling polluting industries to relax, restructure, and contribute to the development of the industrial structure, ultimately optimizing it. Additionally, due to industrial externalities, certain environmental industries may not yield short-term profits. Hence, government intervention through advocating policy-based green loans in financial institutions or providing loans through policy banks (e.g., China Development Bank) is crucial to correct market mechanisms. Under the capital direction mechanism, capital gradually withdraws from “two-high”, and overcapacity industries, and instead, flows into green and environmental industries. The economies of scale in these industries become evident with continuous capital investment, further propelling the rationalization of the whole industry.
(3) Feedback and Credit Generation Mechanism: The increasing transition of China’s primary industries from the first sector to the second and third sectors corresponds to rising reliance on bank credit. In turn, the prosperity stemming from the development of these second and third industries exerts positive feedback on funds of credit obtained from banks, establishing a constructive feedback loop mechanism between the development of these industries and credit funds. GCP plays an active role in fostering the formation of this positive feedback loop mechanism. The core of the credit generation mechanism of GCP involves expediting capital formation and flow through the expansion of the quantity of money or credit creation. This facilitates the provision of necessary production capital for enterprise development and promotes the shift of production resources from traditional dominant industries to emerging ones. Consequently, it preserves production resources, enhances their utilization efficiency, further explores potential resources, and ultimately accomplishes the adjustment of the industrial structure and an augmentation of the overall economic scale. Capital, influenced by the credit generation mechanism, not only extensively invests in industries capable of generating substantial benefits but also perceives returns on capital appreciation as the benchmark for capital investment. Furthermore, the recent emphasis on promoting low-carbon and environmentally-friendly concepts has led to investments in promising green and leading industries. Consequently, constructing a rational industrial structure using this approach can foster the green and sustainable development of the economy.
(1) Industrial Integration Mechanism: The implementation of GCP policies and the establishment of a green financial system has profound implications for the corporate governance structure, compelling companies to deviate from their traditional development patterns and adopt an industrial integration mechanism [8]. This mechanism aims to create sustainable competitive advantages by focusing on enterprises as the central point and reconfiguring capital groups based on diverse industries, regions, and ownership structures, leading to the emergence of dominant industries dominated by large enterprises. Consequently, companies seek more favorable development environments, and a comprehensive financial operation mechanism is essential in fulfilling this requirement. By expanding the range of industries, financial capital can enhance its market competitiveness, directing an increased flow of capital towards competitive sectors. Presently, under the guidance of national policies, the green industry continues to expand and integrate with modern service and traditional industries, optimizing the allocation of production factors and guiding resources towards eco-friendly endeavors. This process leads to an expansion in the scale of the green industry, thereby propelling the development of the entire industrial structure in an environmentally sustainable manner.
In summary, the focus on green capital and GCP plays a pivotal role in directing social capital towards environmentally friendly, low-carbon, and green industries, as facilitated by the implementation of GCP policies and the establishment of a green financial system. Moreover, GCP stimulates technological advancements in traditional industries while increasing funding opportunities for emerging sectors. The influence of GCP on the industrial structure manifests in two significant aspects: industrial upgrading and industrial rationalization.
Industrial upgrading involves a comprehensive transformation from the primary industry to the secondary industry and eventually to the tertiary industry, driving a shift from low-end to high-end production and transitioning from low value-added to high value-added products with increased innovation levels. GCP effectively channels savings towards investments, providing substantial support to the development of green industries, encouraging technological transformations, and promoting the production of eco-friendly goods while discouraging “two-high” industries. This favorable financial cycle, enabled by institutions such as banks, directs production factors towards competitive industries until they attain dominant positions. As a result, GCP fosters the growth of local industries, propelling them from the primary industry to the secondary industry and finally to the tertiary industry, thus facilitating the upgrading of the industrial structure.
Furthermore, the impact of GCP on the industrial structure is evident in its ability to promote industrial rationalization. By clearly identifying target industries for future development, the policy of GCP reduces investments in environmentally detrimental sectors while increasing financing for eco-friendly alternatives. As a consequence, “two-high” industries face cost pressures, compelling them to upgrade internal technologies and adjust their structures to achieve sustainable development, leading to improved coordination among industries.
With the support of capital resources, the growth of green industries generates economies of scale and encourages the concentration of resources, goods, and technologies in competitive sectors, resulting in spatial agglomeration effects. Consequently, resources are allocated more efficiently among industries, leading to a higher level of industrial rationalization.
According to the aforementioned analysis, this paper proposes two hypotheses:
• Hypothesis 1: GCP fosters the improvement of local industries, driving them from the primary industry to the secondary industry, and ultimately to the tertiary industry, thus facilitating the upgrading of the industrial structure [9].
• Hypothesis 2: GCP optimizes the allocation of local resources, promoting industry coordination, and consequently increasing the level of industrial rationalization.
2.2. Research Design
2.2.1. Model Specification
Here we introduce two variables. One is industrial structure supererogation (ISS) to measure the upgrading level of the industry with the ratio of output value between the tertiary industry and the secondary industry while the other is industrial structure rationalization (ISR) measuring the rationalization of industry structure, with their formulas displayed as follows:
\( {ISS_{it}}={α_{1}}+{β_{1}} {GRE_{it}}+\sum {β_{1}} {X_{it}}+{u_{it}} \) (1)
\( {ISR_{it}}={α_{1}}+{β_{1}} {GRE_{it}}+\sum {β_{1}} {X_{it}}+{u_{it}} \) (2)
Where in Formula (1) and Formula (2), ISSit and ISRit represent the dependent variables denoting the ISS and ISR of the ith province in the tth year, respectively, with i ranging from 1 to 30, and t representing the year. The disturbance term varies with individuals and time.
2.2.2. Sample Selection
We collected and organized pertinent indicators from 2006 to 2016 from 30 provinces in China, excluding the Tibet Autonomous Region, resulting in a total of 330 valid samples. The data utilized in this research were sourced from various official publications, including the China Statistical Yearbook (2007-2017), the China Industry Statistical Yearbook, the National Bureau of Statistics, statistical yearbooks of individual provinces and cities, as well as the respective Bureaus of Statistics. For consistency, all data pertaining to the US dollar were converted using the average exchange rate of RMB against the US dollar for the corresponding year.
2.2.3. Descriptive Statistics
Descriptive statistics of the variables are presented in Table 1. The mean value of ISS is 1.0711, indicating a higher growth rate of the tertiary industry’s output value compared to the secondary industry, on average (proof of Hypothesis 2). Additionally, the mean value of ISR is 0.2487, suggesting a reasonable overall industrial structure in China (proof of Hypothesis 1).
Table 1: Descriptive statistics.
Variables | Mean value | Standard deviation | Minimum value | Maximum value |
ISS | 1.0711 | 0.5377 | 0.5531 | 4.1554 |
ISR | 0.2487 | 0.1554 | 0.0178 | 0.7658 |
3. GCP and Corporate Performance
The influence of GCP on companies extends beyond the realm of industrial structure and permeates into the domain of firm performance. GCP, as a critical component of environmental regulation, exerts its impact on companies by effecting changes in capital stock and capital flow (suggested by the former section. The allocation of GCP entails a shift in the availability and accessibility of financial resources, which subsequently influences the strategic decisions and operational capacities of companies within various industries [10]. These effects from industrial structure to firm performance unveil the intricate interplay between environmental financial mechanisms and corporate behaviors [11]. As companies respond to the incentives and constraints presented by GCP policies, their performance is inevitably shaped and molded, leading to a nuanced exploration of the potential “penalty effect” and the broader implications for sustainable economic development. In this section, we delve into the multifaceted dimensions of firm performance, examining whether GCP catalyzes transformations in companies’ ecological practices, financial health, and market competitiveness. By elucidating the intricate connections between GCP and firm performance, we contribute to a more comprehensive understanding of the mechanisms through which environmental policies intersect with corporate realities.
3.1. Theoretical Analysis and Research Hypotheses
Strategic environmental regulations are pivotal for achieving a balanced synergy between economic growth and environmental well-being. They motivate businesses to proactively reduce emissions, adopt sustainable practices, and drive lasting economic prosperity.
The “Equator Principle” introduced in October 2002, exemplifies a pivotal milestone in this context, mandating financial institutions to consider a firm’s environmental and social responsibilities when making lending decisions. Consequently, the concept of “GCP” has emerged as an indispensable component of government environmental regulation. GCP necessitates a meticulous evaluation of project-related information and operational practices of corporations by banks before extending loans. Given their pivotal role as financing sources for firms, banks assume a supervisory function, exerting influence over borrower behavior through debt contracts and their execution.
The enforcement of the GCP delivers several advantages to banks and the broader economy. Firstly, it empowers financial institutions to mitigate environmental risks associated with lending to firms, encompassing direct risks, indirect default risks, and reputational risks linked to environmental concerns. By optimizing their credit structures and minimizing loan risks, banks contribute to safeguarding both their interests and the social environment.
Secondly, the GCP compels banks to prioritize lending to environmentally friendly projects while restricting funding for ventures with high pollution levels. This applies environmental pressure on corporations, motivating them to adopt eco-friendly practices. Corporations that secure GCP can signal their commitment to environmentally responsible management to the market, leading to heightened market expectations, increased investor interest, and potential tax incentives.
Tailoring credit services to individual firms enables banks to manage fund allocation, restrain support for environmentally detrimental projects, and facilitate the shift toward a sustainable industrial structure and economic growth.
While most research has centered on GCP's influence on firms' investment and financing, scant attention has been devoted to its possible 'penalty effect' on firm performance. Financial institutions can exercise their authority to restrict or deny loans to heavily polluting enterprises, resulting in punitive outcomes. This limited access to financial resources may compel these companies to reduce their production investments and scale, thereby influencing their overall performance.
In light of the aforementioned considerations, we assume three hypotheses. Firstly, H1: The GCP negatively affects the performance of heavily polluting firms [12]. Moreover, the impact of the GCP on firm performance is likely to be more pronounced for State-Owned Enterprises (SOEs) and large corporations due to their comparatively greater access to credit and government support (H2) [13].
In conclusion, companies under increased external scrutiny, such as those with greater institutional ownership and analyst attention, could potentially demonstrate a heightened level of responsiveness to GCP advocacy, leading to a subsequent reduction in their pollution-related activities (H3) [14].
3.2. Model Establishment
This study drew its data from the CSMAR database, specifically focusing on Chinese A-share listed companies during the 2008 to 2015 timeframe. To ensure the trustworthiness and precision of the results, we diligently removed data outliers and addressed missing values prior to analysis. Consistent with existing research practices, we will evaluate firm performance using three vital metrics: Return on Assets (ROA), Return on Equity (ROE), and Tobin’s Q.
ROA and ROE serve as essential financial return metrics, enabling an evaluation of enterprises’ operational efficiency and profitability. Complementing these measures, Tobin’s Q offers insights into both the present financial performance and the anticipated future earnings of firms. Such comprehensive performance indicators will enable a robust assessment of the impact of GCP on companies and facilitate a nuanced understanding of their economic achievements and prospects during the studied period.
\( {Performance_{i, t}}={β_{0}}+{β_{1}} {Post_{t}} × {Treat_{i}}+{β_{2}} {Post_{t}}+{β_{3}} {Treat_{i}}+\sum {γ_{k}} {Controlk_{k,i,t}}+\sum Industry+\sum Year+{∈_{i,t}} \) (3)
Where:
• Performancei,t represents the proxies of firm performance for the firm “i” at the time “t”, measured by ROA, ROE, and Tobin’s Q altogether.
• Postt is the time dummy variable, and Treati is the grouping variable indicating treatment status.
• Controlki,t represents the various control variables that may affect firm performance, including firm size Sizei,t, leverage ratio LEVi,t, intangible asset ratio IAi,t, capital intensity CIi,t, senior executives’ shareholding MHi,t, firm age Agei,t, fixed assets ratio FAi,t, and Senior management team size MSizei,t.
• β1, β2, β3, and γk are the coefficients to be estimated.
3.3. Descriptive Statistics
The key variables considered in this analysis are ROAi,t, ROEi,t, and TobinQi,t. The mean values of these variables are presented in Table 2. The mean values for ROAi,t, and ROEi,t are found to be 0.049 and 0.087, respectively. Meanwhile, TobinQi,t has a mean of 2.356 with a standard deviation of 1.923, indicating substantial variability in TobinQi,t among the sample firms. Furthermore, the average value of the treatment variable, Treati, is 0.387, which indicates that the firms in the treated group constitute approximately 38.7% of the total sample. These results imply that Chinese firms’ performance exhibits heterogeneity.
Table 2: Descriptive statistics.
Variables | N | Mean | Std. dev. | 25th | Median | 75th |
ROAi,t | 7149 | 0.049 | 0.045 | 0.019 | 0.042 | 0.078 |
ROEi,t | 7149 | 0.087 | 0.078 | 0.049 | 0.088 | 0.131 |
TobinQi,t | 7149 | 2.356 | 1.923 | 1.067 | 1.829 | 3.012 |
Postt | 7149 | 0.649 | 0.465 | 0.000 | 1.000 | 1.000 |
Treati | 7149 | 0.387 | 0.435 | 0.000 | 0.000 | 1.000 |
Sizei,t | 7149 | 22.03 | 1.267 | 21.15 | 21.720 | 22.211 |
LEVi,t | 7149 | 0.368 | 0.212 | 0.239 | 0.353 | 0.513 |
IAi,t | 7149 | 0.044 | 0.041 | 0.019 | 0.039 | 0.062 |
CIi,t | 7149 | 12.12 | 1.086 | 11.87 | 12.42 | 13.15 |
MHi,t | 7149 | 0.164 | 0.222 | 0.000 | 0.017 | 0.323 |
Agei,t | 7149 | 1.676 | 0.619 | 1.132 | 1.612 | 2.176 |
FAi,t | 7149 | 0.223 | 0.121 | 0.121 | 0.223 | 0.327 |
Msizei,t | 7149 | 1.849 | 0.339 | 1.608 | 1.793 | 2.077 |
(1) Verification of H1: “Penalty Effect” on Firm Performance: Moving on to the correlation analysis, Table 3 provides the Spearman and Pearson correlation coefficients between the key variables and the treatment variable, Postt×Treati. The correlation coefficients for ROAi,t and Postt Treati are found to be -0.031 and -0.027, respectively. Similarly, for ROEi,t and Postt×Treati, the coefficients are -0.085 and -0.083, while for Tobini,t and Postt×Treati, the coefficients are -0.058 and -0.072. All these correlation coefficients are statistically significant.
The results from the correlation analysis support the hypothesis that GCP has a negative impact on firm performance. Specifically, the negative coefficients indicate that as the intensity of GCP increases, the firm’s performance tends to decrease. These findings lend dominant support to our hypothesis (H1) that GCP negatively affects firm performance.
Table 3: Spearman (upper) and pearson (lower) correlation coefficients.
ROAi,t | ROEi,t | TobinQi,t | PosttTreati | Postt | Treati | Sizei,t | LEVi,t | IAi,t | CIi,t | MHi,t | Agei,t | FAi,t | Msizei,t | |
ROAi,t | 0.798 | 0.431 | -0.031 | -0.037 | -0.018 | -0.123 | -0.411 | -0.021 | -0.224 | 0.157 | -0.167 | -0.183 | -0.011 | |
ROEi,t | 0.788 | 0.245 | -0.085 | -0.133 | -0.012 | 0.122 | -0.041 | -0.053 | -0.203 | 0.023 | -0.023 | -0.194 | 0.089 | |
TobinQi,t | 0.379 | 0.232 | -0.058 | 0.061 | -0.078 | -0.538 | -0.523 | 0.064 | -0.323 | 0.332 | -0.244 | -0.244 | -0.178 | |
PosttTreati | -0.027 | -0.083 | -0.072 | 0.322 | 0.714 | 0.110 | -0.006 | 0.116 | 0.225 | 0.010 | 0.122 | 0.208 | 0.007 | |
Postt | -0.048 | -0.138 | 0.076 | 0.390 | -0.045 | 0.091 | -0.033 | 0.079 | 0.021 | 0.221 | 0.091 | -0.101 | 0.023 | |
Treati | 0.012 | -0.010 | -0.081 | 0.714 | -0.045 | 0.113 | 0.036 | 0.108 | 0.269 | -0.122 | 0.115 | 0.337 | 0.009 | |
Sizei,t | 0.080 | 0.094 | -0.425 | 0.096 | 0.068 | 0.105 | 0.509 | -0.037 | 0.302 | -0.383 | 0.445 | 0.097 | 0.306 | |
LEVi,t | -0.388 | -0.077 | -0.432 | -0.005 | -0.028 | 0.033 | 0.489 | -0.037 | 0.201 | -0.299 | 0.367 | 0.157 | 0.211 | |
IAi,t | -0.016 | -0.030 | -0.025 | 0.055 | 0.026 | 0.033 | 0.043 | 0.003 | 0.077 | -0.004 | 0.033 | 0.194 | 0.008 | |
CIi,t | -0.187 | -0.166 | -0.274 | 0.216 | 0.017 | 0.250 | 0.359 | 0.218 | 0.074 | -0.243 | 0.203 | 0.643 | 0.048 | |
MHi,t | 0.099 | 0.000 | 0.272 | 0.008 | 0.168 | -0.089 | -0.371 | -0.307 | -0.074 | -0.225 | -0.462 | -0.263 | -0.082 | |
Agei,t | -0.114 | 0.000 | -0.164 | 0.128 | 0.108 | 0.121 | 0.391 | 0.363 | 0.102 | 0.223 | -0.463 | 0.172 | 0.094 | |
FAi,t | -0.168 | -0.193 | -0.247 | 0.175 | -0.106 | 0.317 | 0.178 | 0.178 | 0.052 | 0.659 | -0.250 | 0.205 | -0.015 | |
Msizei,t | 0.008 | 0.094 | -0.128 | -0.009 | 0.022 | 0.002 | 0.305 | 0.207 | 0.004 | 0.056 | -0.077 | 0.084 | -0.001 |
(2) Analysis of H2: The Impact on Property Rights and Firm Size: To assess the effect of GCP on different types of companies, we examine State-Owned Enterprises (SOEs) and large-cap firms in comparison to non-SOEs and small-cap firms (Table 4 and 5). The analysis reveals that for SOEs and large-cap firms, the coefficients of PosttTreati are significantly negative. This indicates that the implementation of the GCP has a more pronounced negative influence on these entities.
A plausible explanation for this phenomenon is that State-Owned Enterprises and large-cap firms possess greater ease in securing credit funds through financial institutions. This is due to their established commercial credit and favorable reputation, enabling them to navigate the financial system more effectively. Consequently, these companies are more affected by the “penalty effect” of the GCP, leading to a notable impact on their performance.
On the contrary, the coefficients of PosttTreati are found to be statistically insignificant for non-SOEs and small-cap firms. These results suggest that these types of companies might face relatively fewer constraints in accessing credit funds, and hence, the GCP’s impact on their performance is not as pronounced.
Table 4: The conditional relationship of firm characteristics: influence of firm size.
Dependent variable | SOEs | Non-SOEs | ||||
ROAi,t | ROEi,t | TobinQi,t | ROAi,t | ROEi,t | TobinQi,t | |
Postt * T'reati | -0.985*** | 0.554*** | -0.293*** | 0.602 | 0.494 | -1.993 |
(-7.442) | (-5.743) | (-6.082) | (2.303) | (1.547) | (-0.749) | |
Postt | 0.414* | -0.670*** | 2.100*** | 0.155*** | -0.073*** | 1.917* |
(-2.098) | (-4.203) | (14.704) | (-4.786) | (-8.759) | (1.535) | |
Treati | -0.553** | -0.015 | 0.202 | -0.628** | -0.264 | 0.936 |
(1.302) | (0.691) | (0.271) | (1.211) | (1.146) | (1.600) | |
Sizei,t | 0.033*** | 0.408*** | -0.569*** | -0.939*** | 0.665*** | -0.577*** |
(3.996) | (5.735) | (-12.116) | (9.356) | (12.422) | (-8.342) | |
LEVi,t | 0.833*** | -0.552*** | -1.666*** | -0.145*** | -0.848*** | 0.003 |
(-17.350) | (-7.052) | (-9.308) | (-19.214) | (-6.427) | (-0.818) | |
IAi,t | 0.186* | -0.580 | -0.861 | 0.363*** | 0.241*** | -3.247 |
(-0.720) | (-1.874) | (0.588) | (-2.420) | (-3.573) | (-0.900) | |
CIi,t | 0.917 | -0.920** | 0.440* | -0.485*** | -0.224*** | -0.109 |
(-1.058) | (-2.253) | (-2.465) | (-6.061) | (-4.902) | (-1.348) | |
MHi,t | 0.947** | 0.125** | 2.593** | -0.648** | 1.005*** | -0.158 |
(3.006) | (2.143) | (1.403) | (2.058) | (3.068) | (-0.038) | |
Agei,t | -0.906* | 0.243 | -0.621*** | 0.707 | -0.233 | 0.493*** |
(-1.761) | (0.106) | (-2.291) | (0.781) | (1.007) | (4.887) | |
FAi,t | 0.766*** | -0.668*** | -0.842*** | -0.001*** | -0.086*** | -0.757 |
(-5.088) | (-4.574) | (-3.212) | (-2.842) | (-5.674) | (-0.719) | |
Msizei,t | 0.674** | -0.449** | -0.810 | -0.078*** | 0.006*** | -0.606 |
(3.277) | (2.789) | (-0.316) | (3.504) | (2.182) | (-1.154) | |
Constant | 0.596 | -0.889** | 12.299*** | -0.854*** | -0.112*** | 1.973*** |
(-0.897) | (-2.265) | (15.275) | (-1.948) | (-6.267) | (8.918) | |
Industry FE | Yes | Yes | Yes | Yes | Yes | Yes |
Year FE | Yes | Yes | Yes | Yes | Yes | Yes |
Observations | 2483 | 2483 | 2483 | 4642 | 4642 | 4642 |
Adjusted R2 | 0.176 | 0.142 | 0.339 | 0.080 | 0.100 | 0.286 |
Table 5: The conditional relationship of firm characteristics: effect of state ownership.
Dependent variable | Large-cap | Small-cap | ||||
ROAi,t | ROEi,t | TobinQi,t | ROAi,t | ROEi,t | TobinQi,t | |
Postt * T'reati | -0.006*** | -0.024*** | -0.283*** | -0.008 | 0.002 | -0.664 |
(-3.153) | (-3.098) | (-5.165) | (0.495) | (0.182) | (-0.752) | |
Postt | -0.002*** | -0.055*** | 1.280*** | -0.015** | -0.021*** | 3.509** |
(-2.967) | (-7.132) | (15.715) | (-2.455) | (-3.490) | (2.395) | |
Treati | 0.004* | -0.004 | 0.186* | 0.002*** | 0.011** | 0.529 |
(1.710) | (0.741) | (1.915) | (2.937) | (2.510) | (0.762) | |
Sizei,t | 0.005*** | 0.021*** | -0.433*** | 0.008*** | 0.024*** | -2.276*** |
(5.003) | (6.446) | (-14.665) | (4.048) | (7.383) | (-8.664) | |
LEVi,t | -0.098*** | -0.065*** | -0.906*** | -0.071*** | -0.059*** | -0.410 |
(-20.620) | (-6.213) | (-7.751) | (-14.849) | (-6.147) | (-0.510) | |
IAi,t | -0.049** | -0.074* | -0.285 | -0.033* | -0.085*** | -3.130 |
(-2.535) | (-1.913) | (-0.589) | (-1.706) | (-2.590) | (-1.049) | |
CIi,t | -0.007*** | -0.003*** | -0.122*** | -0.016*** | -0.017*** | -0.230 |
(-3.397) | (-4.186) | (-4.077) | (-4.637) | (-4.231) | (-1.338) | |
MHi,t | 0.011 | 0.032* | 0.434** | 0.025*** | 0.030*** | -0.102 |
(1.249) | (1.699) | (2.310) | (3.430) | (4.183) | (-0.209) | |
Agei,t | 0.007 | -0.001 | -0.097* | -0.007** | -0.009 | 1.631*** |
(0.506) | (1.062) | (-1.748) | (-2.036) | (-1.314) | (5.106) | |
FAi,t | -0.040*** | -0.095*** | -0.580*** | -0.029** | -0.057*** | -2.032* |
(-4.886) | (-6.235) | (-2.899) | (-2.218) | (-3.668) | (-1.664) | |
Msizei,t | 0.011*** | 0.011*** | -0.039 | -0.007 | -0.002 | -0.600 |
(3.392) | (3.746) | (-0.705) | (0.432) | (0.346) | (-1.493) | |
Constant | 0.010 | -0.108* | 13.682*** | -0.025 | -0.296*** | 0.478*** |
(0.014) | (-1.849) | (9.134) | (-0.618) | (-4.580) | (8.712) | |
Industry FE | Yes | Yes | Yes | Yes | Yes | Yes |
Year FE | Yes | Yes | Yes | Yes | Yes | Yes |
Observations | 3532 | 3532 | 3532 | 3512 | 3512 | 3512 |
Adjusted R2 | 0.132 | 0.136 | 0.344 | 0.104 | 0.086 | 0.362 |
The observed outcomes lend support to Hypothesis 2, indicating that the GCP primarily affects State-Owned Enterprises and larger-cap firms, while its influence on non-SOEs and smaller-cap firms is comparatively limited.
(3) Analysis of H3: The Influence of External Supervision on GCP: Next, we investigate the role of external supervision, as manifested through institutional ownership and analyst coverage, on the relationship between GCP and corporate performance. Tables 6 and 7 present the results from the subsample analysis.
Upon closer scrutiny, it becomes apparent that within subsamples characterized by elevated institutional ownership and substantial analyst followings, the GCP coefficients show a notable negative trend. This indicates that firms under heightened external oversight are increasingly inclined to acknowledge the enduring benefits associated with environmental conservation efforts.
The presence of substantial institutional ownership and analyst coverage enhances companies’ sensitivity to environmental issues, prompting them to align their practices with the principles of the GCP. As a result, these companies are more inclined to adopt measures to reduce pollution-intensive activities and embrace environmentally friendly practices.
The empirical findings strongly support Hypothesis 3, revealing that the influence of GCP on firm performance is particularly prominent for companies subject to higher levels of external supervision.
In conclusion, the empirical analysis provides valuable insights into the influence of GCP on corporate performance. The results suggest that the policy’s impact varies based on company characteristics, with State-Owned Enterprises and large-cap firms being more affected compared to non-SOEs and small-cap firms. Furthermore, the presence of external supervision in the form of institutional ownership and analyst coverage plays a significant role in shaping companies’ response to the GCP, further reinforcing its positive influence on corporate performance.
Table 6: The conditional relationship of monitoring mechanisms: effects of institutional ownership.
Dependent variable | High institutional ownership | Low institutional ownership | ||||
ROAi,t | ROEi,t | TobinQi,t | ROAi,t | ROEi,t | TobinQi,t | |
Postt * T'reati | -0.008*** | -0.027*** | -0.375*** | 0.002 | 0.000 | -0.425 |
(-4.616) | (-4.200) | (-5.539) | (1.520) | (1.446) | (-0.496) | |
Postt | -0.008*** | -0.047*** | 1.751*** | -0.016*** | -0.029*** | 3.804*** |
(-3.314) | (-7.232) | (17.027) | (-3.539) | (-3.939) | (2.611) | |
Treati | 0.021*** | 0.013** | 0.196 | 0.006 | 0.006 | 0.287 |
(3.148) | (2.070) | (1.603) | (0.787) | (0.166) | (0.414) | |
Sizei,t | 0.003*** | 0.020*** | -0.559*** | -0.002*** | 0.029*** | -1.154*** |
(4.549) | (6.669) | (-16.004) | (5.350) | (9.171) | (-7.488) | |
LEVi,t | -0.103*** | -0.064*** | -1.024*** | -0.085*** | -0.065*** | 0.121 |
(-18.950) | (-6.012) | (-6.816) | (-12.259) | (-6.614) | (0.170) | |
IAi,t | -0.055*** | -0.080** | -1.175** | 0.002 | -0.050 | -1.515 |
(-2.986) | (-2.253) | (-2.002) | (-0.168) | (-1.190) | (-0.534) | |
CIi,t | -0.008*** | -0.012*** | -0.051 | 0.001*** | -0.009*** | -0.194 |
(-3.229) | (-4.743) | (-1.262) | (-3.864) | (-3.461) | (-1.274) | |
MHi,t | 0.064*** | 0.106*** | 2.459*** | 0.011*** | 0.043*** | 0.060 |
(5.434) | (5.506) | (7.533) | (3.176) | (5.205) | (0.136) | |
Agei,t | 0.005 | 0.010 | 0.075 | 0.002** | -0.002 | 1.766*** |
(0.491) | (1.545) | (1.209) | (-2.514) | (-1.149) | (5.655) | |
FAi,t | -0.029*** | -0.080*** | -0.771*** | -0.023* | -0.091*** | -1.109 |
(-4.448) | (-5.359) | (-3.123) | (-1.863) | (-5.847) | (-0.976) | |
Msizei,t | 0.005*** | 0.022*** | 0.077 | 0.002** | -0.001 | -0.568 |
(2.983) | (3.916) | (1.028) | (2.010) | (1.218) | (-1.595) | |
Constant | 0.024 | -0.036 | 14.610*** | -0.024 | -0.303*** | 23.441*** |
(0.965) | (-0.933) | (17.787) | (-0.926) | (-6.223) | (6.624) | |
Industry FE | Yes | Yes | Yes | Yes | Yes | Yes |
Year FE | Yes | Yes | Yes | Yes | Yes | Yes |
Observations | 3545 | 3545 | 3545 | 3575 | 3575 | 3575 |
Adjusted R2 | 0.120 | 0.127 | 0.337 | 0.107 | 0.101 | 0.244 |
Table 7: The conditional relationship of firm characteristics: effects of analyst coverage.
Dependent variable | High analyst coverage | Low analyst coverage | ||||
ROAi,t | ROEi,t | TobinQi,t | ROAi,t | ROEi,t | TobinQi,t | |
Postt * T'reati | -0.014** | -0.009** | -0.287*** | 0.009 | 0.001 | -0.537 |
(-2.549) | (-1.978) | (-3.632) | (-0.246) | (-1.036) | (-0.670) | |
Postt | 0.006* | -0.018*** | 1.700*** | 0.008 | -0.007 | 2.869** |
(-1.938) | (-8.727) | (14.227) | (0.876) | (-0.286) | (2.212) | |
Treati | 0.021*** | 0.012 | 0.291** | 0.012** | 0.013 | 0.182 |
(4.077) | (1.511) | (2.246) | (2.036) | (1.605) | (0.302) | |
Sizei,t | -0.001*** | -0.002** | -0.570*** | 0.015*** | 0.016*** | -1.191*** |
(2.639) | (2.296) | (-13.739) | (4.213) | (4.266) | (-7.767) | |
LEVi,t | -0.114*** | -0.051*** | -0.839*** | -0.082*** | -0.065*** | 0.357 |
(-17.732) | (-5.618) | (-4.716) | (-16.542) | (-4.500) | (0.517) | |
IAi,t | -0.042** | -0.022 | -0.645 | -0.032* | -0.063 | -3.061 |
(-2.011) | (-0.975) | (-0.994) | (-1.784) | (-1.500) | (-1.144) | |
CIi,t | 0.003*** | -0.012*** | -0.041 | -0.005*** | 0.000** | -0.239 |
(-2.929) | (-4.270) | (-0.888) | (-4.291) | (-2.536) | (-1.610) | |
MHi,t | 0.003 | 0.001 | 0.580*** | 0.022*** | 0.022*** | -0.380 |
(-0.931) | (-0.120) | (2.661) | (2.628) | (2.622) | (-0.713) | |
Agei,t | -0.002 | -0.008 | 0.167** | -0.012*** | 0.000*** | 1.084*** |
(0.472) | (0.363) | (2.239) | (-3.763) | (-2.830) | (4.056) | |
FAi,t | -0.045*** | -0.070*** | -1.466*** | -0.011** | -0.068*** | -0.846 |
(-3.838) | (-5.548) | (-5.015) | (-2.571) | (-4.422) | (-0.781) | |
Msizei,t | 0.016** | 0.015*** | -0.083 | 0.014*** | 0.017** | -0.832** |
(2.056) | (3.050) | (-1.032) | (3.012) | (2.135) | (-2.326) | |
Constant | 0.092*** | 0.116*** | 15.245*** | -0.003 | -0.139** | 26.699*** |
(3.142) | (2.917) | (15.849) | (-0.087) | (-2.413) | (7.978) | |
Industry FE | Yes | Yes | Yes | Yes | Yes | Yes |
Year FE | Yes | Yes | Yes | Yes | Yes | Yes |
Observations | 3632 | 3632 | 3632 | 3522 | 3522 | 3522 |
Adjusted R2 | 0.077 | 0.090 | 0.319 | 0.126 | 0.109 | 0.277 |
4. Strategic Responses to GCP
In response to growing environmental concerns and the urgent need for sustainable development, governments and financial institutions worldwide have been implementing various policy measures to encourage environmentally responsible practices among businesses. In light of the GCP, companies have been prompted to explore innovative ways to align their operations with environmentally sustainable practices.
This section of the academic paper focuses on elucidating the multifaceted measures that companies have adopted in response to the GCP. These measures encompass a range of strategic responses aimed at enhancing both ecological stewardship and corporate performance. The three main angles of investigation include Greening the Supply Chain, Investment Decision-Making, and Green Innovation in Heavily Polluting Enterprises (HPEs).
The exploration of these measures is essential to comprehend the overall impact of the GCP on corporate behavior and performance. Understanding how companies have strategically adapted their operations and management practices will provide valuable insights into the policy’s effectiveness and its implications for sustainable business practices.
Throughout this section, we will delve into each of these angles and examine the implications of their adoption on companies’ industrial structure and performance. By investigating the multifaceted nature of companies’ responses to the GCP, this research contributes to the ongoing dialogue on fostering environmentally sustainable business practices and informs policymakers, investors, and stakeholders about the potential benefits and challenges associated with these strategic responses.
Overall, this section aims to shed light on the transformative influence of the GCP on companies’ approaches to sustainability, which, in turn, contributes to the broader discourse on achieving a greener and more sustainable economy.
4.1. Investment Decision-Making
The “Investment Decision-Making” aspect is a crucial research angle within the context of the GCP. This aspect explores how companies strategically allocate their financial resources to environmentally sustainable projects and initiatives in response to policy incentives. Investment decisions play a pivotal role in shaping companies’ industrial structure and, subsequently, their overall performance.
Companies operating under the GCP are prompted to assess their existing investment portfolios and consider reallocating capital towards environmentally friendly projects. This involves evaluating the potential risks and returns associated with green investments, as well as estimating the long-term environmental benefits and financial gains.
One of the primary implications of investment decision-making in response to the GCP is the transformation of companies’ industrial structures [15]. As firms prioritize investments in eco-friendly technologies, renewable energy, and environmentally responsible practices, they undergo a shift towards more sustainable and low-carbon operations. This change in industrial structure not only enhances companies’ environmental performance but also positions them favorably in the growing market for green products and services.
Furthermore, investment decision-making under the GCP influences firms’ overall financial performance [16]. While the short-term financial costs of implementing environmentally friendly projects may be substantial, the potential long-term benefits, such as reduced operational costs, enhanced brand reputation, and access to new markets, can yield significant financial advantages. Companies that strategically align their investment decisions with sustainability objectives are likely to experience improved financial resilience and competitive advantage.
Moreover, investment decision-making also has implications for companies’ relationships with financial institutions. As companies prioritize green investments, they may become more attractive to lenders and investors who prioritize sustainability and environmental responsibility. This can lead to increased access to GCP facilities and lower borrowing costs, further reinforcing companies’ ability to fund sustainable initiatives.
However, it is essential to acknowledge that investment decision-making under the GCP may pose challenges for certain firms, especially those operating in heavily polluting industries. Transitioning to sustainable practices may require significant upfront investments and operational adjustments, potentially impacting short-term profitability. Thus, companies need to carefully assess the trade-offs between short-term costs and long-term benefits to ensure a successful and sustainable transition.
In conclusion, the “Investment Decision-Making” aspect within the GCP context plays a pivotal role in shaping companies’ industrial structures and financial performance. By strategically reallocating capital to environmentally sustainable projects, companies can enhance their environmental performance, strengthen their financial resilience, and position themselves as leaders in the evolving market for sustainable products and services. However, navigating the challenges associated with this transition requires careful evaluation and a long-term perspective to ensure both environmental and financial success.
4.2. Green Innovation in Heavily Polluting Enterprises
The “Green Innovation in Heavily Polluting Enterprises” research angle examines the transformative role of innovation in mitigating the environmental impact of industries historically known for significant pollution. Under the influence of the GCP, heavily polluting enterprises (HPEs) are compelled to explore innovative solutions and technologies that promote eco-friendly practices, reduce emissions, and minimize their ecological footprint [17].
Green innovation in HPEs involves the development and implementation of sustainable technologies, processes, and products that align with the principles of environmental protection. This encompasses a wide array of initiatives, including the adoption of cleaner production methods, the integration of renewable energy sources, the implementation of waste reduction strategies, and the incorporation of circular economy principles.
One of the notable effects of green innovation in HPEs is the transformation of their industrial structure [18]. By actively embracing environmentally responsible practices and investing in sustainable technologies, HPEs can transition from being polluting entities to becoming eco-friendly and socially responsible organizations. This shift fosters a positive image among stakeholders, enhances their reputational capital, and attracts environmentally conscious investors and customers.
What’s more, green innovation in HPEs can significantly impact their overall business performance. Although initial investments in green technologies may impose short-term costs, the long-term benefits can be substantial. Reductions in resource consumption, lower waste disposal expenses, and improved energy efficiency can lead to enhanced cost-effectiveness and financial performance [18]. Additionally, green innovation can open up new market opportunities and expand the customer base, thus contributing to the long-term economic sustainability of HPEs.
From another aspect, adopting green innovation practices can also improve regulatory compliance for HPEs. As governments worldwide strengthen environmental regulations, HPEs that innovate and adopt sustainable practices are better positioned to meet stringent standards and avoid potential penalties and legal challenges. This compliance advantage further supports their operational stability and reputation in the industry.
Nonetheless, it is essential to of great significance to notice that green innovation in heavily polluting enterprises may encounter obstacles. Some HPEs may face technological barriers, high implementation costs, or resistance to change within their organizational culture. Therefore, successful green innovation initiatives require strong leadership commitment, collaboration with relevant stakeholders, and adequate financial support.
Consequently, the “Green Innovation in Heavily Polluting Enterprises” research angle reveals the profound impact of innovation in transforming HPEs into environmentally responsible and sustainable entities. By embracing green innovation practices, HPEs can effectively mitigate their ecological footprint, improve their industrial structure, and achieve better financial performance. Nevertheless, overcoming challenges and fostering a culture of sustainable innovation is essential for long-term success. The exploration of this angle sheds light on the potential of green innovation to revolutionize the industrial landscape and foster a more sustainable and environmentally conscious business environment.
4.3. Greening the Supply Chain
The research angle of “Greening the Supply Chain” delves into the strategic efforts undertaken by companies to incorporate environmentally sustainable practices throughout their supply chain operations. Under the purview of the GCP, businesses are incentivized to adopt greener sourcing, production, and distribution processes, leading to reduced environmental impacts across the entire supply chain [19].
Greening the supply chain involves several key initiatives, such as selecting eco-friendly suppliers, optimizing transportation methods to reduce carbon emissions, implementing energy-efficient production practices, and minimizing waste generation and disposal. By incorporating these sustainable practices, companies seek to create a more environmentally responsible supply chain that aligns with the principles of the GCP.
The impact of greening the supply chain on a company’s industrial structure is noteworthy. As companies actively promote sustainable practices throughout their supply chain, they become more aligned with the principles of environmental stewardship. This alignment fosters a positive corporate image and enhances brand reputation, positioning the company as a responsible and sustainable entity in the eyes of customers, investors, and other stakeholders.
Subsequently, greening the supply chain has a cascading effect on the overall business performance of companies. By reducing the environmental footprint associated with sourcing and production processes, companies can achieve cost savings through improved resource efficiency and waste reduction. Additionally, adopting energy-efficient transportation and distribution methods can lead to decreased logistics costs, thereby contributing to enhanced cost-effectiveness and profitability.
Another fact is that greening the supply chain can bolster companies’ resilience to regulatory changes and customer preferences. As environmental regulations become more stringent, companies with sustainable supply chains are better positioned to comply with evolving standards and avoid potential penalties. Additionally, environmentally conscious consumers are increasingly favoring products from companies with transparent and eco-friendly supply chains, which can lead to increased customer loyalty and market share.
It is not a shame to acknowledge that the process of greening the supply chain may pose challenges, particularly in complex and global supply networks. Implementing sustainable practices may require cooperation and collaboration with suppliers, contractors, and other stakeholders, necessitating a collective commitment to sustainability throughout the supply chain.
In conclusion, the “Greening the Supply Chain” research angle underscores the transformative potential of sustainable practices within the supply chain. By embracing greener sourcing, production, and distribution methods, companies can foster a more environmentally responsible industrial structure and strengthen their overall business performance. The integration of sustainable practices throughout the supply chain not only enhances companies’ reputation and market positioning but also contributes to cost savings and regulatory compliance.
5. Conclusion
This research comprehensively explored the influence of GCP on companies from multiple dimensions, shedding light on its impact on industrial structure, firm performance, and the measures adopted by companies in response to this policy. The findings of this study provide valuable insights into the complex relationship between GCP and its effects on companies.
Regarding the impact on industrial structure, the theoretical framework incorporating the Capital Direction Mechanism, Capital Formation Mechanism, Feedback and Credit Generation Mechanism, and Industrial Integration Mechanism demonstrated how GCP incentivizes companies to upgrade and rationalize their industrial structures. The empirical results confirmed that GCP plays a pivotal role in driving industrial upgrading and promoting a higher level of industrial rationalization.
Regarding firm performance, the theoretical analysis highlighted how GCP influences companies’ financial decisions and developmental directions, leading to varying effects on their overall performance. The empirical findings substantiated the hypothesis concerning GCP's "penalty effect" on firms with inferior environmental performance. Furthermore, the noteworthy influence of GCP on state-owned and large-scale enterprises, alongside companies under more robust external oversight, highlights the critical role these factors play in molding firms' reactions to the policy.
The measures adopted by companies in response to the GCP, including greening the supply chain, investment decision-making, and green innovation in heavily polluting enterprises, all contribute to shaping companies’ industrial structure and performance. Greening the supply chain enhances companies’ environmental responsibility and positively influences their reputational capital and brand image. Investment decision-making aligned with sustainability objectives improves companies’ financial performance and long-term economic sustainability. Green innovation drives the transformation of heavily polluting enterprises, fostering environmentally friendly practices and contributing to their overall business performance.
In conclusion, the findings of this study underscore the significance of the GCP in influencing companies’ industrial structure and performance. The integration of environmental considerations into companies’ strategic decision-making and operational practices is crucial for sustainable development. Policymakers can draw valuable insights from this research to further refine and optimize the GCP, facilitating the transition towards a greener and more sustainable economy.
Nevertheless, this research has certain limitations. The complexity of the GCP’s effects on various industries and companies calls for further investigation and analysis. Additionally, the study’s reliance on secondary data may introduce potential biases and constraints. Future research could employ more comprehensive data collection methods and explore other aspects, such as the social and environmental impacts of the GCP.
In light of the research findings, it is recommended that policymakers continue to foster an enabling environment for sustainable practices through targeted incentives and regulatory measures. Encouraging companies to adopt greener supply chain practices, align investment decisions with sustainability goals, and foster green innovation will undoubtedly contribute to a more sustainable and environmentally conscious business landscape.
Looking ahead, there remains substantial room for future research in this field. The dynamic and evolving nature of GCP warrants ongoing investigations to fully grasp its long-term effects on companies’ industrial structures and performance. By continually refining our understanding of the interactions between GCP and companies, researchers and policymakers can collectively contribute to the advancement of green economy initiatives and the global pursuit of sustainable development.
References
[1]. Wen, H., Lee, C.C. and Zhou, F. (2021) Green Credit Policy, Credit Allocation Efficiency and Upgrade of Energy-Intensive Enterprises. Energy Economics, 94, 105099.
[2]. Lv, C., Fan, J. and Lee, C.C. (2023) Can Green Credit Policies Improve Corporate Green Production Efficiency? Journal of Cleaner Production, 397, 136573.
[3]. Qiu, Y., Wang, H. and Wu, J. (2023) Impact of Industrial Structure Upgrading on Green Innovation: Evidence from Chinese Cities. Environmental Science and Pollution Research, 30, 3887–3900.
[4]. Gu, R., Li, C., Li, D., Yang, Y. and Gu, S. (2022) The Impact of Rationalization and Upgrading of Industrial Structure on Carbon Emissions in the Beijing-Tianjin-Hebei Urban Agglomeration. International Journal of Environmental Research and Public Health, 19, 7997.
[5]. Petersen, M.A. and Schoeman, I. (2008) Modeling of Banking Profit Via Return-on-Assets and Return-on-Equity. Proceedings of the World Congress on Engineering, 2, 12–37.
[6]. Wolfe, J. and Sauaia, A.C.A. (2003) The Tobin Q as a Company Performance Indicator. Developments in Business Simulation and Experiential Learning: Proceedings of the Annual ABSEL Conference, 30.
[7]. Wang, Y., Lei, X., Zhao, D., Long, R. and Wu, M. (2021) The Dual Impacts of Green Credit on Economy and Environment: Evidence from China. Sustainability, 13, 4574.
[8]. Lu, Y. (2016) Industrial Integration: A Literature Review. Journal of Industrial Integration and Management, 1, 1650007.
[9]. Zhu, X. (2022) Does Green Credit Promote Industrial Upgrading? — Analysis of Mediating Effects Based on Technological Innovation. Environmental Science and Pollution Research, 29, 41577–41589.
[10]. Yin, W., Zhu, Z., Kirkulak-Uludag, B. and Zhu, Y. (2021) The Determinants of Green Credit and Its Impact on the Performance of Chinese Banks. Journal of Cleaner Production, 286, 124991.
[11]. Cui, X., Wang, P., Sensoy, A., Nguyen, D.K. and Pan, Y. (2022) Green Credit Policy and Corporate Productivity: Evidence from a Quasi-Natural Experiment in China. Technological Forecasting and Social Change, 177, 121516.
[12]. Jiang, Y., Qin, S. and Xu, Y. (2022) Impact of Green Credit Policy on Sustainability Performance of High-Pollution Enterprises. Environmental Science and Pollution Research, 29, 79199–79213.
[13]. Ding, X., Jing, R., Wu, K., Petrovskaya, M.V., Li, Z., Steblyanskaya, A., Ye, L., Wang, X. and Makarov, V.M. (2022) The Impact Mechanism of Green Credit Policy on the Sustainability Performance of Heavily Polluting Enterprises—Based on the Perspectives of Technological Innovation Level and Credit Resource Allocation. International Journal of Environmental Research and Public Health, 19, 14518.
[14]. Xi, B., Wang, Y. and Yang, M. (2022) Green Credit, Green Reputation, and Corporate Financial Performance: Evidence from China. Environmental Science and Pollution Research, 29, 2401–2419.
[15]. Ling, X., Yan, L. and Dai, D. (2022) Green Credit Policy and Investment Decisions: Evidence from China. Sustainability, 14, 7088.
[16]. Wang, E., Liu, X., Wu, J. and Cai, D. (2019) Green Credit, Debt Maturity, and Corporate Investment—Evidence from China. Sustainability, 11, 583.
[17]. Chen, Z., Zhang, Y., Wang, H., Ouyang, X. and Xie, Y. (2022) Can Green Credit Policy Promote Low-Carbon Technology Innovation? Journal of cleaner production, 359, 132061.
[18]. Zhang, Y., Li, X. and Xing, C. (2022) How Does China’s Green Credit Policy Affect the Green Innovation of High Polluting Enterprises? The Perspective of Radical and Incremental Innovations. Journal of Cleaner Production, 336, 130387.
[19]. An, S., Li, B., Song, D. and Chen, X. (2021) Green Credit Financing Versus Trade Credit Financing in a Supply Chain with Carbon Emission Limits. European Journal of Operational Research, 292, 125–142.
Cite this article
Weng,Y. (2024). Research Advanced on the Influence of Green Credit Policy on Companies: A Case Study of Industrial Structure, Firm Performance, and Response Measures. Advances in Economics, Management and Political Sciences,57,48-66.
Data availability
The datasets used and/or analyzed during the current study will be available from the authors upon reasonable request.
Disclaimer/Publisher's Note
The statements, opinions and data contained in all publications are solely those of the individual author(s) and contributor(s) and not of EWA Publishing and/or the editor(s). EWA Publishing and/or the editor(s) disclaim responsibility for any injury to people or property resulting from any ideas, methods, instructions or products referred to in the content.
About volume
Volume title: Proceedings of the 2nd International Conference on Financial Technology and Business Analysis
© 2024 by the author(s). Licensee EWA Publishing, Oxford, UK. This article is an open access article distributed under the terms and
conditions of the Creative Commons Attribution (CC BY) license. Authors who
publish this series agree to the following terms:
1. Authors retain copyright and grant the series right of first publication with the work simultaneously licensed under a Creative Commons
Attribution License that allows others to share the work with an acknowledgment of the work's authorship and initial publication in this
series.
2. Authors are able to enter into separate, additional contractual arrangements for the non-exclusive distribution of the series's published
version of the work (e.g., post it to an institutional repository or publish it in a book), with an acknowledgment of its initial
publication in this series.
3. Authors are permitted and encouraged to post their work online (e.g., in institutional repositories or on their website) prior to and
during the submission process, as it can lead to productive exchanges, as well as earlier and greater citation of published work (See
Open access policy for details).
References
[1]. Wen, H., Lee, C.C. and Zhou, F. (2021) Green Credit Policy, Credit Allocation Efficiency and Upgrade of Energy-Intensive Enterprises. Energy Economics, 94, 105099.
[2]. Lv, C., Fan, J. and Lee, C.C. (2023) Can Green Credit Policies Improve Corporate Green Production Efficiency? Journal of Cleaner Production, 397, 136573.
[3]. Qiu, Y., Wang, H. and Wu, J. (2023) Impact of Industrial Structure Upgrading on Green Innovation: Evidence from Chinese Cities. Environmental Science and Pollution Research, 30, 3887–3900.
[4]. Gu, R., Li, C., Li, D., Yang, Y. and Gu, S. (2022) The Impact of Rationalization and Upgrading of Industrial Structure on Carbon Emissions in the Beijing-Tianjin-Hebei Urban Agglomeration. International Journal of Environmental Research and Public Health, 19, 7997.
[5]. Petersen, M.A. and Schoeman, I. (2008) Modeling of Banking Profit Via Return-on-Assets and Return-on-Equity. Proceedings of the World Congress on Engineering, 2, 12–37.
[6]. Wolfe, J. and Sauaia, A.C.A. (2003) The Tobin Q as a Company Performance Indicator. Developments in Business Simulation and Experiential Learning: Proceedings of the Annual ABSEL Conference, 30.
[7]. Wang, Y., Lei, X., Zhao, D., Long, R. and Wu, M. (2021) The Dual Impacts of Green Credit on Economy and Environment: Evidence from China. Sustainability, 13, 4574.
[8]. Lu, Y. (2016) Industrial Integration: A Literature Review. Journal of Industrial Integration and Management, 1, 1650007.
[9]. Zhu, X. (2022) Does Green Credit Promote Industrial Upgrading? — Analysis of Mediating Effects Based on Technological Innovation. Environmental Science and Pollution Research, 29, 41577–41589.
[10]. Yin, W., Zhu, Z., Kirkulak-Uludag, B. and Zhu, Y. (2021) The Determinants of Green Credit and Its Impact on the Performance of Chinese Banks. Journal of Cleaner Production, 286, 124991.
[11]. Cui, X., Wang, P., Sensoy, A., Nguyen, D.K. and Pan, Y. (2022) Green Credit Policy and Corporate Productivity: Evidence from a Quasi-Natural Experiment in China. Technological Forecasting and Social Change, 177, 121516.
[12]. Jiang, Y., Qin, S. and Xu, Y. (2022) Impact of Green Credit Policy on Sustainability Performance of High-Pollution Enterprises. Environmental Science and Pollution Research, 29, 79199–79213.
[13]. Ding, X., Jing, R., Wu, K., Petrovskaya, M.V., Li, Z., Steblyanskaya, A., Ye, L., Wang, X. and Makarov, V.M. (2022) The Impact Mechanism of Green Credit Policy on the Sustainability Performance of Heavily Polluting Enterprises—Based on the Perspectives of Technological Innovation Level and Credit Resource Allocation. International Journal of Environmental Research and Public Health, 19, 14518.
[14]. Xi, B., Wang, Y. and Yang, M. (2022) Green Credit, Green Reputation, and Corporate Financial Performance: Evidence from China. Environmental Science and Pollution Research, 29, 2401–2419.
[15]. Ling, X., Yan, L. and Dai, D. (2022) Green Credit Policy and Investment Decisions: Evidence from China. Sustainability, 14, 7088.
[16]. Wang, E., Liu, X., Wu, J. and Cai, D. (2019) Green Credit, Debt Maturity, and Corporate Investment—Evidence from China. Sustainability, 11, 583.
[17]. Chen, Z., Zhang, Y., Wang, H., Ouyang, X. and Xie, Y. (2022) Can Green Credit Policy Promote Low-Carbon Technology Innovation? Journal of cleaner production, 359, 132061.
[18]. Zhang, Y., Li, X. and Xing, C. (2022) How Does China’s Green Credit Policy Affect the Green Innovation of High Polluting Enterprises? The Perspective of Radical and Incremental Innovations. Journal of Cleaner Production, 336, 130387.
[19]. An, S., Li, B., Song, D. and Chen, X. (2021) Green Credit Financing Versus Trade Credit Financing in a Supply Chain with Carbon Emission Limits. European Journal of Operational Research, 292, 125–142.