


1. Introduction
In sports, the performance of athletes and the high salaries of star athletes have always been hotly discussed topics among audiences. Therefore, it is also a common question about whether the performance of athletes and their wages match.
In the past, people may only be able to make some rough guesses about this kind of question. Still, in the era of big data, it has become possible to answer this question from a scientific point of view. The NBA (National Basketball Association), as one of the most successful sports leagues, is changing quickly with the rise of big data analytics [1].
The earliest prediction paper on NBA salary was proposed in 2000, but the prediction model at that time only involved three independent variables: rebounds, assists, and points [2]. For complex basketball games, the three-variable model is not convincing, so many researchers have tried to use more independent variables in the model. For example, in a recent study, Papadaki and Tsagris employed 54 variables to try to explain the relationship between wages and player performance [3]. However, there is a problem with it. For basketball data, many papers tend to pay more attention to numerical data such as points and relatively ignore category data such as position. In fact, the responsibilities of players in different positions are very different. For example, centers and power forwards pay more attention to rebounding and defense, small forwards and shooting guards pay more attention to offense, and point guards pay more attention to organization and passing. Therefore, it is necessary to classify players in different positions and build different models for players in different positions. Of course, some papers consider similar issues. In Li and Nagarajan’s research on NBA player salaries, the data is divided into five parts according to occupation, but this research is mainly based on the player’s PER (Player efficiency rating) and DefRtg (Defensive Rating) [4]. However, excessive emphasis on defensive data has violated the original intention of classifying data by position. In another paper on a similar topic, Zhao, the researcher, used more data and divided the data according to position, but it only performed linear regression on the data without further analysis [5].
Therefore, in this paper, the data, which has 54 items, will be divided into five parts according to the occupation of the players, and then different models will be established for the five data set. For the choice of model, this paper will first analyze the correlation between salary and player data. High correlation means there is some linear relationship between the data which means it is feasible to build a linear model. After deciding to use the linear model, this paper will use LASSO, RIDGE, and Elastic Net for data selection and further optimization of the model. The reason for using methods such as LASSO instead of ordinary linear regression to build linear models is ordinary linear regression is prone to overfitting or underfitting problems. Although we can use the least squares to weight the model to avoid the problem, the theory of weighted least squares assumes that the weights are known exactly while the weights are often unknown in the real world [6]. In addition, being sensitive to outliers and being more suitable for small-scale data is also the reason why this method is not suitable for this paper. Considering that some data also show low correlation, it is also necessary to build a non-linear model, for which the random forest will be used to build the model.
2. Data, Methods and Results
2.1. Basic Data Processing
The data used in this paper comes from Kaggle. This data contains 53 basketball data and the salaries of all players in the NBA since 1950 [7][8]. The name of the data will be abbreviated in this paper. For the specific meaning of the abbreviation, the basketball reference gives a detailed explanation [9]. For missing data, consider that some data are missing due to player injuries, and injuries will greatly impact player games data, which means that neither extrapolating from past data nor using averages is reasonable so that the missing items will be deleted directly.
This article first calculates the correlation between different positions, various data and player salaries. In order to display the data more intuitively, this essay will show them in the form of graphs. The picture uses circles to represent the correlation between the data. The larger the circle means, the stronger the correlation. Figure 1 is the correlation plot for C (Center), PF (Power Forward), SF (Small Forward), SG (Shooting Guard), PG (Point Guard).
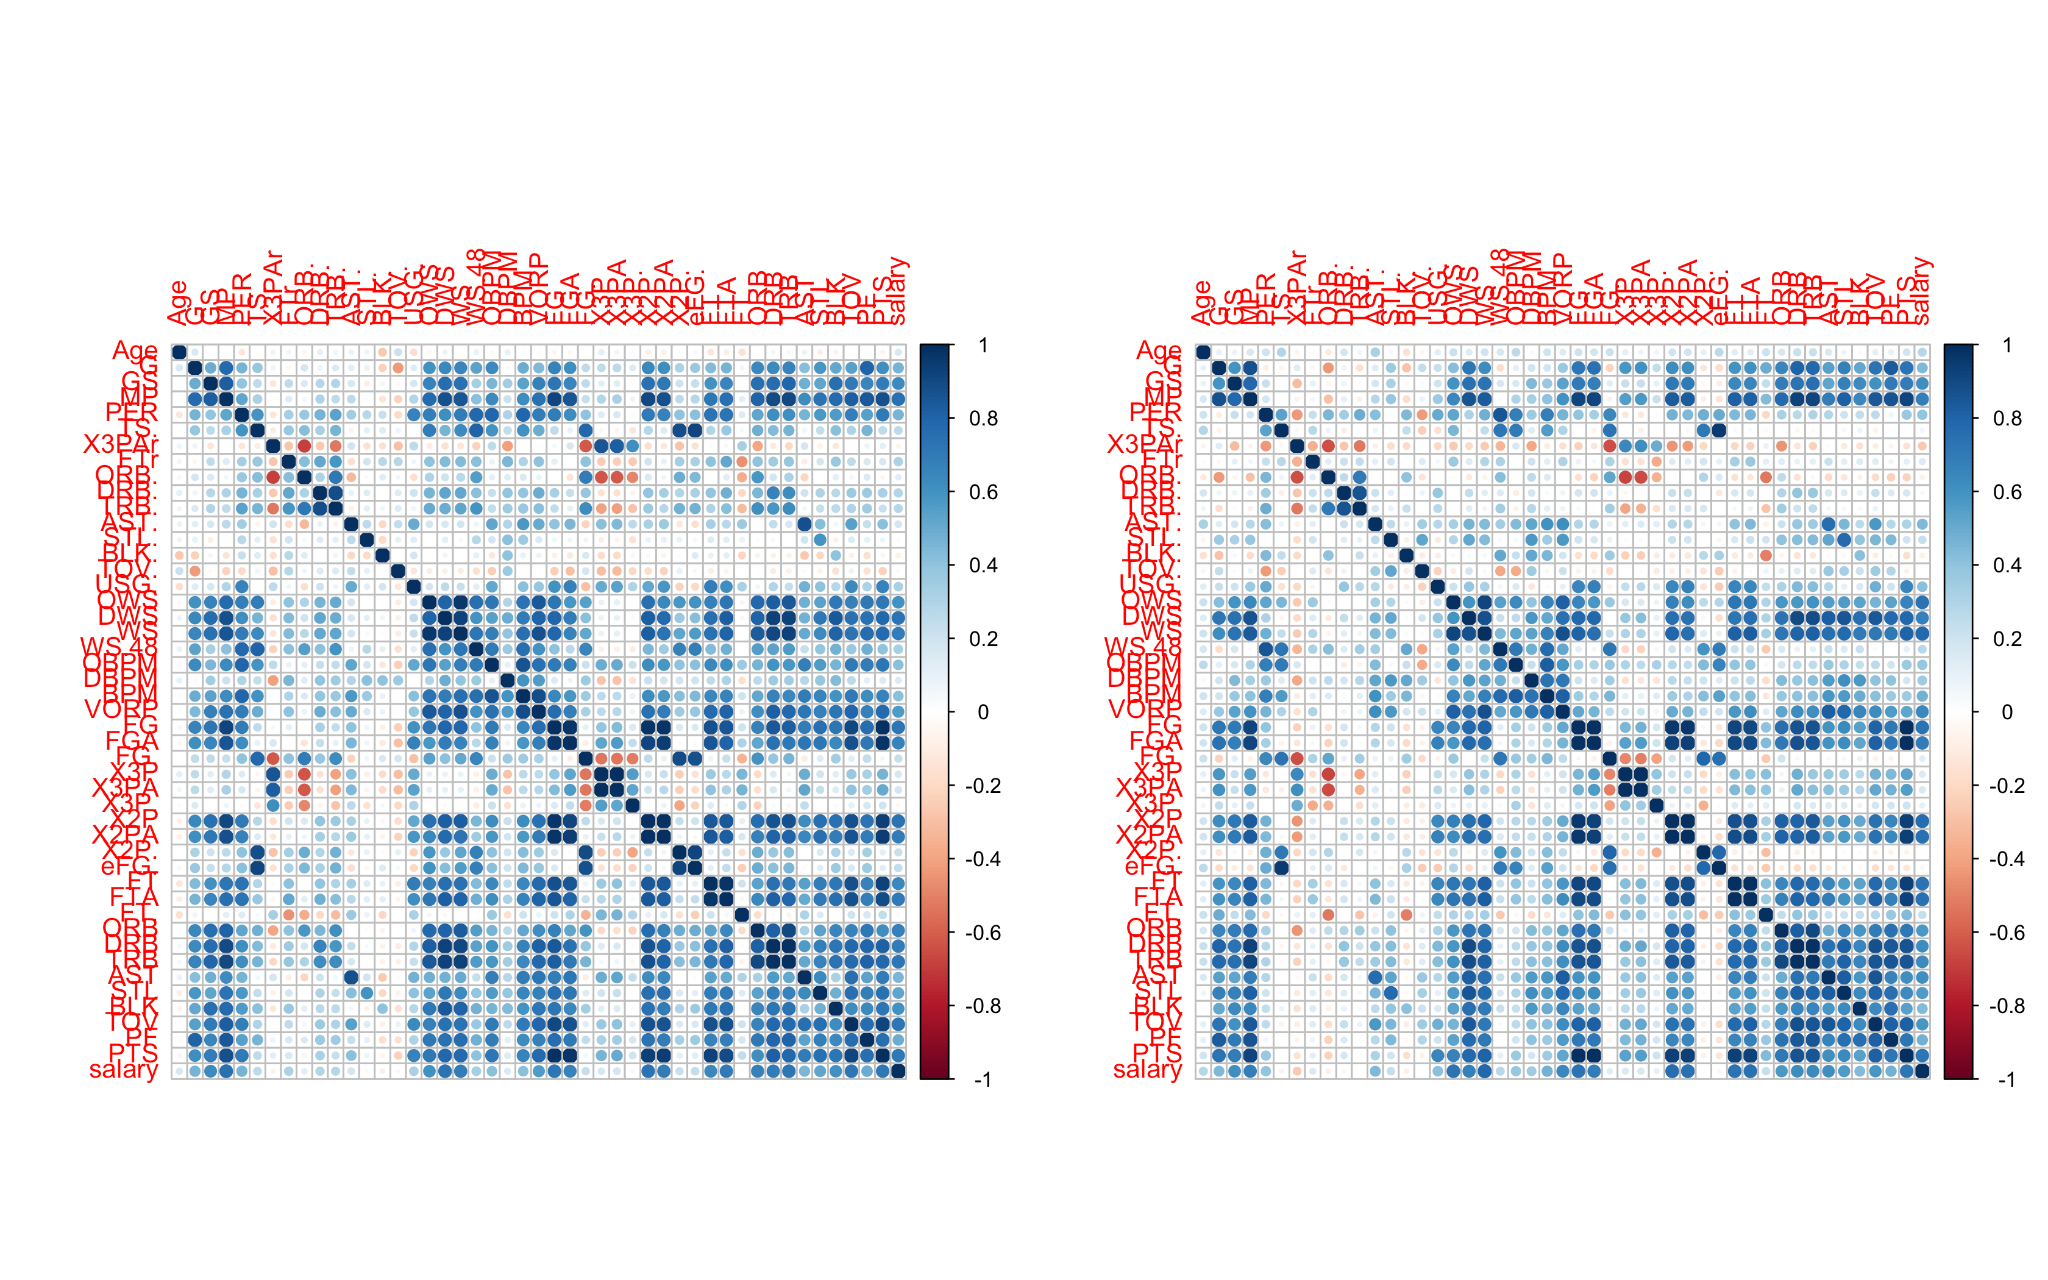
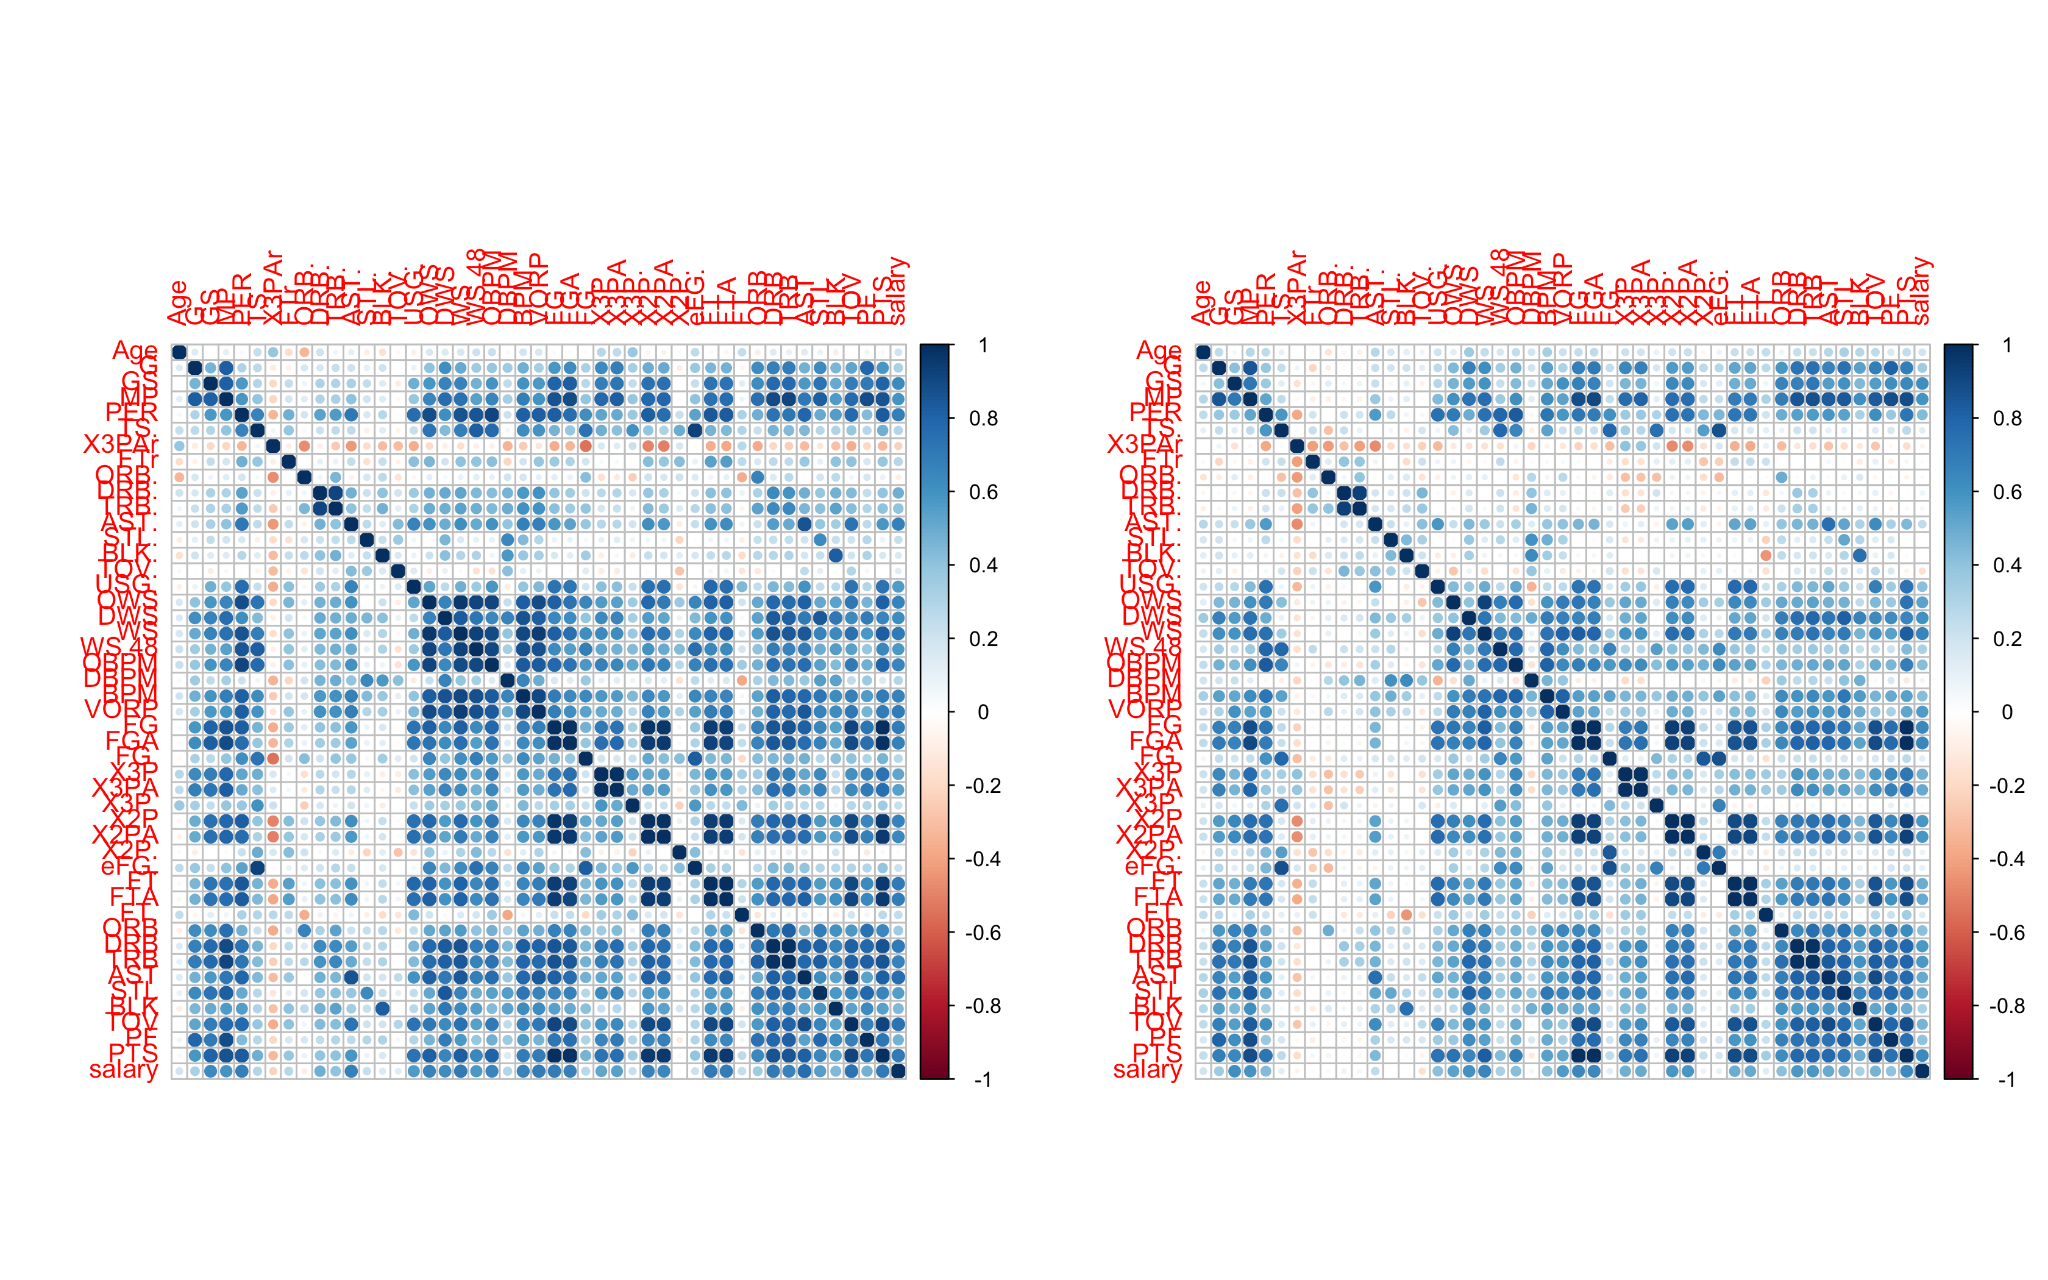
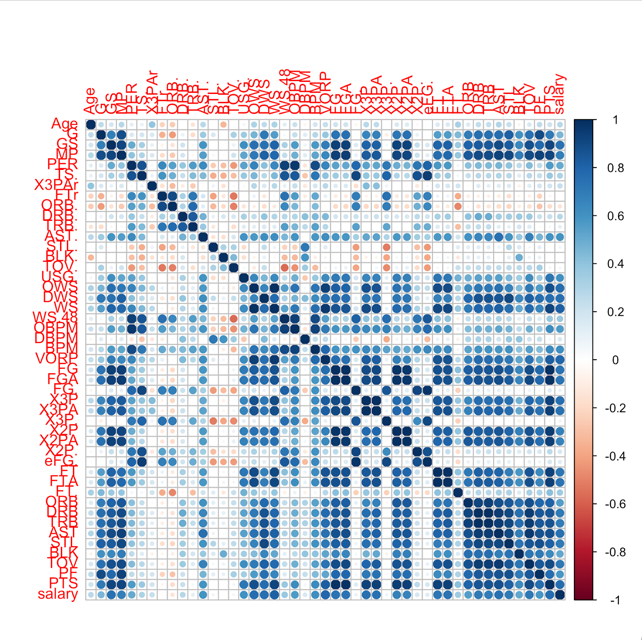
Figure 1: The correlation plot for all position.
According to Figure 1, there is a strong correlation between several data and salary. That is to say, there is a certain linear relationship between player data and wages. In addition, these correlation plots will also be used for the preliminary screening of the data. That is, choosing the high and middle correlation data (correlation > 0.4) as the independent variables for the linear regression model.
Considering that for nonlinear models such as random forests, it is not appropriate to use correlation to initially select data. Therefore, for the random forest, this paper will use the Boruta algorithm to filter the variable. Boruta is a novel feature selection to select related variables. It is designed as an algorithm for random forest [10].
Figure 2 is the Boruta plot for C, PF, SF, SG, and PG. Blue box corresponds to shadow attributes, green indicates important attributes, yellow boxes are tentative attributes, and red boxes are unimportant. In subsequent modeling, unimportant variables will not be considered.
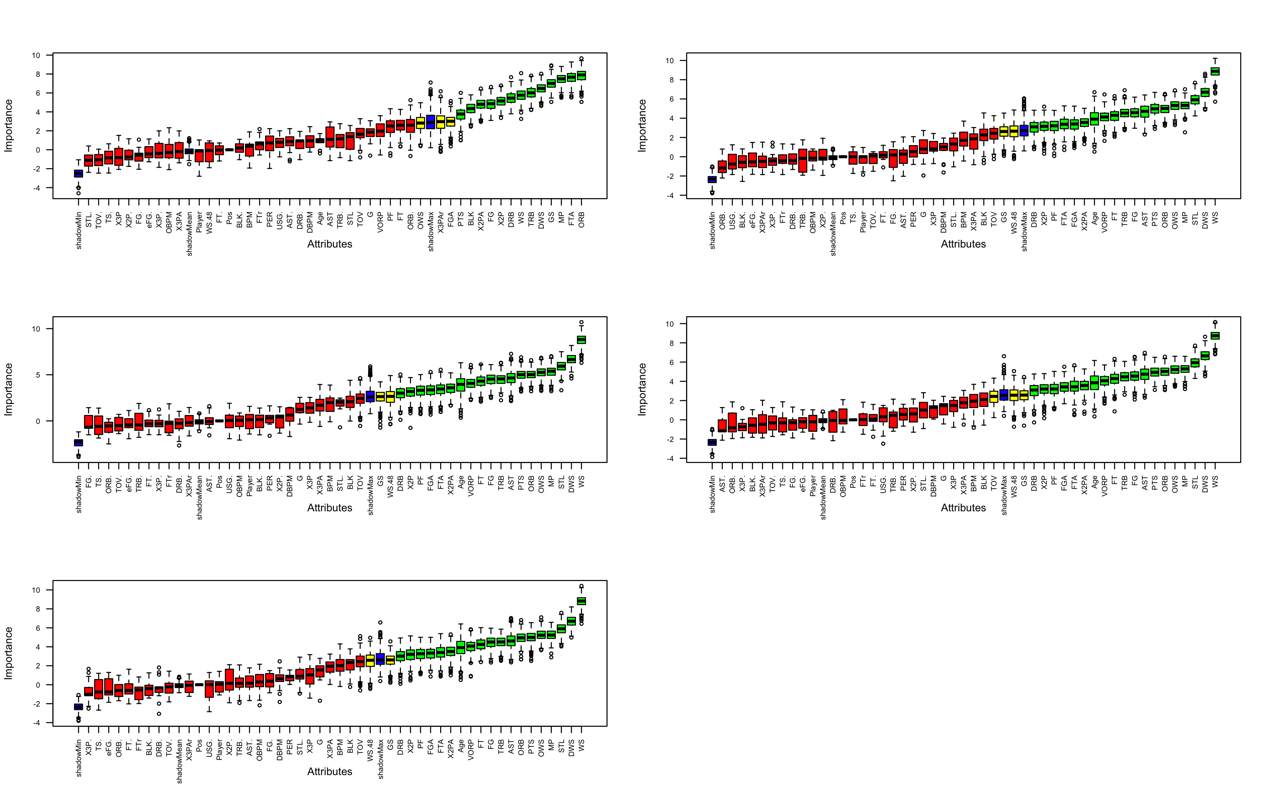
Figure 2: The Boruta plot for all position.
2.2. LASSO Model
Ordinary linear regression model is a common way of analyzing. But when the number of independent variables is large, linear regression cannot be handled well. It is easy to have insufficient model accuracy or overfit. One way to solve this problem is using LASSO. The purpose of LASSO regression is to select the variables and build a linear regression model that has the smallest prediction error. The algorithm is implemented by gradually shrinking the regression coefficients towards zero. The specific method is to determine a fixed value (λ) and then force the sum of the absolute values of regression coefficients to be less than this lambda [11].
This paper uses LASSO to make data selections and model the data with cross-validation. The purpose of using cross-validation is to select Lambda better. Lambda is the Tuning Parameter that controls the bias-variance tradeoff. Simply put, too small a lambda will lead to a model that is too simple, and too large a lambda will lead to a too complex model. Figure 3 is the LASSO lambda plot for C, PF, SF, SG, and PG. The dotted line shows the lambda, which has the minimum mean cross-validated error. And this lambda is the one that will be used in model.
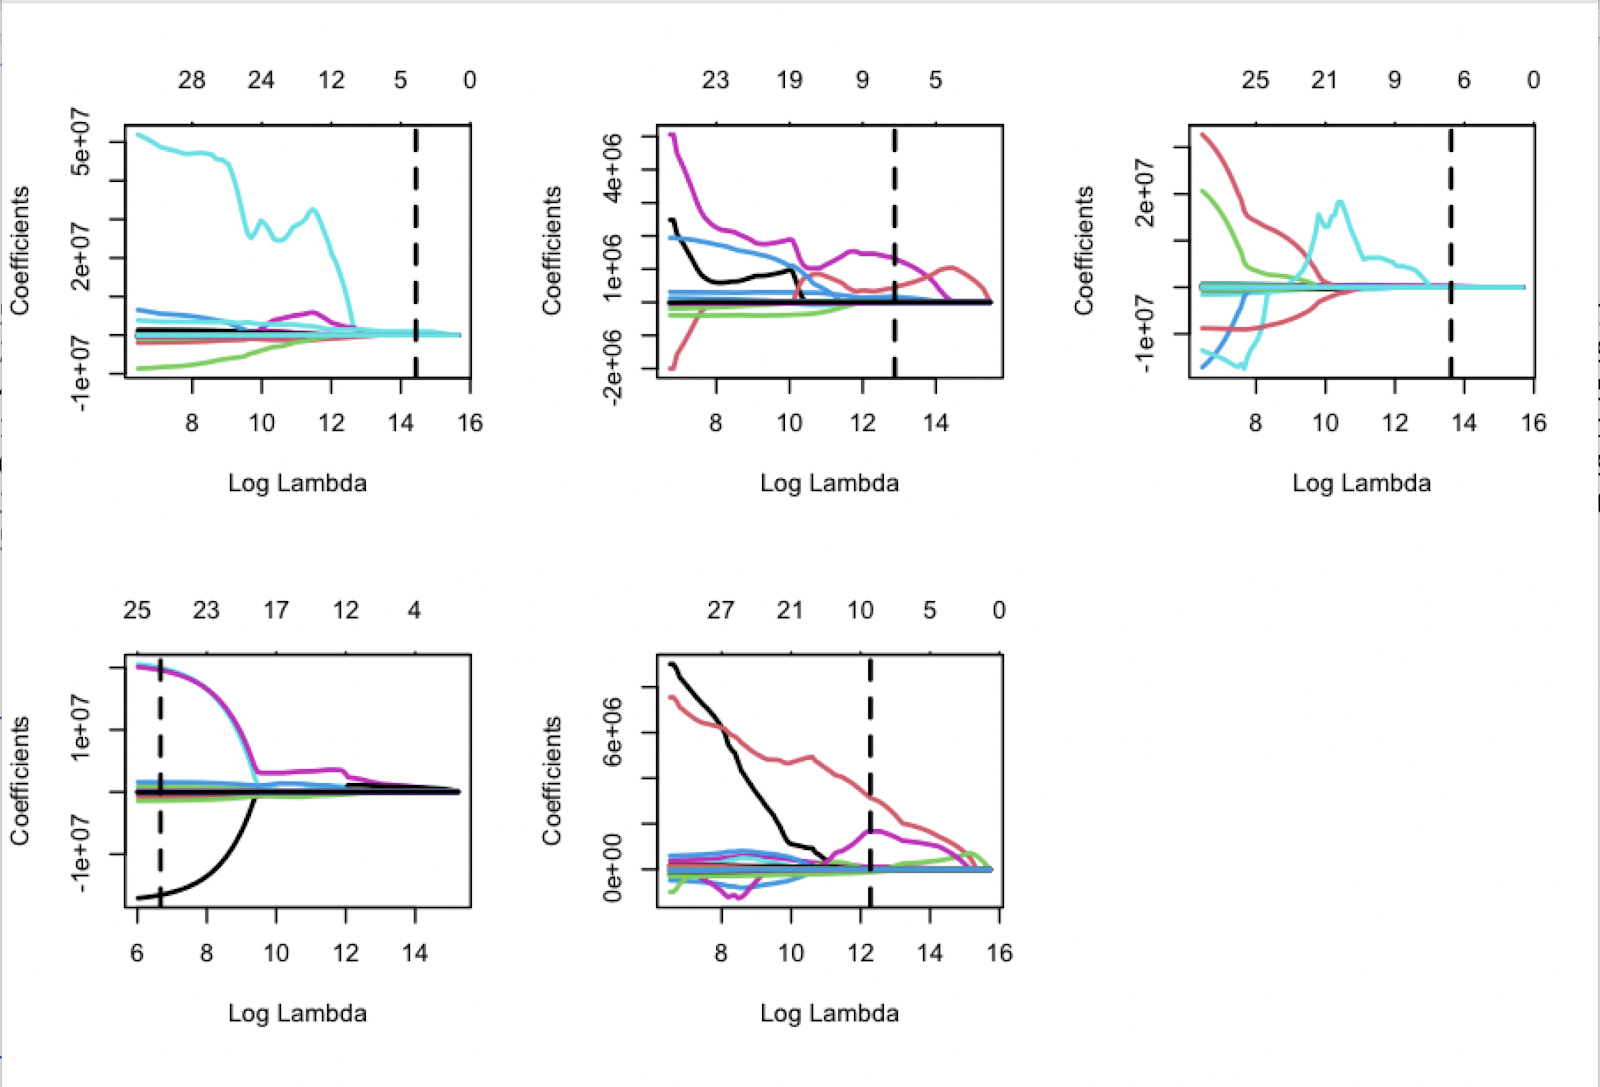
Figure 3: The LASSO Lambda plot for all position.
2.3. RIDGE Model
RIDGE is similar to LASSO. The difference is that RIDGE has a good performance in dealing with collinearity problems, but it will not do the data selection. From the mathematical point of view, the difference between it and LASSO is to square the regression coefficients instead of taking the absolute value. As this paper mentioned in LASSO, lambda is also a very important parameter for RIDGE. Whether lambda is suitable or not directly determines the accuracy of the model. Thus, this paper also makes the plot to help choose the lambda. Figure 4 is the RIDGE lambda plot for C, PF, SF, SG, and PG. This paper chooses the lambda, which has the minimum mean cross-validated error.
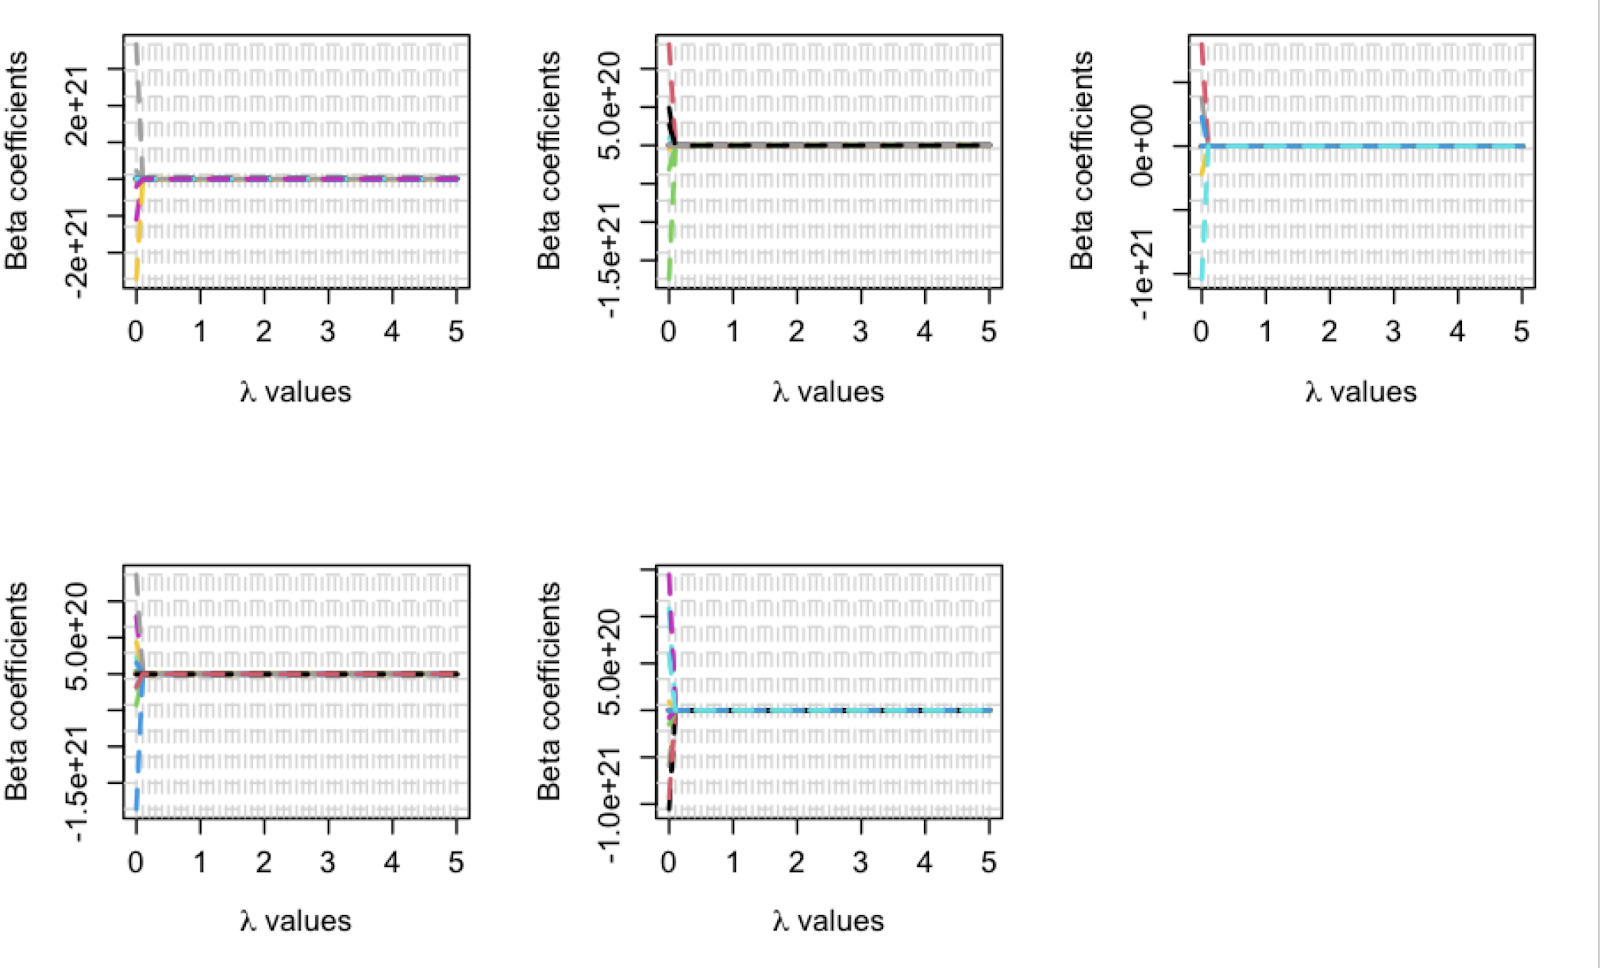
Figure 4: The RIDGE Lambda plot for all position.
2.4. Elastic Net Model
Elastic Net is a combination of LASSO and RIDGE, which provides a balance between the two approaches. It avoids random elimination of highly collinear coefficients while shrinking features. Also, the choice of lambda is important for it. Figure 5 is the Elastic Net lambda plot for C, PF, SF, SG, and PG. The dotted line shows the lambda, which has the minimum mean cross-validated error. And this lambda is the one that will be used in model.
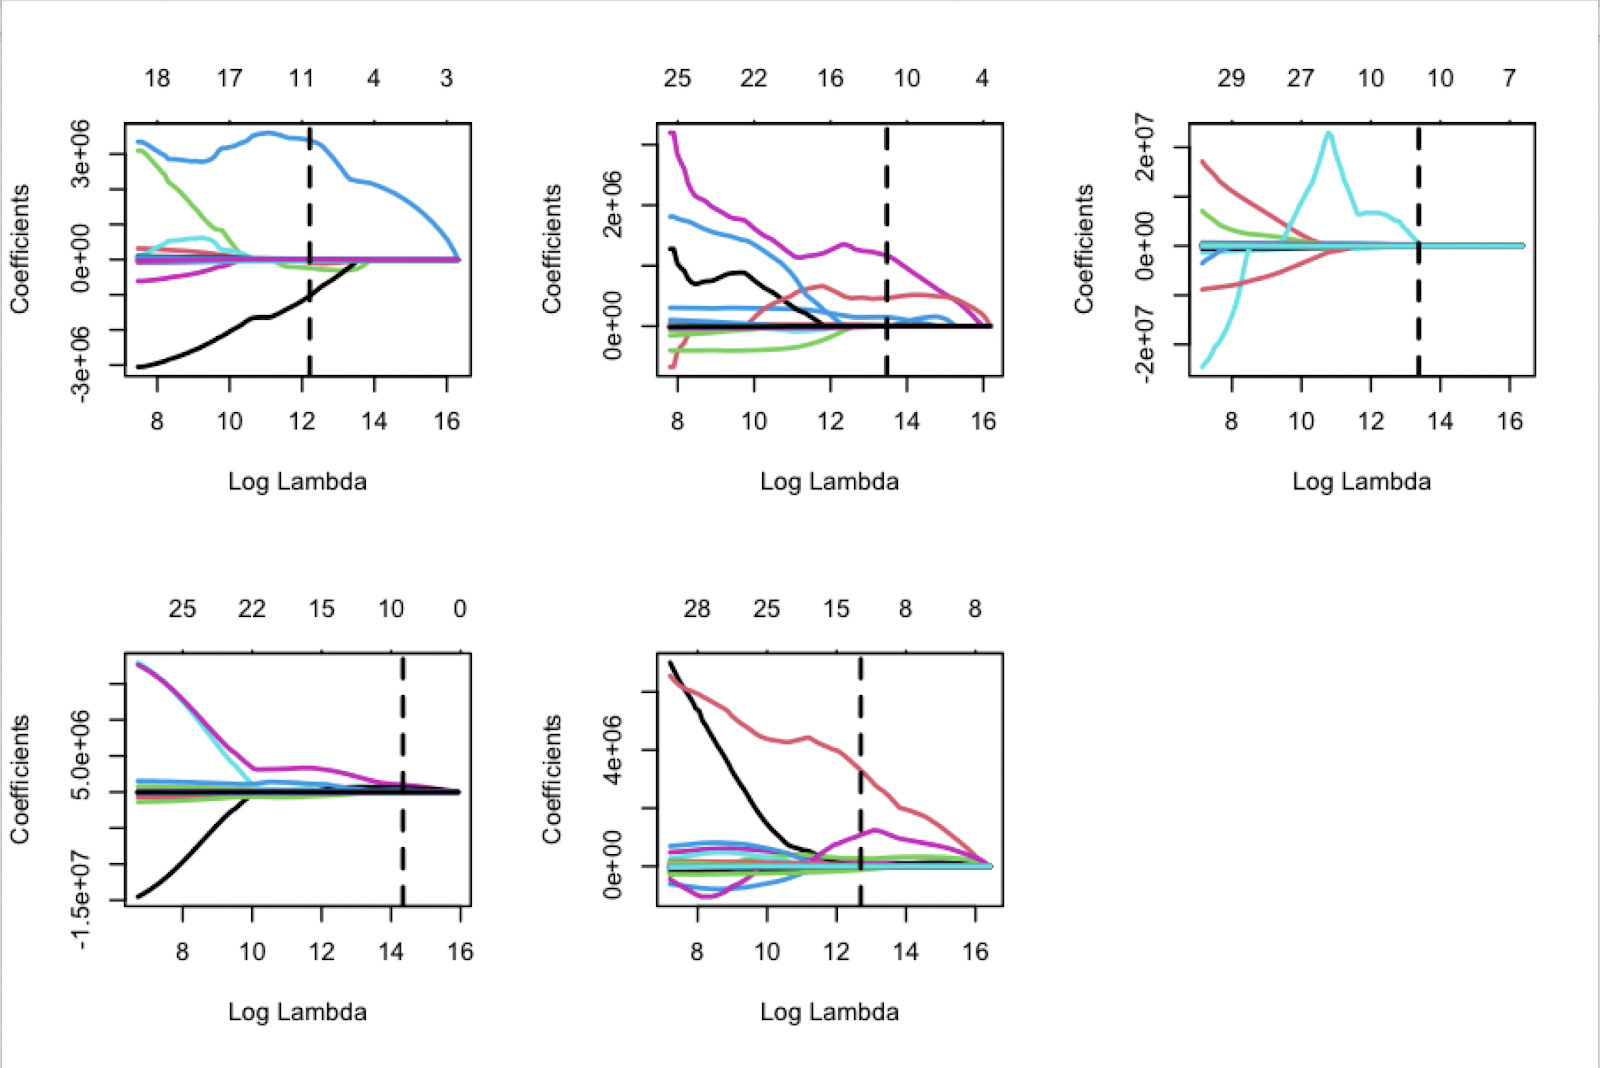
Figure 5: The Elastic Net Lambda plot for all position.
2.5. Random Forest Model
According to the previous correlation (graph 1,2,3,4,5), it can be seen that not all data and salary have a linear relationship, so it is necessary to establish a nonlinear system. The regression tree is considered a good way to deal with nonlinear data. Paul F. Smith mentioned in his paper that the interactions between different variables are automatically incorporated into the tree regression model. [12] And Random Forest is considered as an advanced version of the regression tree. Thus, Random Forest will have better performance than the new regression when dealing with complex nonlinear interactions.For Random Forest, determining the appropriate number of trees is a necessary step. Therefore, this paper will first build a model of 500 trees, then look for the number of trees whose error tends to be stable as the final parameter. Figure 6 shows the error for different trees. For positions C, PF, SF, SG, and PG, the numbers of trees are 400, 300, 200, 300, and 400.
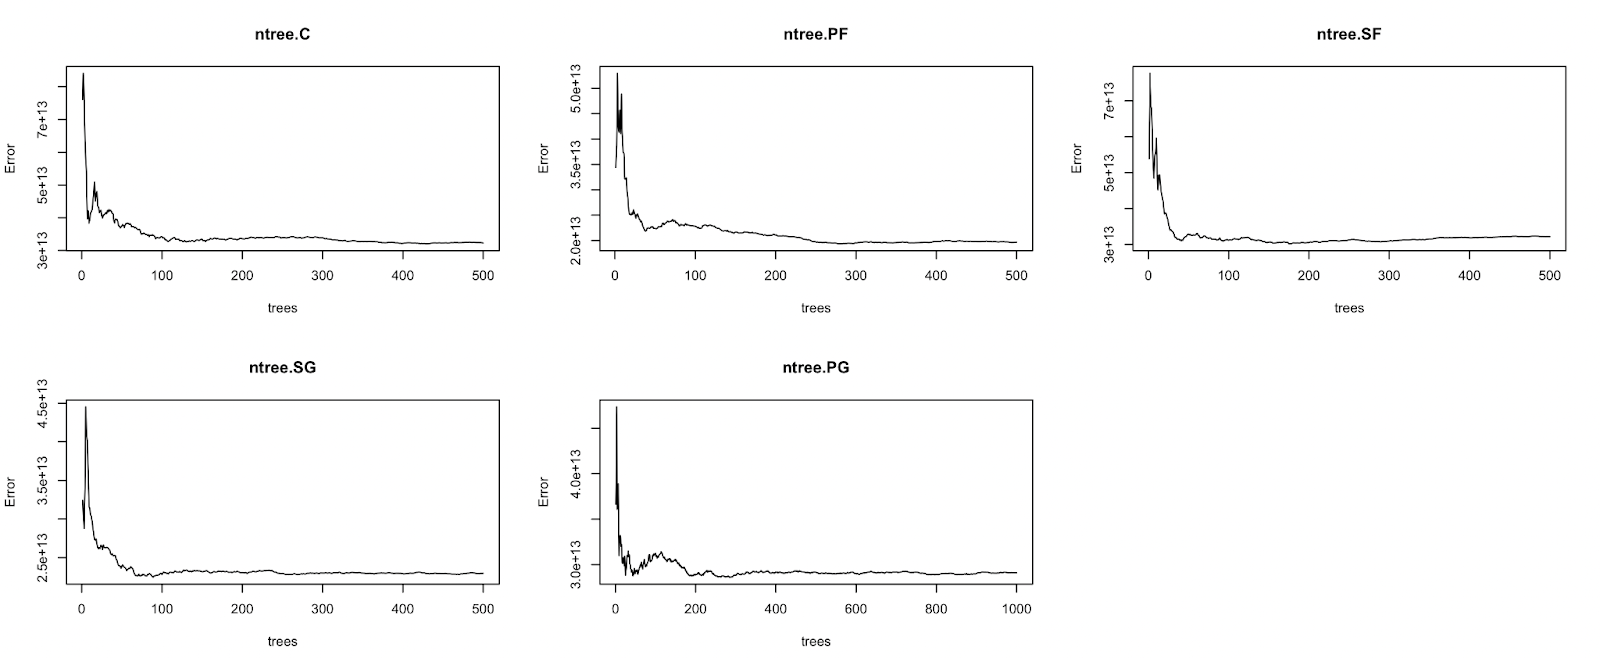
Figure 6: The number of trees and error plots for all position.
2.6. Result
Table 1 shows the R-square with different models and different positions. R-square is the proportion of the variance for the dependent variable that the independent variables can explain. It is a common statistic that is considered useful for assessing model accuracy. From the point of view of different models, the R-square for the LASSO and Elastic Net models is around 0.8. Even the worst data is greater than 0.7. However, the R-square for the RIDGE and Random Forest models is only around 0.5, which means These two models do not fit the data well. The only thing worth noting is that the RIDGE model for PG’s R-square reached 0.781. This means that the RIDGE model is not completely worthless. Based on the above data, when summarizing and analyzing the research projects in this paper, the LASSO and Elastic Net models will be given priority. RIDGE and Random Forest models are in secondary order of consideration. From the perspective of different positions, C, SF and PG have relatively larger R-square, but the difference is not obvious.
Table 1: The R square for all methods and all position.
Position | LASSO | RIDGE | Elastic Net | Random Forest |
C | 0.883 | 0.406 | 0.743 | 0.578 |
PF | 0.791 | 0.683 | 0.789 | 0.551 |
SF | 0.866 | 0.630 | 0.855 | 0.523 |
SG | 0.731 | 0.546 | 0.730 | 0.424 |
PG | 0.891 | 0.781 | 0.887 | 0.587 |
3. Conclusion
This paper initially processes the data by correlation and Boruta formula. Then, divide the data by different positions and use the LASSO, RIDGE, Elastic Net, and Random Forest to build the model. Among different models, LASSO and Elastic Net have higher R-square, which means the predictions based on these two models will be more accurate.
Neither RIDGE nor Random Forest filters the data, while other methods filter the data. This implies that initially processed data may not be suitable for modeling directly. Adding another step of data selection should improve the R-square of the data. In addition, future research can also look for the advantage interval of each model. Use the best interval for each model to predict instead of a single model.
References
[1]. Steinberg L. (2015). Changing the game: the rise of sports analytics. Retrieved from https://www.forbes.com/sites/leighsteinberg/2015/08/18/changing-the-game-the-rise-of-sports-analytics/#71e6207d4clf
[2]. Kevin J. Sigler, William H. Sackley. (2000). NBA players: are they paid for performance. Managerial Finance, 26(7),46-51.
[3]. Ioanna Papadaki and Michail Tsagris. (2020). Are NBA Players’ Salaries in Accordance with Their Performance on Court? Advances in Econometrics, Operational Research, Data Science and Actuarial Studies. Contributions to Economics.
[4]. Li, L., Nagarajan, R. (2017). Optimizing NBA Player Selection Strategies Based on Salary and Statistics Analysis. 2017 IEEE 15th Intl Conf on Dependable, Autonomic and Secure Computing, 15th Intl Conf on Pervasive Intelligence and Computing, 3rd Intl Conf on Big Data Intelligence and Computing and Cyber Science and Technology Congress, 1076 – 1083.
[5]. Zhao, Y. (2023) Model Prediction of Factors Influencing NBA Players’ Salaries Based on Multiple Linear Regression. Proceedings of the 2022 2nd International Conference on Economic Development and Business Culture.
[6]. Sulaimon Mutiu O. (2015) Application of Weighted Least Squares Regression in Forecasting. International Journal of Recent Research in Interdisciplinary Sciences, 2 (3), 45-54
[7]. Koki Ando. (2017). NBA Player Salary Dataset. Retrieved from ttps://www.kaggle.com/datasets/koki25ando/salary
[8]. Omri Goldstein. (2017). NBA Players stats since 1950. Retrieved from https://www.kaggle.com/datasets/drgilermo/nba-playersstats?select=Seasons_Stats.csv
[9]. Basketball Reference. (2023) Glossary. Retrieved from https://www.basketball-reference.com/about/glossary.html
[10]. Miron B. Kursa, and Witold R. Rudnicki. (2010) Feature Selection with the Boruta Package. Retrieved from Journal of Statistical Software, 36(11), 1–13.
[11]. Ranstam, J A Cook. (2023). LASSO regression. British Journal of Surgery, 105(10), 1348
[12]. Smith, P. F., Ganesh, S., and Liu, P. (2013) A comparison of random forest regression and multiple linear regression for prediction in neuroscience. Journal of neuroscience methods, 220(1), 85-91.
Cite this article
Lu,Y. (2024). The Prediction of NBA Player’s Salary. Advances in Economics, Management and Political Sciences,57,196-203.
Data availability
The datasets used and/or analyzed during the current study will be available from the authors upon reasonable request.
Disclaimer/Publisher's Note
The statements, opinions and data contained in all publications are solely those of the individual author(s) and contributor(s) and not of EWA Publishing and/or the editor(s). EWA Publishing and/or the editor(s) disclaim responsibility for any injury to people or property resulting from any ideas, methods, instructions or products referred to in the content.
About volume
Volume title: Proceedings of the 2nd International Conference on Financial Technology and Business Analysis
© 2024 by the author(s). Licensee EWA Publishing, Oxford, UK. This article is an open access article distributed under the terms and
conditions of the Creative Commons Attribution (CC BY) license. Authors who
publish this series agree to the following terms:
1. Authors retain copyright and grant the series right of first publication with the work simultaneously licensed under a Creative Commons
Attribution License that allows others to share the work with an acknowledgment of the work's authorship and initial publication in this
series.
2. Authors are able to enter into separate, additional contractual arrangements for the non-exclusive distribution of the series's published
version of the work (e.g., post it to an institutional repository or publish it in a book), with an acknowledgment of its initial
publication in this series.
3. Authors are permitted and encouraged to post their work online (e.g., in institutional repositories or on their website) prior to and
during the submission process, as it can lead to productive exchanges, as well as earlier and greater citation of published work (See
Open access policy for details).
References
[1]. Steinberg L. (2015). Changing the game: the rise of sports analytics. Retrieved from https://www.forbes.com/sites/leighsteinberg/2015/08/18/changing-the-game-the-rise-of-sports-analytics/#71e6207d4clf
[2]. Kevin J. Sigler, William H. Sackley. (2000). NBA players: are they paid for performance. Managerial Finance, 26(7),46-51.
[3]. Ioanna Papadaki and Michail Tsagris. (2020). Are NBA Players’ Salaries in Accordance with Their Performance on Court? Advances in Econometrics, Operational Research, Data Science and Actuarial Studies. Contributions to Economics.
[4]. Li, L., Nagarajan, R. (2017). Optimizing NBA Player Selection Strategies Based on Salary and Statistics Analysis. 2017 IEEE 15th Intl Conf on Dependable, Autonomic and Secure Computing, 15th Intl Conf on Pervasive Intelligence and Computing, 3rd Intl Conf on Big Data Intelligence and Computing and Cyber Science and Technology Congress, 1076 – 1083.
[5]. Zhao, Y. (2023) Model Prediction of Factors Influencing NBA Players’ Salaries Based on Multiple Linear Regression. Proceedings of the 2022 2nd International Conference on Economic Development and Business Culture.
[6]. Sulaimon Mutiu O. (2015) Application of Weighted Least Squares Regression in Forecasting. International Journal of Recent Research in Interdisciplinary Sciences, 2 (3), 45-54
[7]. Koki Ando. (2017). NBA Player Salary Dataset. Retrieved from ttps://www.kaggle.com/datasets/koki25ando/salary
[8]. Omri Goldstein. (2017). NBA Players stats since 1950. Retrieved from https://www.kaggle.com/datasets/drgilermo/nba-playersstats?select=Seasons_Stats.csv
[9]. Basketball Reference. (2023) Glossary. Retrieved from https://www.basketball-reference.com/about/glossary.html
[10]. Miron B. Kursa, and Witold R. Rudnicki. (2010) Feature Selection with the Boruta Package. Retrieved from Journal of Statistical Software, 36(11), 1–13.
[11]. Ranstam, J A Cook. (2023). LASSO regression. British Journal of Surgery, 105(10), 1348
[12]. Smith, P. F., Ganesh, S., and Liu, P. (2013) A comparison of random forest regression and multiple linear regression for prediction in neuroscience. Journal of neuroscience methods, 220(1), 85-91.