


1. Introduction
Sarah Foster reported on the website of Bankrate about the history of U.S. Federal Reserve increases the interest rate, on 16th March 2022, U.S. Federal Reserve first increased the interest rate after the federal Reserve conference, the interest rate did not increase dramatically in the first time, it was merely 25 basis points, and then increased again in May by 50 basis point, in June, July, September, November, 75 basis points were added to each month, and in December, another 50 benchmarks were added [1]. According to Irina Ivanova reported on CBS news, that was the highest increasing interest rate in 15 years [2]. The article of Dario Caldara et al. posted on U.S. Federal Reserve says that the war between Russia and Ukraine resulted in inflation rate raises among the world, including America [3]. The influence of Covid 19 made it even worse, America’s inflation rate increased to 8.5% in 2022 March, however, the ideal inflation rate U.S. wants to achieve is around 2% [2, 4]. In order to decrease the inflation rate for higher living quality in America, the American Federal Reserve decided to increase the interest rate [5].
This big movement made by Federal Reserve deeply affected a lot of financial assets in world. Ethereum, one of the most famous cryptocurrencies in the world was also deeply affected by it. Ethereum was first invented by Vitalik Buterin, which has a more comprehend functions than Bitcoin. It has a Ethereum Virtual Machine where the users can create smart contracts on it [6]. Since it has more functions and are totally open to users, a lot of investors deem ETH as a valuable asset, and the market is thriving. However, after the Federal Reserve increased the interest rate, the price of ETH changed.
To figure out what influences of increasing the interest rate were brought to the price of Ether, this paper uses ARIMA model to stimulate a daily and a weekly model of Ether under the condition without increasing interest rate, the control group which simulates the condition where ETH market did not experience the increasing interest rate, and the other one is the experimental group which shows the real situation in reality, with the assumption that all other factors except than increasing interest rate didn’t affect the price of ETH. In this way, by comparing these two groups, how increasing interest rate affected the price of ETH can be shown by analysis.
This paper consists of six parts, the first part is introduction and the following parts are literature review, including the introduction of ETH, and the related researches of predicting the future trend of Ethereum’s price. The next part is about experiment design. The fourth part is about empirical results and analysis. The fifth part is discussions on comparison with related works and the inspirations this paper can bring to policymakers and investors. The last part is conclusion.
2. Literature Review
2.1. Background Information of ETH
Ethereum is a technology based on the block chain, which makes the procedure operated in it avoid the risks of crash and the data in it won’t be leaked or even be closed, it is a global open-source platform that can be used for Decentralized Application and even more functions which make ETH more valuable [7]. Through Ethereum, users can create Decentralized Application and smart contract and using the code to manage digital assets and operate procedure without regional limitations [8]. And it is the second most popular cryptocurrency in the world, so the value of ETH is pretty high [9]. And under the current advantageous environment for technology, ETH should have a bright future and continuing to increase its value.
2.2. Related Researches of Predictions of the Price of Ether
Rathee et al. used CNN-BiLSTM based on CNN and LSTM to predict the long-term price of Bitcoin, Ethereum, Dogecoin and Litecoin with its historical price and real-time price. Their model is consisted of three layers of CNN and two layers of Bi-LSTM, CNN is responsible for withdrawing inner characteristics of Ether, and Bi-LSTM is for predicting time series. In terms of the price of Ethereum, they get more accurate results using historical data, the predictions of the price of Ethereum sometimes slightly higher than the actual price, and most of the time, the predicted price was nearly equal to the actual price [10]. Liao, C. et al. used data from 30th July 2019 to 7th May 2022 to construct LSTM, ARIMA, XGBoost model to predict the price of Bitcoin, Ethereum, Binance coin, Avalanche and Solana. Their model only predicted to 7th May 2022, the price of Ethereum simulated by LSTM model shown the highest degree of fitting, predicted price generated by ARIMA model was far away from the real price because of the big fluctuations of cryptocurrency markets [11].
2.3. Review
Rathee et al. shows that deep learning can be used to predict the long-term price of Ethereum and the accuracy may be higher than ARIMA model because the Bi-LSTM model can simulate both linear and non-linear model so it’s more comprehensive and it has much less errors. However, this model did not consider about market sentiment [10]. Liao, C. et al. shows that LGTM has better degree of stimulation on predicting the price of Ethereum. However, they focus more on the correlation between ETH with other cryptocurrencies instead of external factors like policies [11].
3. Research Design
3.1. Data Sources
This paper acquires Ethereum’s price on Investment.com from 2018 to 2023 August, and then this paper uses the price from 2018 to the first time that U.S Federal Reserve raised its interest rate in 2022 to construct ARIMA model that simulates the development of Ethereum’s price without the influences of increasing interest rate.
3.2. Stationarity Test
And Table 1 is the stationarity test for daily and weekly ARIMA model.
Table 1: Weak stationarity test.
t | p | |
Daily | ||
Ln price | -2.312 | 0.4271 |
1st order difference | -26.968 | 0.000000 |
Weekly | ||
Ln price | -2.414 | 0.3722 |
1st order difference | -9.790 | 0.0000 |
2nd order difference | -16.835 | 0.0000 |
For the daily ARIMA model, the original price got a t value of -2.312 and a p value of 0.4271, it could not reject the hypothesis that this sequence is not stable, so this paper adopted difference, after the first order difference, the t value becomes -26.968 and the p value is very closely to 0. So that the hypothesis could be rejected and the sequence is proven to be stable.
For the weekly ARIMA model, the original weekly price got a t value of -2.414 and a p value of 0.3722, after the first order difference, the t value becomes -9.790 and the p value comes close to 0, however, in order to make the weekly sequence more stable, this paper made second order difference and get a t value of -16.835 and a p value very closely to 0. So that the hypothesis could be rejected and the sequence is proven to be stable.
3.3. Introduction of ARIMA Model
ARIMA model is an effective model for time series, it uses MA which is moving average, a method of making the curve more smoothly, and AR, which is auto regressive, meaning using the historical data to predict the future trend. And the “I” represents difference, a method of calculations in time series to make the sequence passes the test of stationarity. The ARIMA model combines AR model and MA model with difference [12]. It is suitable for analyzing the long-term trend if the data is time associated, through AR and MA model, ARIMA model can predict the future trends according to the previous history data if the history data satisfies three conditions:
(1) Using its own historical data to predict
(2) The data must satisfy the characteristics of stationarity
(3) Because of the correlation of time series, it can only be used to predict phenomenon which are related to the earlier stage of the data.
The equation of the ARIMA model is given as: \( y(t)=c+ ∅1×y(t-1)+…+∅p×y(t-p)+θ1×ε(t-1)+…+θq×ε(t-q)+εt \) . This paper uses STATA to achieve ARIMA model with daily and weekly history data from 2018 to the first time when American Federal Reserve decided to increase the interest rate and under the assumption of the other outsider influences are zero, which indicates that ETH’s price is not affected by the increases of interest rate made by American Federal Reserve. And then uses these two models to compare with the reality where ETH experienced the increases of interest rates made by America Federal Reserve. This paper didn’t use monthly data to construct ARIMA model because it is hard to achieve the order determination even after the second difference.
4. Empirical Results and Analysis
Through the PACF and ACF, the ARIMA model of Ethereum’s price is reasonable, after the difference, the sequence passes the stable test and also satisfies the white noise sequence, which indicates that the sequence is stable and qualified to satisfy the condition of self-relation in order to use the historical data to predict the future trend of Ethereum’s price.
4.1. Confirm the Value of p, d, q in ARIMA (p, d, q)
In daily ARIMA model, the PACF and ACF all shown as tailing, and the last value that outreaches the confidence interval is both 10 in PACF and ACF, and because the daily model after the first difference already passes the stationarity test, so p value is 10, d value is 1, and q value is 10.
PACF | ACF |
Daily | |
|
|
Weekly | |
|
|
Figure 1: ARMA (p, q) identification. | |
Photo credit: Original | |
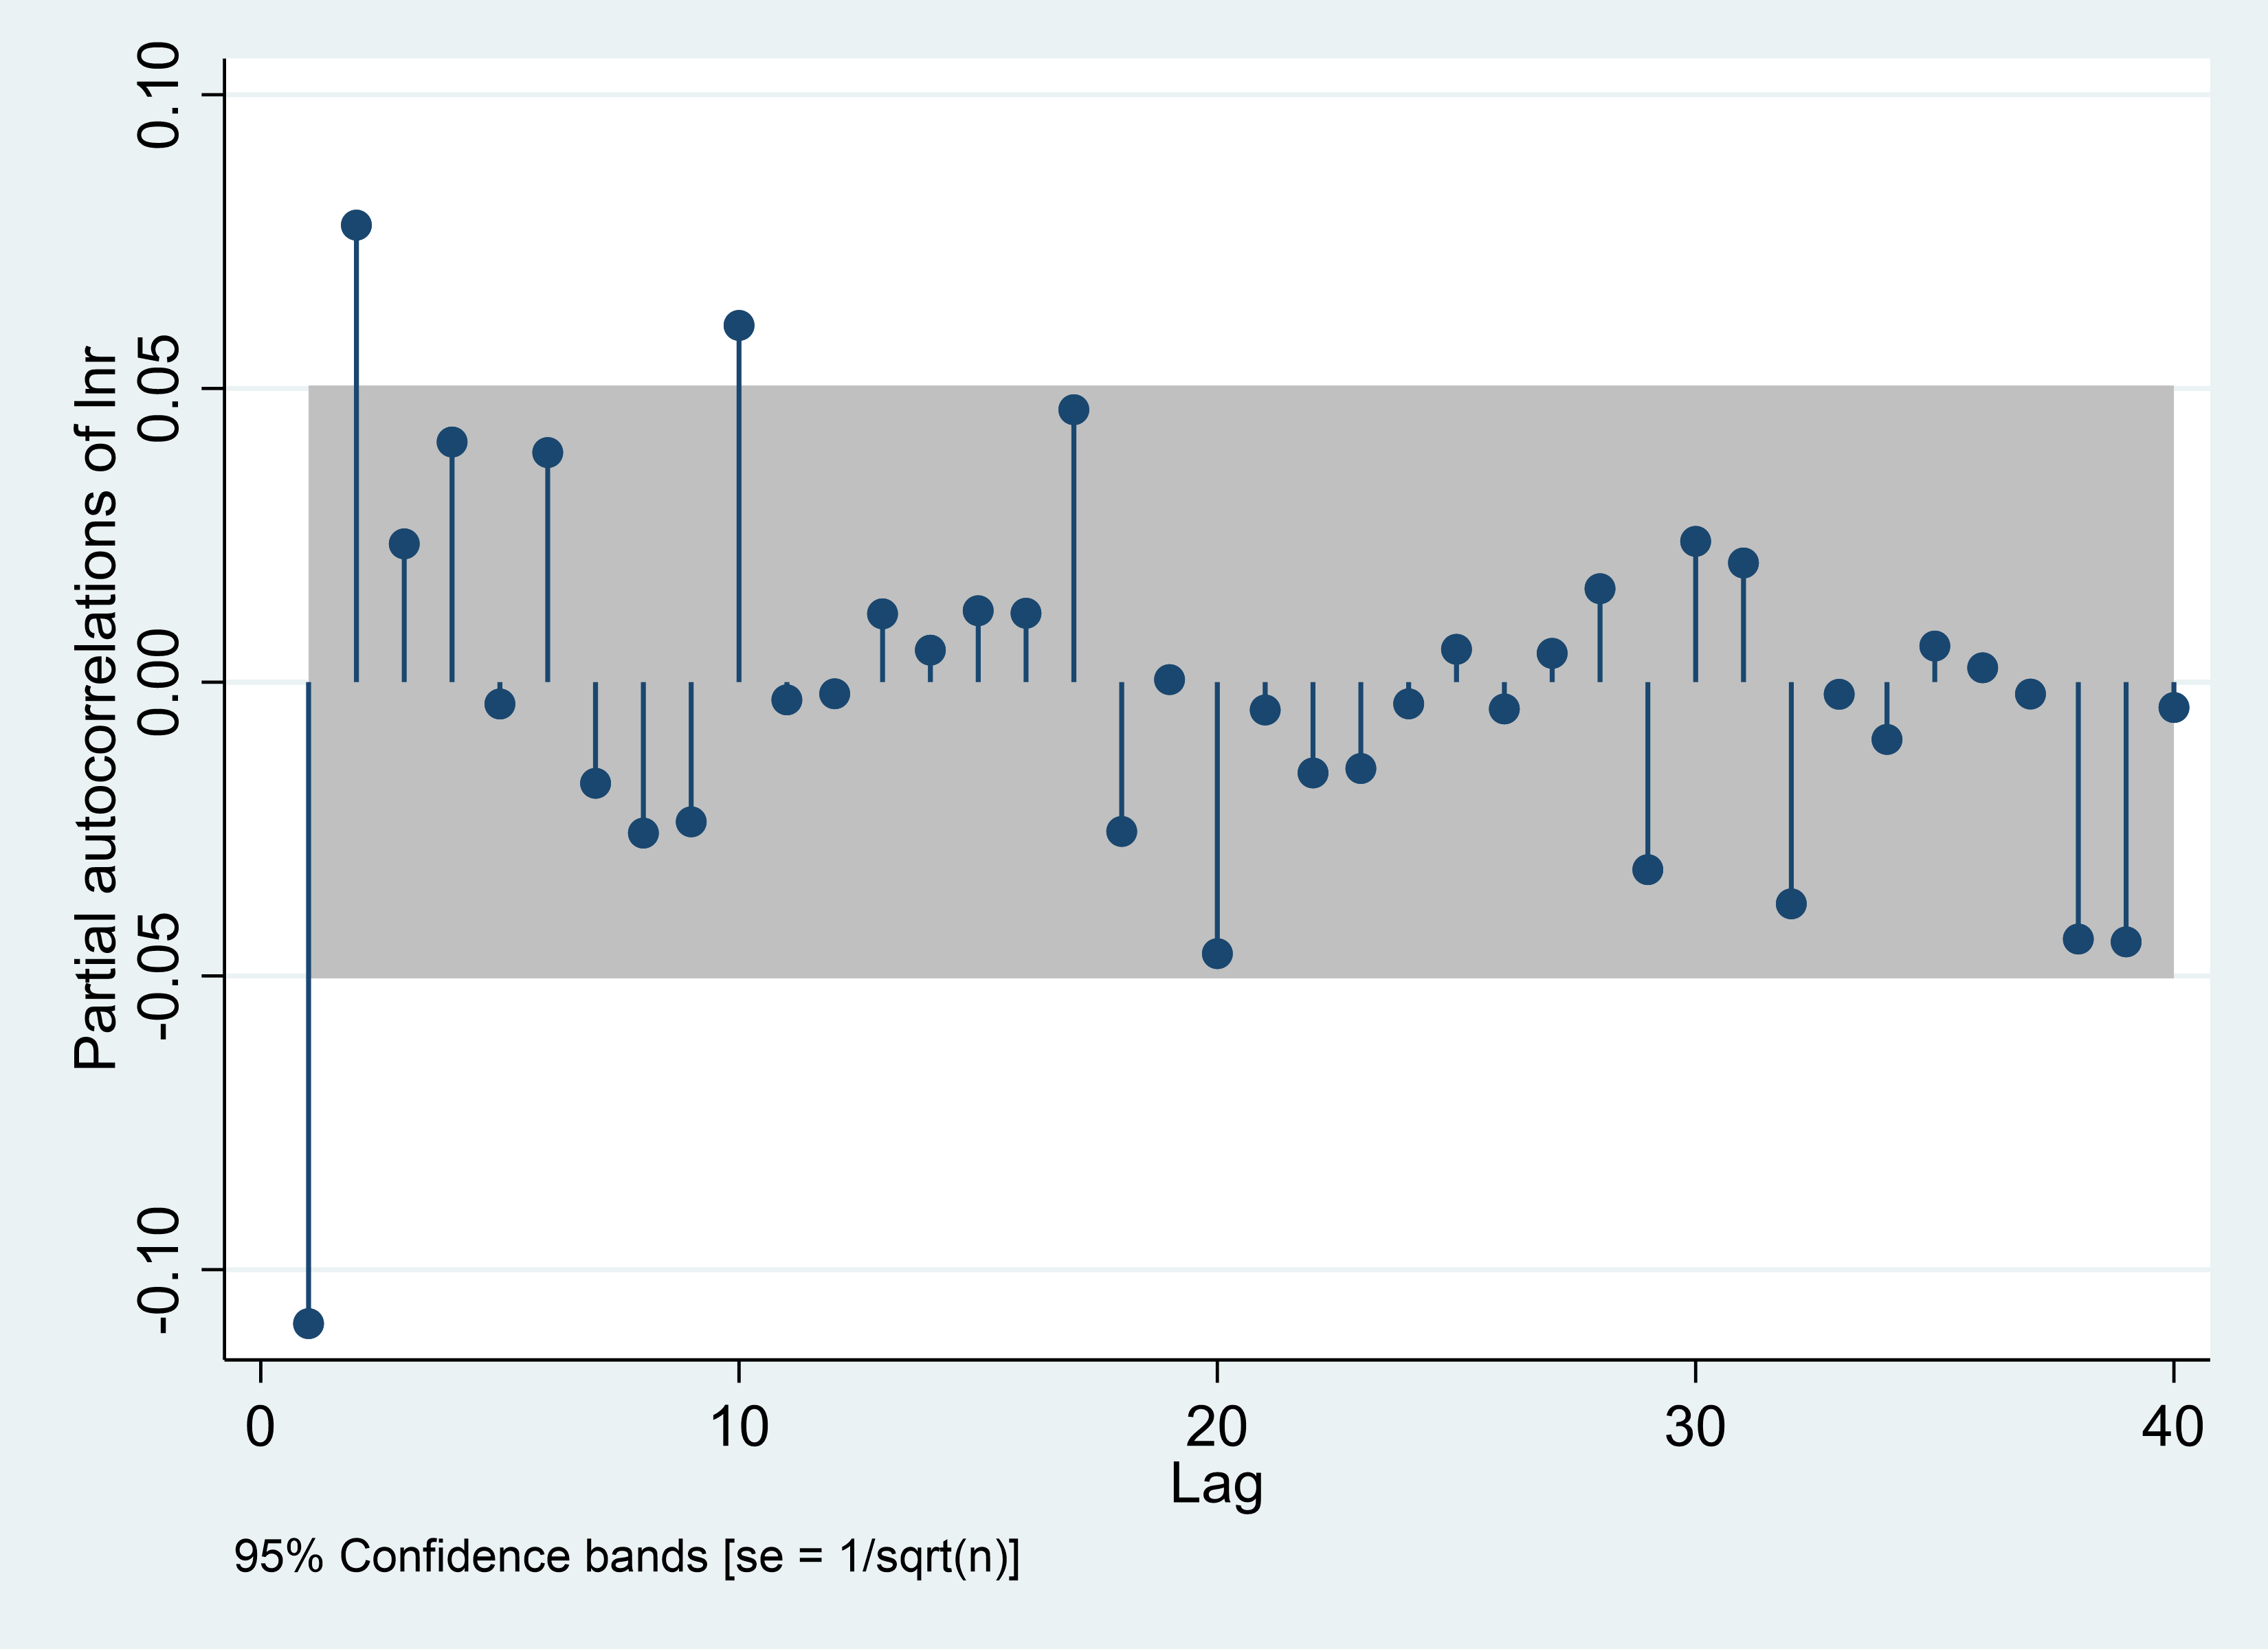
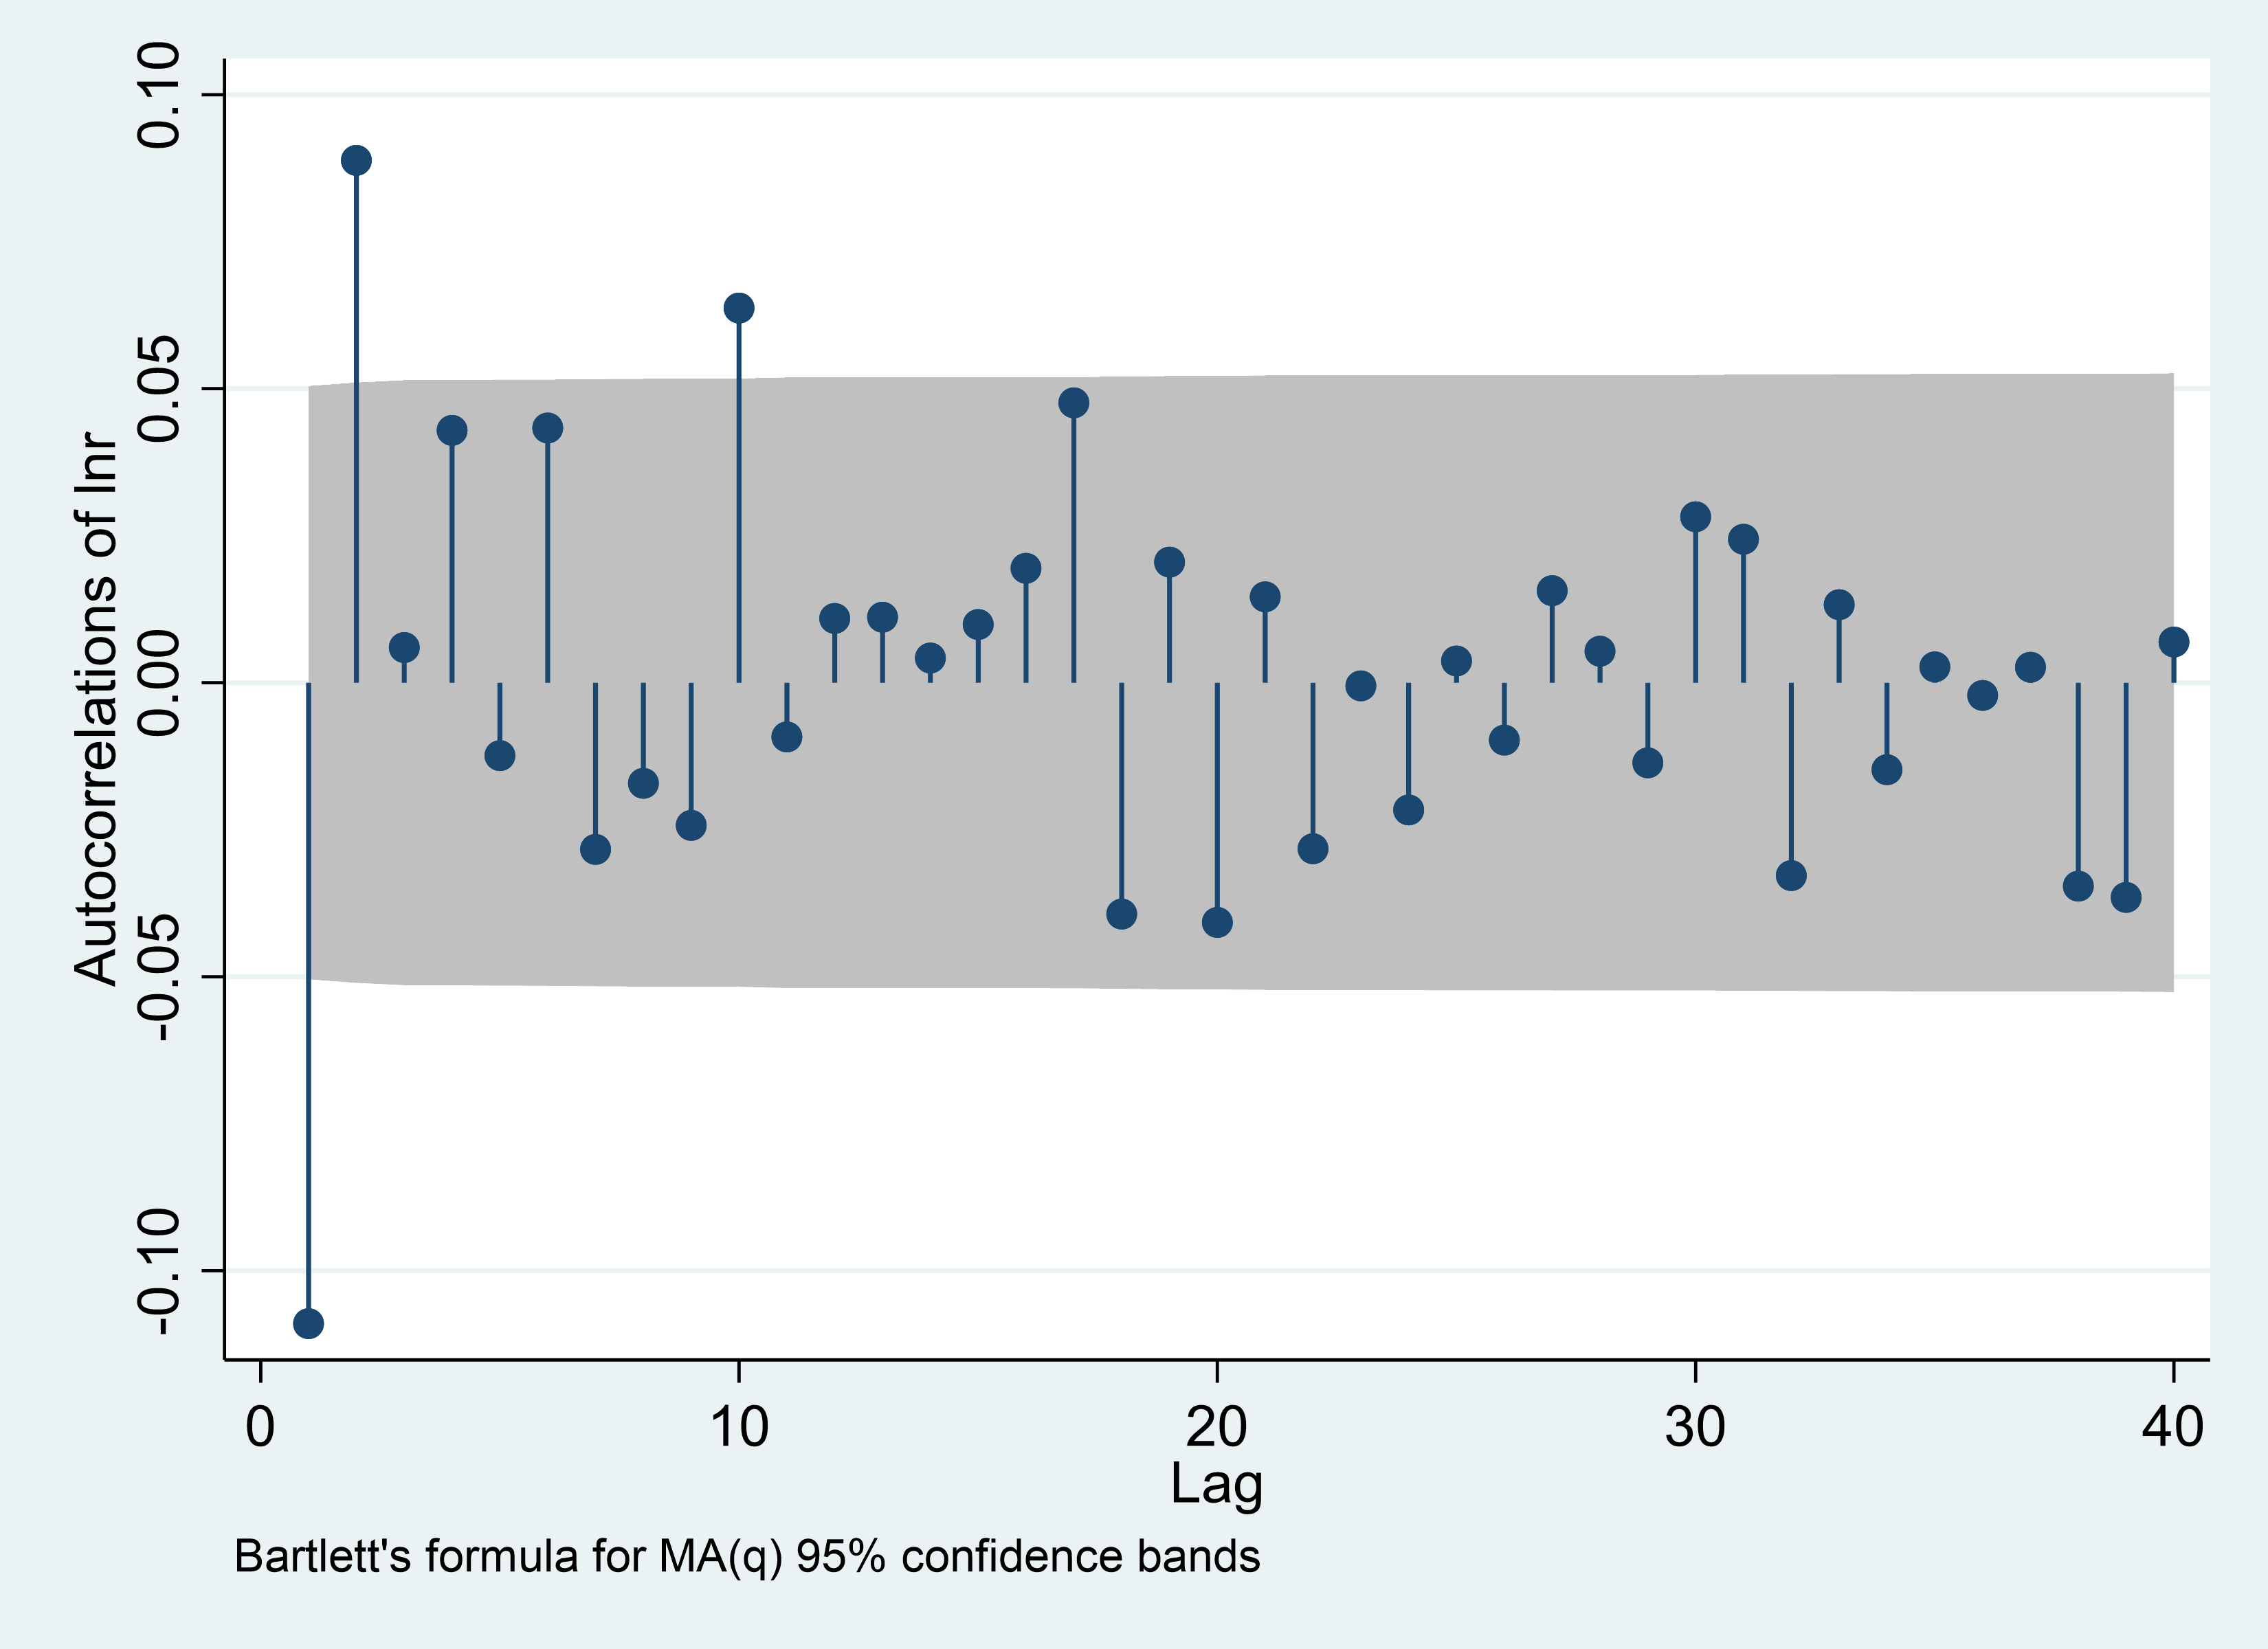
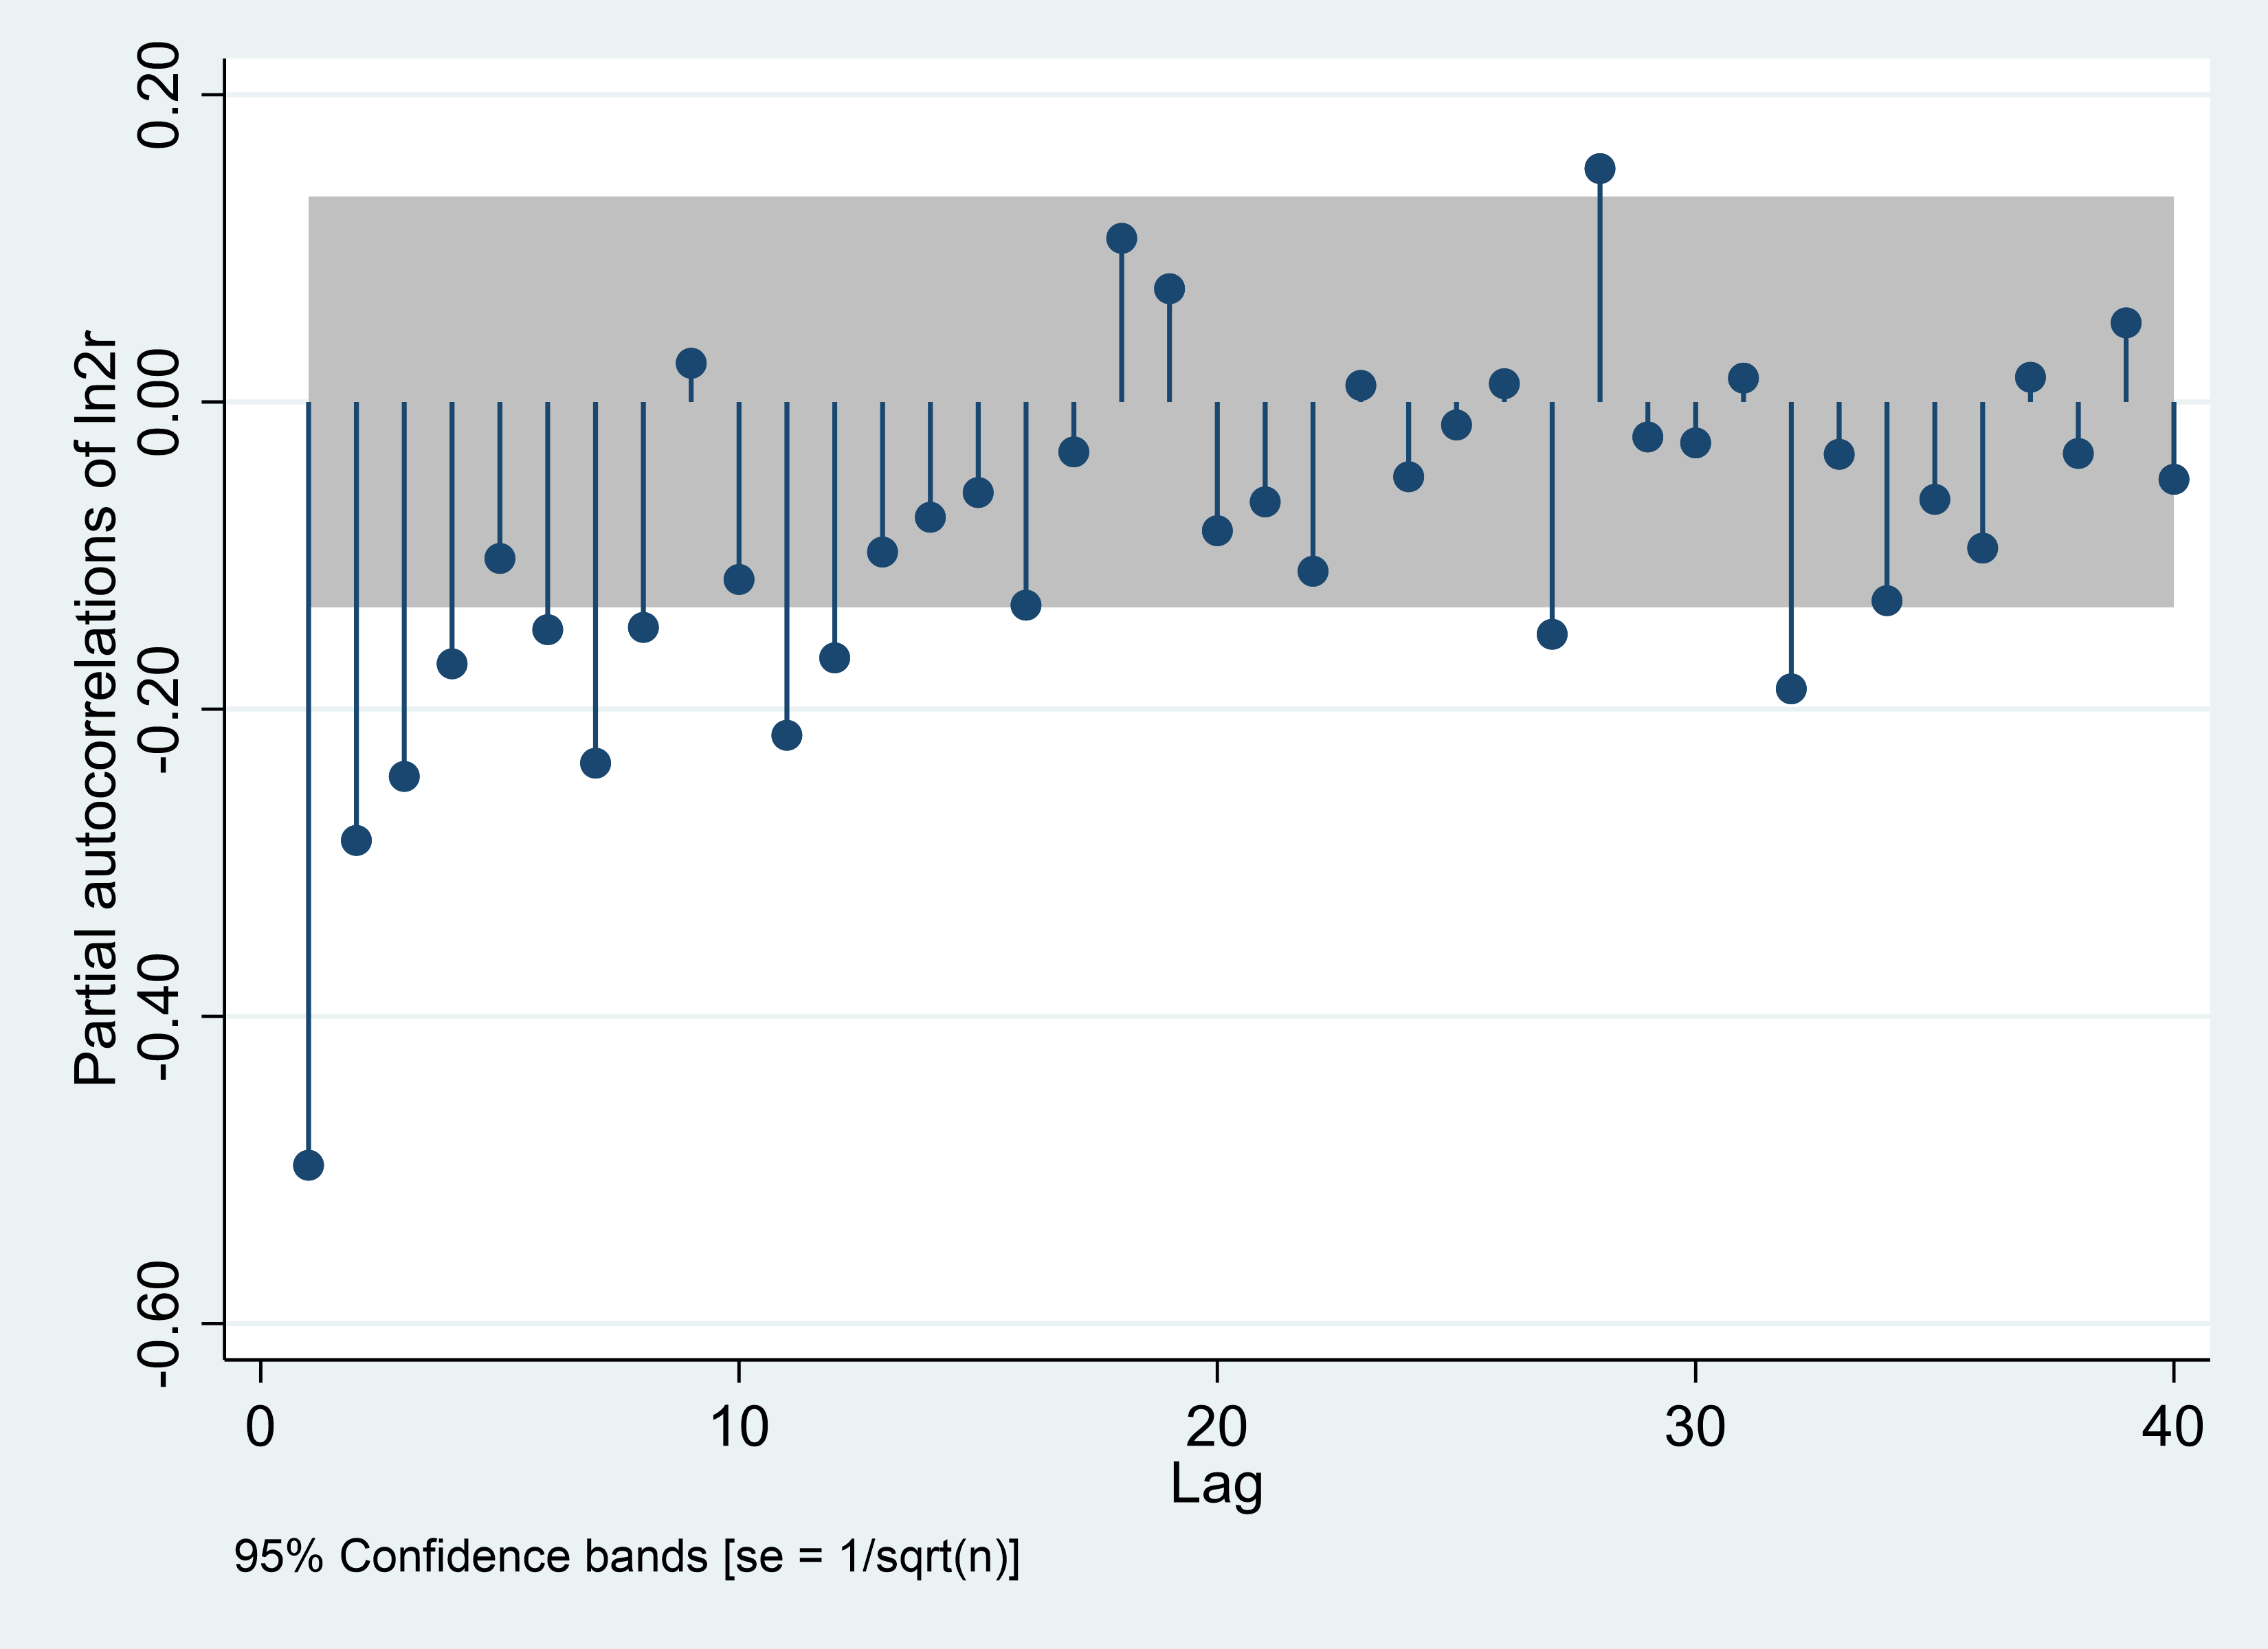
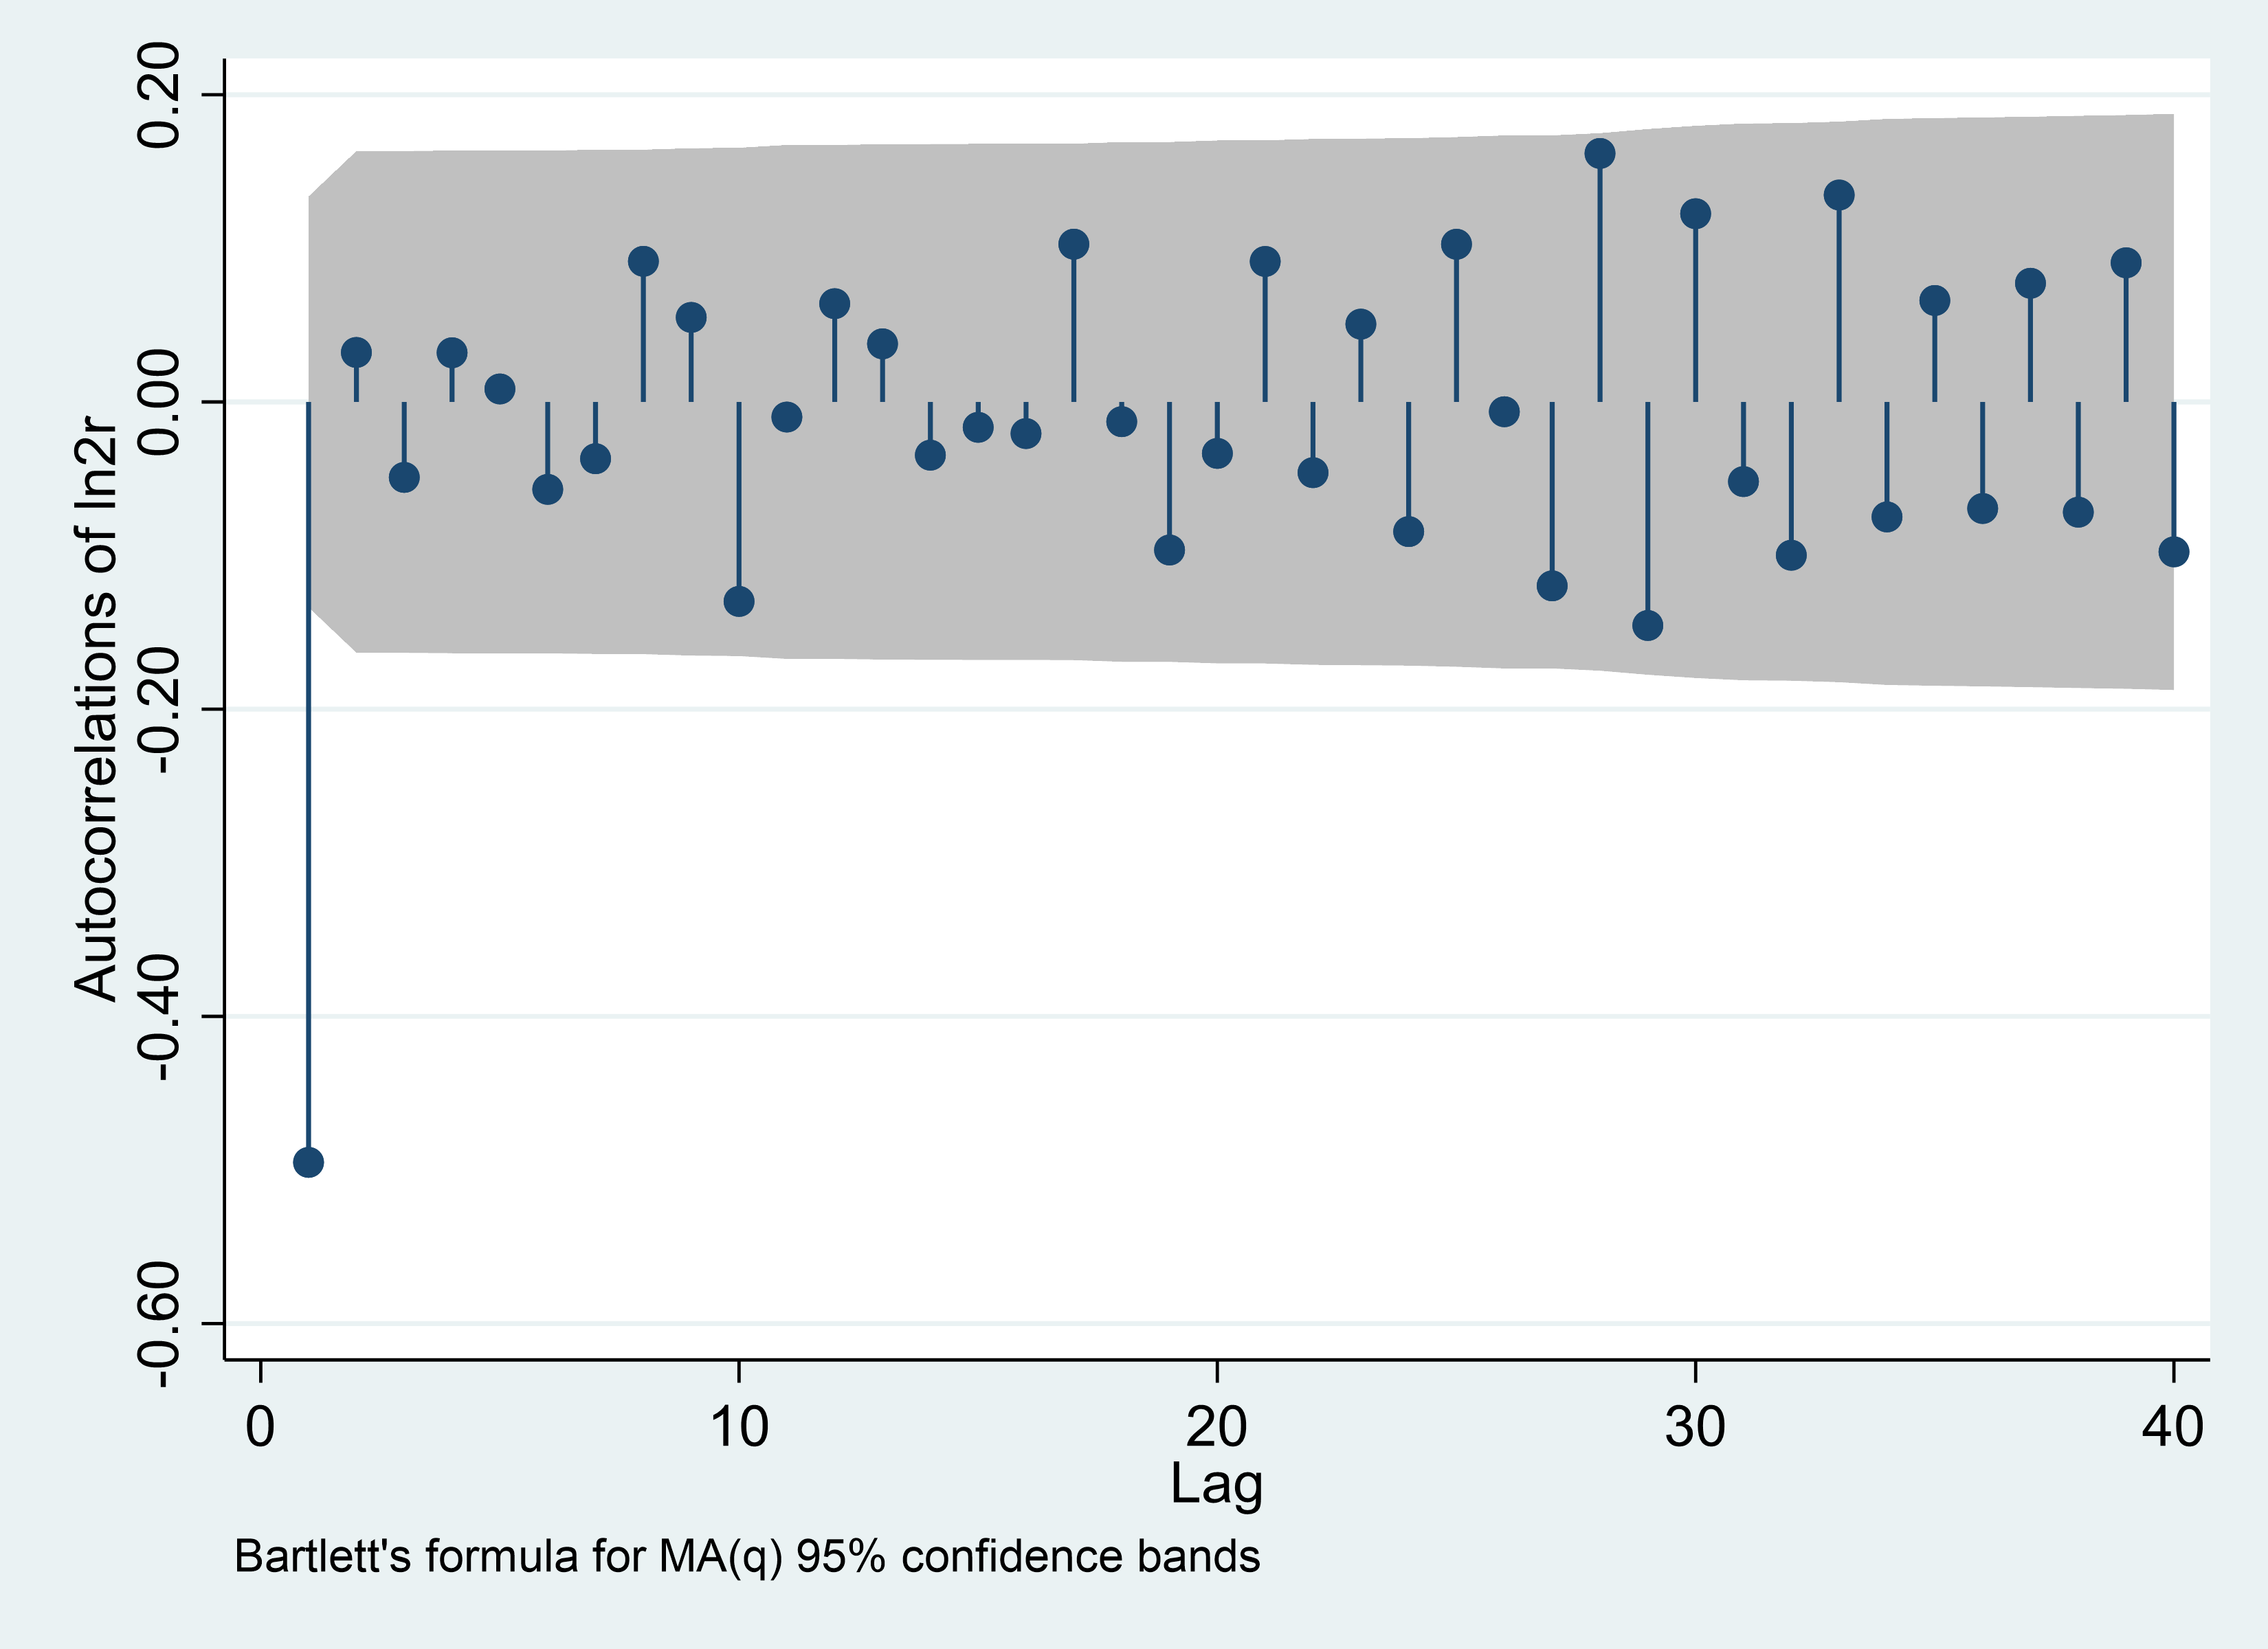
In weekly ARIMA model, the PACF shown as tailing and the ACF shown as cutoff, the last value outreaches the confidence interval in PACF is 32, however, because this value is too big and usually takes the value between 1-10, so this paper uses 8, and the last value outreaches the confidence interval in ACF is 1. Also, because the weekly data experienced two differences to pass the stationarity test, so p value is 8, d value is 2, and q value is 1.
4.2. Analysis of Influences of U.S Federal Reserve Raises Interest Rate
The results shown from the ARIMA daily model indicate that the Ethereum’s price should remain between $2500-2600 without the disturbance of U.S. Federal Reserve raising its interest rate. However, in the next week after Federal Reserve first increased its interest rate, the Ethereum’s price was boosted up to around $3100. And the results shown from the ARIMA weekly model indicate that the Ethereum’s price should increase stably without the disturbance of U.S. Federal Reserve raising its interest rate. However, the price of Ethereum experienced a faster growth than the prediction of ARIMA weekly model then dropped dramatically.
Figure 2: Actual value and fitted value, daily. |
Photo credit: Original |
That may be caused by two reasons, one is that the policy has the characteristics of hysteresis which may be caused by the delay of conveying the policy, the delay for market reaction and the characteristics of the Ethereum market. And the other reason is that the increase of the interest rate in the first time is not sufficient enough to affect the positive attitudes toward ETH. However, with America Federal Reserve’s frequent and vast increasing the interest rate, investors choose to invest other America assets instead of ETH.
America Federal Reserve increased the interest rate resulted in more investors to invest in other American assets, like bonds since Ethereum is too risky compared with bonds. Rasing interest rate will result in other America banks borrow less money from Federal Reserve because the interest rate is too high, so the cash hold by banks will decrease, the banks will lend less money than before, thus, the banks create less money than before, the money which flow in the market will decrease, then according to the demand and supply curve of money value, the money value will increase so that the inflation rate will decrease. U.S Federal Reserve was counting on this to decrease American inflation rate to increase American living quality. Because the interest rate went up so the value of American assets also went up because comparing with other countries now, America has higher interest rate so put more deposits in America can earn more money, many investors now will start to change their investments into dollar, so the value of dollar went up, some investors will draw out from the ETH market so that the price of ETH started to decrease. And that’s why the price of ETH experienced that trend.
For the delay of conveying, even though the U.S Federal Reserve published their policies very quickly, however, it takes time for the investors who participated in this market to act. Even though some investors were attracted immediately by the U.S increasing interest rate, they may not be thoroughly be prepared to invest more money in U.S market, probably they invest many foreign countries assets, and it takes time to sell other foreign countries’ assets out and get that country’s currency and then change this country’s currency into USD, and then use USD to buy the U.S assets the investors are interested in.
Figure 3: Actual value and fitted value, weekly. |
Photo credit: Original |
For the delay of the ETH market reaction, after U.S presses published the news of U.S Federal Reserve’s decisions of increasing interest rate, the participators of the ETH market need to assess the policy and decide whether to change their investment strategies or not. And some investors maybe are waiting for the following news to assess and predict the future trend of the market without doing anything, because the increment of the first time U.S Federal Reserve increased the interest rate was very small. Also, although dollar is one of the dominated currencies in global market without doubts, ETH market is also a global market that are affected by many other factors instead of just dollar change.
For the delay of the market characteristics, as ETH is a global market with low liquidity because of the rareness of Ethereum and without uniformity, the numbers of participators and exchanges in ETH market are less active, so the influences of U.S Federal Reserve may be conveyed slower.
5. Discussion
Comparing with the current works, Liao, C. and Pasak, S. have better fitting degree than this paper, their models all shown the trends of decline for Ethereum’s price. That may be caused by Liao, C. considered more factors like the correlation between Ethereum and Bitcoin and Pasak, S. used CNN-BiLSTM, the deep learning can compensate the errors made by linear model to certain extend.
This paper shows that after the Federal Reserve released its decision of increasing the interest rate, there will be a delay caused by the delay of policy and the first increment is not attractive enough, so the development of the price will follow the original trend to continue growing during this period.
For policymakers, they could acknowledge that there will be a retardance after the policy is published, so when they are considering the effects of policy, they could give the market more time to get their desired results. Also, since the policy is published, the price of Ethereum dropped sharply, the value of Ethereum shrunken 40% compared to its highest value. That may be caused by investors of Ethereum didn’t expect the huge increment of U.S. Federal Reserve. To decrease the huge shock brought on the market, policymakers could leak some potential signs or preferences of policies for investors to prepare.
For investors, they could put more attentions on relevant policies so that better strategies can be determined. They could also use the delay to make more money by holding the assets slightly longer after the policy is published. They could also invest in diversified portfolios to decrease the shock brought by a single asset.
6. Conclusion
According to the ARIMA daily and weekly model in this paper, without the influence of U.S. Federal Reserve, the price of ETH should continue to be increasing since ETH has high value of development under the advantageous environment of thriving block chain technology. However, the benchmark increment in 2022 made by U.S Federal Reserve should make the price of Ethereum decreases because bonds are more profitable, they have lower risks compared to ETH and the price of dollar will increase. But the price of Ethereum increased before it decreases, and that may be caused by the delay of policy and the increment of the interest rate made by the first time is not big enough for investors to change their investment strategies. The delay of policy may be caused by the delay of conveying the information, some investors may know the policy later after it’s published; it may also be caused by the market needs time to react to the policy; it is also related to the less activeness in ETH market. So, policymakers could acknowledge that there will be a delay after the policy is published and they could show some potential signs on new policies to decrease the shock it brings to market. Investors could put more attentions on relevant policies and use the delay to make more money.
References
[1]. Bankrate. (2023). Fed’s interest rate history: The federal funds rate from 1981 to the present. https://www.bankrate.com/banking/federal-reserve/history-of-federal-funds-rate/#2021
[2]. CBS NEWS. (2022). Fed hikes key interest rate for seventh time this year. https://www.cbsnews.com/news/federal-reserve-hikes-interest-rates-seventh-time-2022/
[3]. Federal Reserve. (2022). The Effect of the War in Ukraine on Global Activity and Inflation. https://www.federalreserve.gov/econres/notes/feds-notes/the-effect-of-the-war-in-ukraine-on-global-activity-and-inflation-20220527.html
[4]. U.S. Inflation Calculator. (2023). Current US Inflation Rates: 2000-2023. https://www.usinflationcalculator.com/inflation/current-inflation-rates/
[5]. Andrei, D., & Hasler, M. (2022). Can the Fed Control Inflation? Stock Market Implications. Stock Market Implications (September 21, 2022).
[6]. Vartanian, P. R., de Moura Jr, Á. A., Racy, J. C., & Neto, R. S. (2023). Non-Fungible Token (NFT) Prices, Cryptocurrencies, Interest Rate and Gold: An Econometric Analysis (Jan. 2019-Aug. 2022). International Journal of Economics and Finance, 15(1), 1-1.
[7]. Vujičić, Dejan & Jagodic, Dijana & Ranđić, Siniša. (2018). Blockchain technology, bitcoin, and Ethereum: A brief overview. 1-6. 10.1109/INFOTEH.2018.8345547.
[8]. Tikhomirov, S. (2018). Ethereum: state of knowledge and research perspectives. In Foundations and Practice of Security: 10th International Symposium, FPS 2017, Nancy, France, October 23-25, 2017, Revised Selected Papers 10 (pp. 206-221). Springer International Publishing.
[9]. Beneki, C., Koulis, A., Kyriazis, N. A., & Papadamou, S. (2019). Investigating volatility transmission and hedging properties between Bitcoin and Ethereum. Research in International Business and Finance, 48, 219-227.
[10]. Rathee, N., Singh, A., Sharda, T., Goel, N., Aggarwal, M., & Dudeja, S. (2023). Analysis and price prediction of cryptocurrencies for historical and live data using ensemble-based neural networks. Knowledge and Information Systems, 1-30.
[11]. Liao, C., Lu, K., & Zhang, J. (2023, April). Cryptocurrency Price Tendency Analysis Using Conventional Statistical Model and Machine Learning Approach. In Proceedings of the International Conference on Financial Innovation, FinTech and Information Technology, FFIT 2022, October 28-30, 2022, Shenzhen, China.
[12]. Pasak, S., & Jayadi, R. (2023). Investment Decision on Cryptocurrency: Comparing Prediction Performance Using ARIMA and LSTM. Journal of Information Systems and Informatics, 5(2), 407-427.
Cite this article
Cheng,H. (2023). The Impact of Federal Reserve Increasing Interest Rate on ETH Market. Advances in Economics, Management and Political Sciences,58,36-43.
Data availability
The datasets used and/or analyzed during the current study will be available from the authors upon reasonable request.
Disclaimer/Publisher's Note
The statements, opinions and data contained in all publications are solely those of the individual author(s) and contributor(s) and not of EWA Publishing and/or the editor(s). EWA Publishing and/or the editor(s) disclaim responsibility for any injury to people or property resulting from any ideas, methods, instructions or products referred to in the content.
About volume
Volume title: Proceedings of the 2nd International Conference on Financial Technology and Business Analysis
© 2024 by the author(s). Licensee EWA Publishing, Oxford, UK. This article is an open access article distributed under the terms and
conditions of the Creative Commons Attribution (CC BY) license. Authors who
publish this series agree to the following terms:
1. Authors retain copyright and grant the series right of first publication with the work simultaneously licensed under a Creative Commons
Attribution License that allows others to share the work with an acknowledgment of the work's authorship and initial publication in this
series.
2. Authors are able to enter into separate, additional contractual arrangements for the non-exclusive distribution of the series's published
version of the work (e.g., post it to an institutional repository or publish it in a book), with an acknowledgment of its initial
publication in this series.
3. Authors are permitted and encouraged to post their work online (e.g., in institutional repositories or on their website) prior to and
during the submission process, as it can lead to productive exchanges, as well as earlier and greater citation of published work (See
Open access policy for details).
References
[1]. Bankrate. (2023). Fed’s interest rate history: The federal funds rate from 1981 to the present. https://www.bankrate.com/banking/federal-reserve/history-of-federal-funds-rate/#2021
[2]. CBS NEWS. (2022). Fed hikes key interest rate for seventh time this year. https://www.cbsnews.com/news/federal-reserve-hikes-interest-rates-seventh-time-2022/
[3]. Federal Reserve. (2022). The Effect of the War in Ukraine on Global Activity and Inflation. https://www.federalreserve.gov/econres/notes/feds-notes/the-effect-of-the-war-in-ukraine-on-global-activity-and-inflation-20220527.html
[4]. U.S. Inflation Calculator. (2023). Current US Inflation Rates: 2000-2023. https://www.usinflationcalculator.com/inflation/current-inflation-rates/
[5]. Andrei, D., & Hasler, M. (2022). Can the Fed Control Inflation? Stock Market Implications. Stock Market Implications (September 21, 2022).
[6]. Vartanian, P. R., de Moura Jr, Á. A., Racy, J. C., & Neto, R. S. (2023). Non-Fungible Token (NFT) Prices, Cryptocurrencies, Interest Rate and Gold: An Econometric Analysis (Jan. 2019-Aug. 2022). International Journal of Economics and Finance, 15(1), 1-1.
[7]. Vujičić, Dejan & Jagodic, Dijana & Ranđić, Siniša. (2018). Blockchain technology, bitcoin, and Ethereum: A brief overview. 1-6. 10.1109/INFOTEH.2018.8345547.
[8]. Tikhomirov, S. (2018). Ethereum: state of knowledge and research perspectives. In Foundations and Practice of Security: 10th International Symposium, FPS 2017, Nancy, France, October 23-25, 2017, Revised Selected Papers 10 (pp. 206-221). Springer International Publishing.
[9]. Beneki, C., Koulis, A., Kyriazis, N. A., & Papadamou, S. (2019). Investigating volatility transmission and hedging properties between Bitcoin and Ethereum. Research in International Business and Finance, 48, 219-227.
[10]. Rathee, N., Singh, A., Sharda, T., Goel, N., Aggarwal, M., & Dudeja, S. (2023). Analysis and price prediction of cryptocurrencies for historical and live data using ensemble-based neural networks. Knowledge and Information Systems, 1-30.
[11]. Liao, C., Lu, K., & Zhang, J. (2023, April). Cryptocurrency Price Tendency Analysis Using Conventional Statistical Model and Machine Learning Approach. In Proceedings of the International Conference on Financial Innovation, FinTech and Information Technology, FFIT 2022, October 28-30, 2022, Shenzhen, China.
[12]. Pasak, S., & Jayadi, R. (2023). Investment Decision on Cryptocurrency: Comparing Prediction Performance Using ARIMA and LSTM. Journal of Information Systems and Informatics, 5(2), 407-427.